Insurance Agency Dashboard in Excel is a powerful, ready-to-use analytics template built for insurance professionals who want to track policy performance, claims activity, agent productivity, premium collection, and customer satisfaction from one centralized Excel workbook. Whether you run a small insurance brokerage or manage a large agency with multiple agents across different regions, this dashboard delivers instant clarity on how your agency is performing across every critical dimension.
Instead of relying on scattered spreadsheets and manual reports, this Insurance Agency Dashboard in Excel brings all your critical KPIs into one interactive interface with 5 dedicated analysis pages, dynamic slicers, and pivot-powered charts that update automatically when you refresh your data. Built entirely in Microsoft Excel, it requires no VBA macros, no add-ins, and no advanced technical skills.
Click here to Purchase Insurance Agency Dashboard in Excel
Key Features of Insurance Agency Dashboard in Excel
This insurance analytics template includes 5 interactive dashboard pages, a structured data sheet, and a support sheet with pivot tables. It tracks 5 key performance indicators including Total Policies, Total Premium, Total Claims, Total Commission, and Average Satisfaction Score. The dashboard uses pivot table slicers for instant filtering by policy type, channel, region, and other dimensions. All charts and KPI cards refresh automatically when you update the data and click Refresh All in the Excel ribbon.
Dashboard Pages Explained
1. Overview Page
The Overview page serves as the command center of your insurance analytics. At the top, five high-level KPI cards display Total Policies, Total Premium, Total Claims, Total Commission, and Avg. Satisfaction. Below the cards, four interactive charts provide deeper insights: Claim Frequency % by Channel shows which distribution channels have the highest claim rates, Total Policies by Policy Type breaks down your portfolio composition, Total Premium Vs Total Claims by Region compares revenue against claims across geographic areas, and Total Premium by Region highlights which regions contribute the most premium revenue. Multiple slicers allow you to filter the entire dashboard instantly by any dimension.
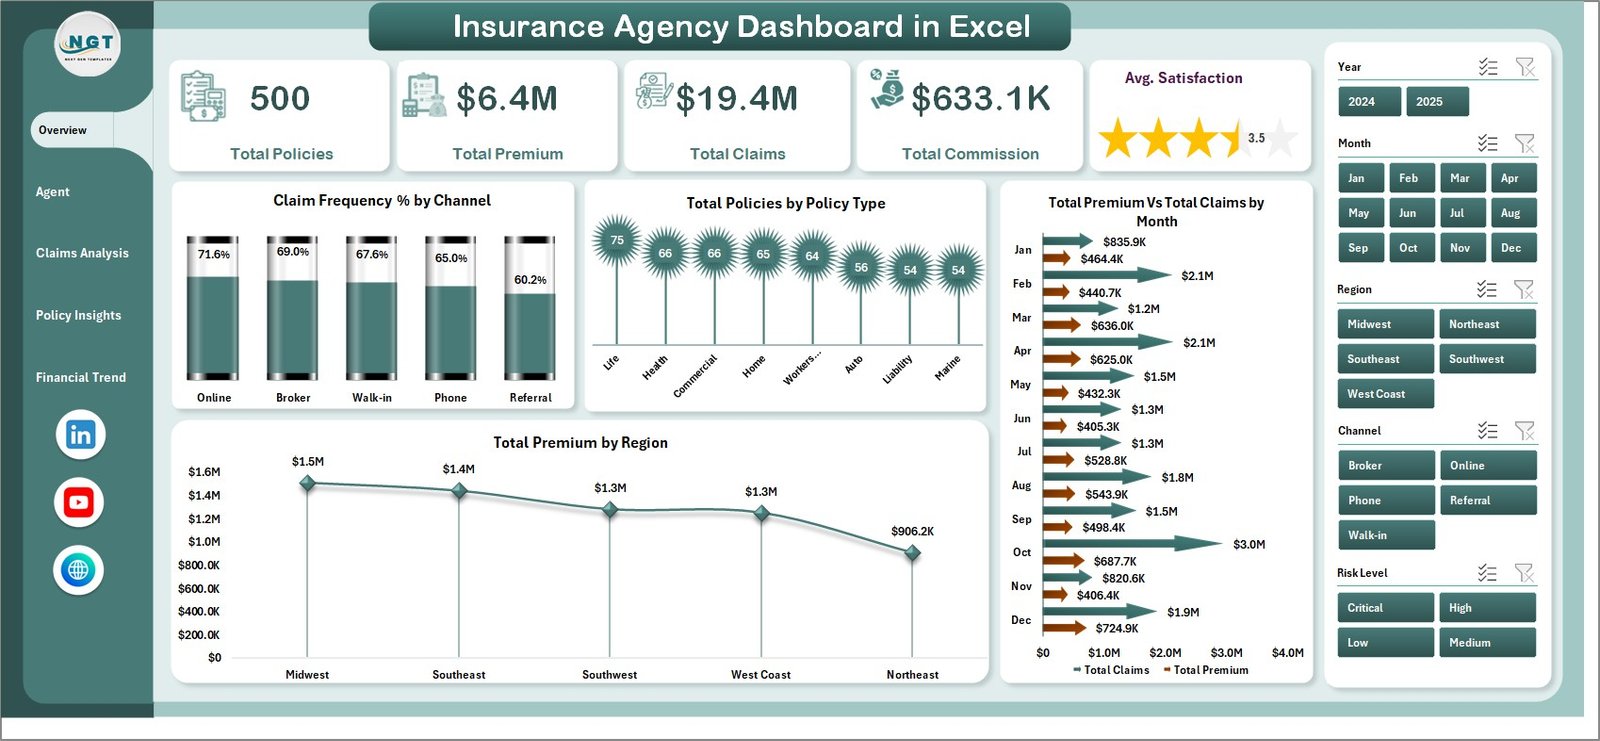 Insurance Agency Dashboard in Excel
2. Agent Performance
The Agent Performance page evaluates individual agent productivity and effectiveness across multiple metrics. Avg. Satisfaction by Top Five Agent ranks agents by customer satisfaction scores, helping identify who delivers the best client experience. Total Policies by Top Five Agent shows which agents are writing the most business. Total Commission by Top Five Agent reveals the highest earners, while Total Premium Vs Total Claims by Top Five Agent compares each agent’s revenue generation against the claims burden they bring in. This page is essential for performance reviews, incentive planning, and coaching decisions.
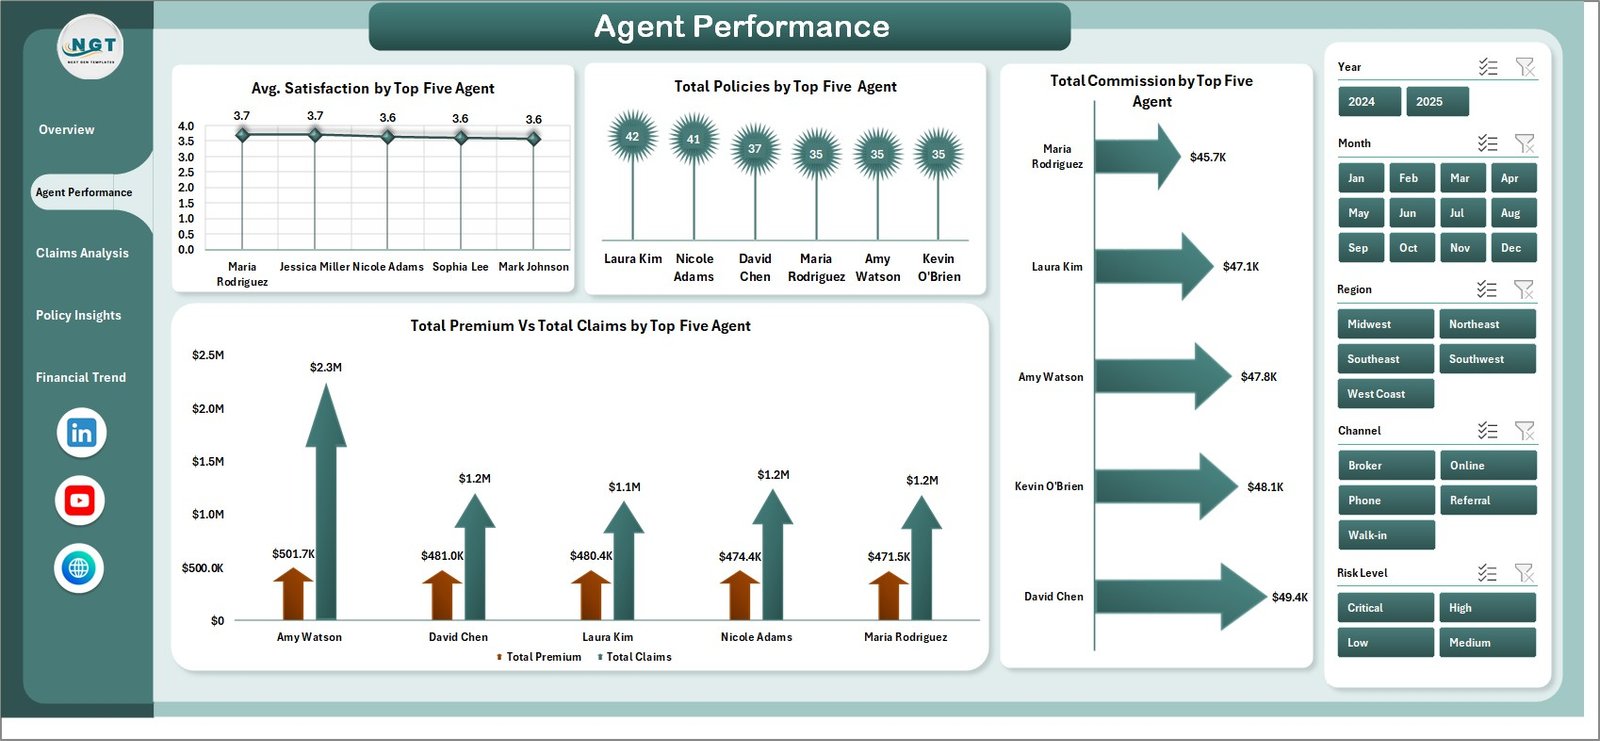 Agent Performance
3. Claims Analysis
The Claims Analysis page provides a deep dive into claims behavior and risk patterns across your agency. Total Policies by Claim Status shows the distribution of active, pending, and settled claims. Total Claims by Policy Type identifies which product lines generate the most claims exposure. Total Claims Filed by Customer Segment reveals which customer groups are filing the most claims, and Total Claims Vs Total Premium by Risk Level compares claims cost against premium collected for each risk tier. This analysis is critical for underwriting decisions and risk management strategy. For a Google Sheets alternative, explore the Policy Performance and Risk Analysis Dashboard in Google Sheets.
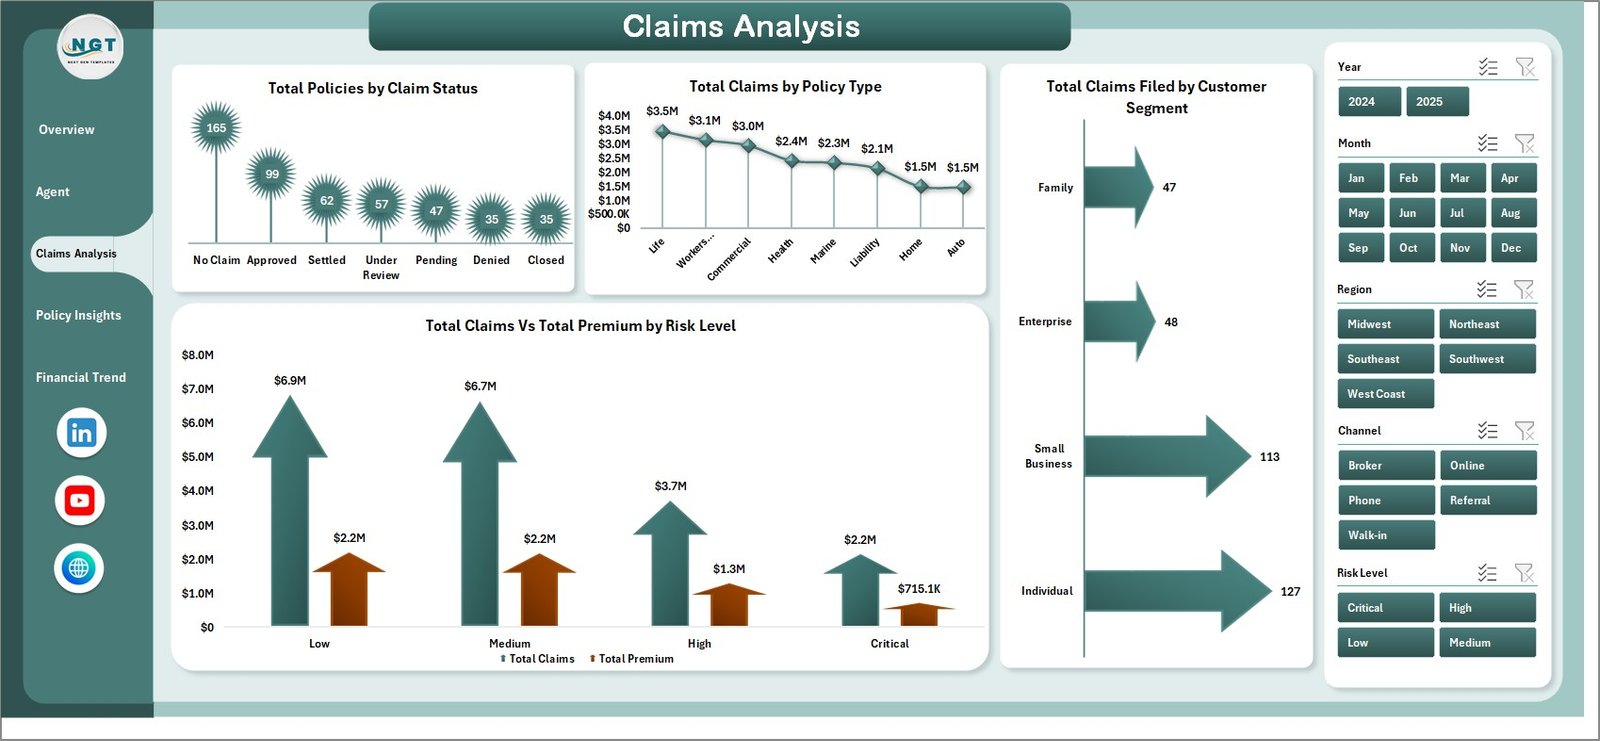 Claims Analysis
4. Policy Insights
The Policy Insights page helps you understand your policy portfolio composition and customer distribution. Total Premium by Customer Segment shows where your premium revenue is concentrated. Total Policies by Channel reveals which distribution channels are most effective. Claim Frequency % by Customer Segment highlights which customer groups have the highest claim rates relative to their policy count, and Total Premium by Policy Type breaks down revenue by insurance product. These insights are invaluable for marketing strategy and product development decisions.
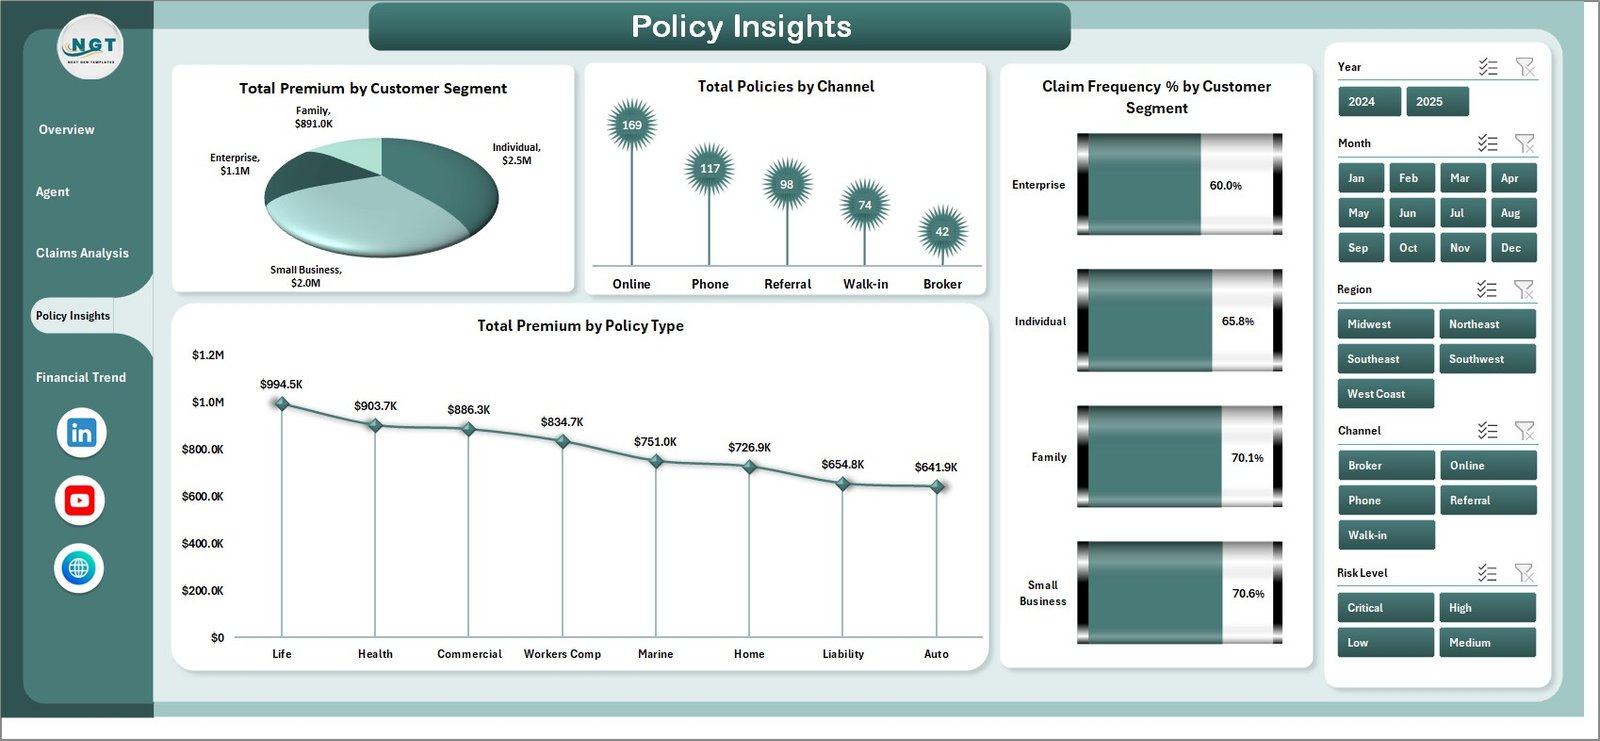 Policy Insights
5. Financial Trend
The Financial Trend page tracks your agency’s financial performance over time. Total Claims by Region shows geographic claims distribution for loss monitoring. Total Premium by Payment Frequency reveals how customers prefer to pay their premiums. Total Policies by Risk Level displays your portfolio risk distribution, and Total Commission by Month tracks earning trends throughout the year. This page is essential for budgeting, forecasting, and strategic financial planning.
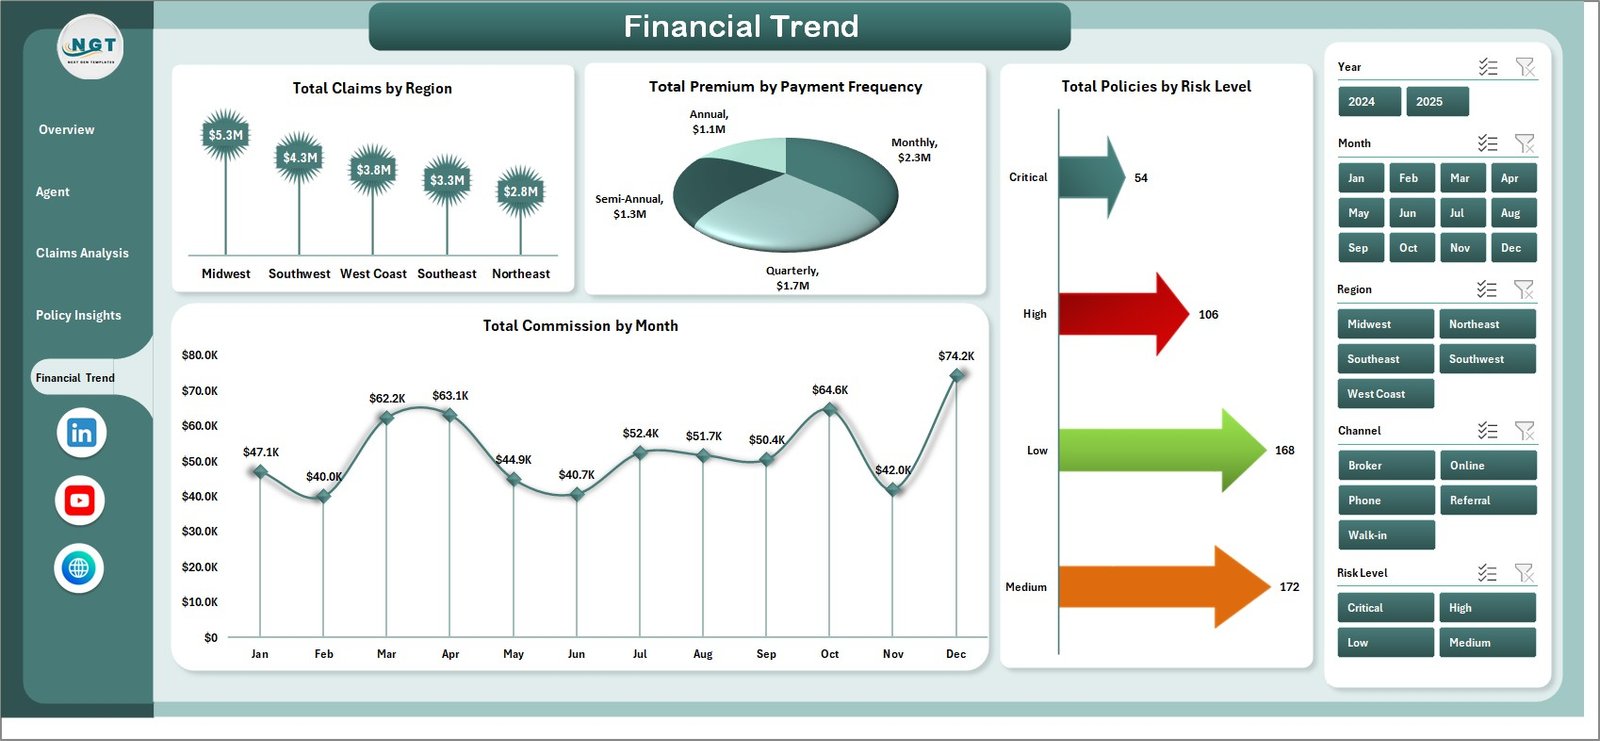 Financial Trend
6. Data Sheet
The Data Sheet is the structured input sheet where you enter your insurance agency records. It comes pre-loaded with sample data in the correct format. Simply replace the sample records with your own policy, claims, agent, premium, and customer data and the entire dashboard updates automatically when you refresh.
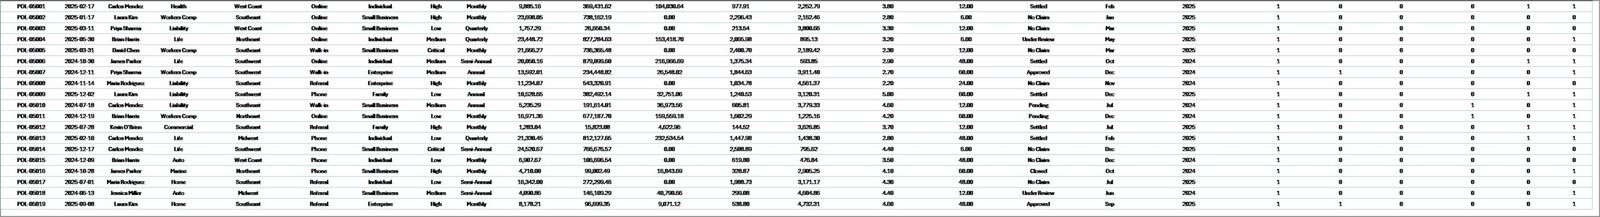 Data Sheet Tab
7. Support Sheet
The Support Sheet contains all the pivot tables that power the entire dashboard dynamically. After updating your data in the Data Sheet, simply go to the Data tab in the Excel Ribbon and click Refresh All. Every pivot table will refresh and all charts across all 5 dashboard pages will update automatically. You can keep this sheet hidden during daily use and presentations.
 Support Sheet Tab
Advantages of Insurance Agency Dashboard in Excel
This dashboard eliminates the need for multiple scattered reports by centralizing all insurance analytics into one workbook. The pivot-table architecture ensures accuracy and eliminates manual formula errors. Dynamic slicers enable instant filtering without modifying any data. The professional design is presentation-ready for agency meetings, quarterly reviews, and management reporting. Because it runs in standard Microsoft Excel, there is no additional software cost or learning curve. The template is fully customizable so you can add new columns, modify chart styles, or extend the analysis to fit your specific agency needs.
Opportunities for Improvement
While this dashboard provides comprehensive insurance analytics, agencies with very large datasets exceeding tens of thousands of records may experience slower pivot table refresh times in older versions of Excel. For agencies requiring real-time data connectivity or automated data feeds from insurance management systems, a Power BI version would offer better integration capabilities. Additionally, agencies needing predictive analytics or machine learning-based risk scoring would benefit from more advanced BI tools.
Best Practices
Keep your data consistent by using standardized values for policy types, channels, regions, and agent names. Refresh all pivot tables after every data update by clicking Refresh All in the Data ribbon tab. Use the slicers on the Overview page to create focused views for different stakeholders. Review the Agent Performance page monthly for performance reviews and incentive planning. Monitor the Claims Analysis page regularly to identify emerging risk trends before they become costly. Export filtered views to PDF for sharing with stakeholders who do not have Excel access.
Click here to Purchase Insurance Agency Dashboard in Excel
Explore Relevant Templates
Policy Performance and Risk Analysis Dashboard in Google Sheets — Track policy performance, risk exposure, premiums, and claims in a collaborative Google Sheets dashboard.
Hospital Patient Flow Dashboard in Excel — Monitor patient flow, treatment costs, wait times, and satisfaction with an interactive Excel dashboard.
Dental Practice Dashboard in Excel — Track dental clinic performance metrics including treatments, dentist performance, and insurance analytics.
Browse All Excel Dashboard Templates
Frequently Asked Questions
What KPIs does the Insurance Agency Dashboard in Excel track?
The Insurance Agency Dashboard in Excel tracks 5 key performance indicators on the overview page: Total Policies, Total Premium, Total Claims, Total Commission, and Average Satisfaction. Additional analysis covers agent performance rankings, claim frequency by channel, risk level distribution, customer segment breakdown, and monthly commission trends across 5 interactive dashboard pages.
Do I need advanced Excel skills to use this insurance dashboard?
No. This template is built with pivot tables and slicers that work automatically. Simply paste your insurance data into the Data Sheet tab, click Refresh All in the Excel ribbon, and every chart and KPI card updates instantly. No formulas to write, no VBA macros required.
Can I customize this dashboard for my insurance agency?
Yes. Since the dashboard is powered by pivot tables, any new policy types, agents, regions, or customer segments you add to the Data Sheet will automatically appear in the charts after refreshing. You can also modify chart styles, colors, and slicer layouts using standard Excel formatting tools.
What is the best Excel template for tracking insurance agency performance?
The Insurance Agency Dashboard in Excel from NextGenTemplates is one of the most comprehensive options available. It covers policy tracking, claims analysis, agent performance, customer segmentation, and financial trends across 5 dedicated dashboard pages with automatic pivot-table refresh, making it ideal for any insurance agency looking to make data-driven decisions.
How many dashboard pages are included in this template?
The template includes 5 interactive dashboard pages (Overview, Agent Performance, Claims Analysis, Policy Insights, and Financial Trend), plus a Data Sheet for input and a Support Sheet containing all pivot tables. That is 7 sheet tabs in total.
Is this template compatible with Google Sheets?
This template is designed specifically for Microsoft Excel. Pivot-table slicers and certain chart features may not render correctly in Google Sheets. For a Google Sheets alternative for insurance analytics, check out the Policy Performance and Risk Analysis Dashboard in Google Sheets.
Conclusion
The Insurance Agency Dashboard in Excel is a must-have analytics tool for any insurance professional looking to gain instant visibility into policy performance, claims trends, agent productivity, and financial health. With 5 interactive dashboard pages, 5 KPI cards, dynamic slicers, and automatic pivot-table refresh, this template transforms raw insurance data into actionable business intelligence. Download it today and start making smarter, data-driven decisions for your insurance agency.
Click here to Purchase Insurance Agency Dashboard in Excel
🎥 Visit our YouTube channel to learn step-by-step video tutorials
👉 Youtube.com/@PK-AnExcelExpert