Managing Intellectual Property (IP) is no longer limited to filing patents or registering trademarks. Instead, organizations now treat IP as a strategic business asset. Therefore, they must measure performance, track progress, and compare results continuously. Because of this need, an Intellectual Property (IP) KPI Dashboard in Power BI becomes extremely important.
This detailed guide explains what an Intellectual Property KPI Dashboard in Power BI is, how it works, why it matters, and how each dashboard page helps decision-makers. Moreover, you will explore its advantages, best practices, use cases, and frequently asked questions. By the end of this article, you will clearly understand how this dashboard transforms raw IP data into actionable insights.
Click to Purchases Intellectual Property (IP) KPI Dashboard in Power BI
What Is an Intellectual Property (IP) KPI Dashboard in Power BI?
An Intellectual Property (IP) KPI Dashboard in Power BI is an interactive reporting solution that tracks, monitors, and analyzes key performance indicators related to intellectual property activities.
Instead of reviewing scattered Excel sheets, static reports, or manual summaries, this dashboard centralizes all IP KPIs in one visual interface. As a result, legal teams, R&D leaders, compliance officers, and senior management gain instant visibility into IP performance.
Moreover, because the dashboard runs on Power BI, users can interact with slicers, drill through KPIs, and analyze trends across months and years.
Why Do Organizations Need an IP KPI Dashboard?
Organizations generate and manage multiple IP assets such as patents, trademarks, copyrights, and licenses. However, without structured tracking, teams struggle to answer basic questions.
For example:
-
Are IP targets meeting expectations?
-
Which KPIs underperform month to date (MTD)?
-
How does current performance compare with the previous year?
-
Are long-term IP goals on track?
Because manual tracking cannot answer these questions efficiently, organizations adopt an IP KPI Dashboard in Power BI to gain clarity, accuracy, and control.
How Does an Intellectual Property KPI Dashboard in Power BI Work?
The dashboard works by combining Excel-based data input with Power BI’s interactive visuals. First, users update KPI data in structured Excel sheets. Then, Power BI reads and processes this data to generate real-time insights.
Consequently, teams can:
-
Track MTD and YTD performance
-
Compare actuals vs targets
-
Analyze year-over-year trends
-
Identify risks early
What Data Sources Does the IP KPI Dashboard Use?
The dashboard uses Excel as the data source, which makes it simple and flexible. Users only need to update three worksheets, and the dashboard refreshes automatically.
1) Input_Actual Sheet
This sheet captures actual KPI values.
You need to fill:
-
KPI Name
-
Month (first date of the month)
-
MTD values
-
YTD values
Because the structure remains fixed, data consistency improves significantly.
Click to Purchases Intellectual Property (IP) KPI Dashboard in Power BI
2) Input_Target Sheet
This sheet stores target KPI values.
You need to fill:
-
KPI Name
-
Month (first date of the month)
-
Target MTD values
-
Target YTD values
As a result, the dashboard can calculate target vs actual performance automatically.
3) KPI Definition Sheet
This sheet defines each KPI clearly.
You need to fill:
-
KPI Number
-
KPI Group
-
KPI Name
-
Unit
-
Formula
-
Definition
-
Type (LTB – Lower the Better or UTB – Upper the Better)
Because definitions remain centralized, confusion disappears across teams.
What Are the Key Pages in the Intellectual Property KPI Dashboard in Power BI?
The dashboard contains three well-structured pages, each serving a specific purpose.
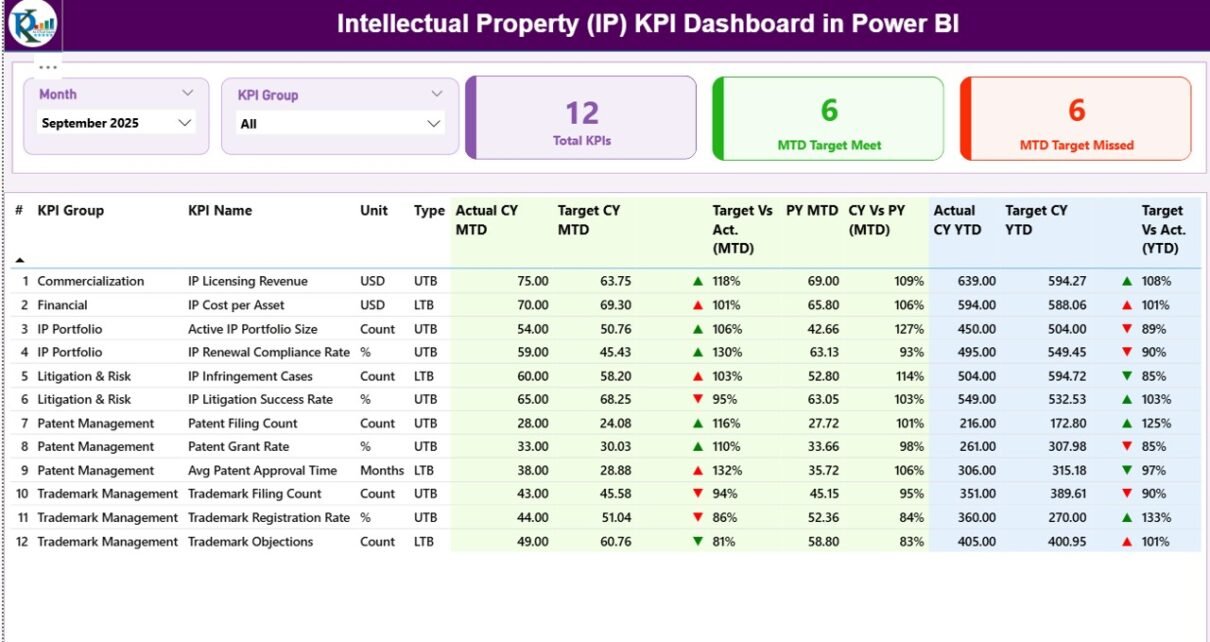
1) Summary Page: How Does It Give a Complete IP Performance Overview?
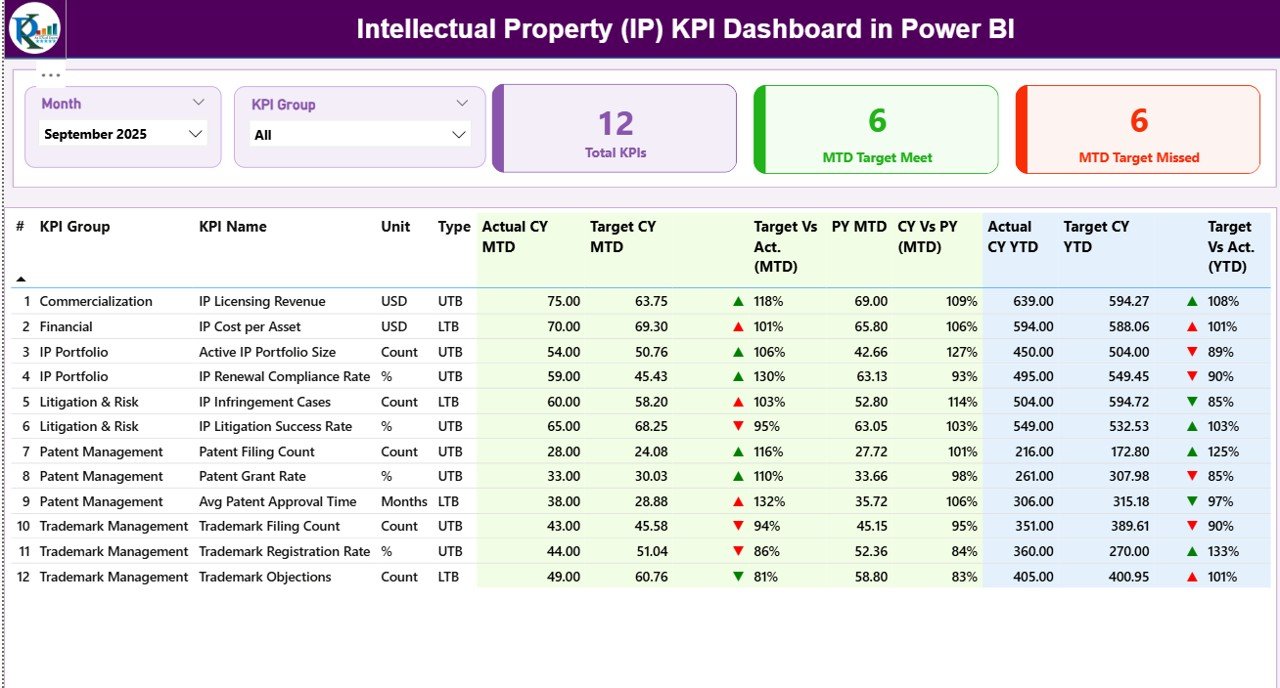
The Summary Page acts as the control center of the IP KPI Dashboard.
What Slicers Are Available on the Summary Page?
At the top, users can filter data using:
-
Month slicer
-
KPI Group slicer
Because of these slicers, users can focus only on relevant KPIs.
What KPI Cards Are Displayed?
The Summary Page displays three important KPI cards:
-
Total KPIs Count
-
MTD Target Met Count
-
MTD Target Missed Count
These cards immediately highlight overall IP performance status.
What Information Does the Detailed KPI Table Show?
Below the KPI cards, a detailed table provides in-depth KPI-level insights.
It includes:
-
KPI Number – Sequence number of the KPI
-
KPI Group – Category of the KPI
-
KPI Name – Name of the KPI
-
Unit – Measurement unit
-
Type – LTB or UTB
How Does the Dashboard Show MTD Performance?
Click to Purchases Intellectual Property (IP) KPI Dashboard in Power BI
For MTD analysis, the table displays:
-
Actual CY MTD – Current year actual MTD value
-
Target CY MTD – Current year target MTD value
-
MTD Icon –
-
▲ Green arrow when performance meets or exceeds target
-
▼ Red arrow when performance misses target
-
-
Target vs Actual (MTD) – Percentage calculated as:
Actual MTD / Target MTD -
PY MTD – Previous year MTD value
-
CY vs PY (MTD) – Percentage comparison of current vs previous year
Because of this structure, users can instantly spot underperforming IP KPIs.
How Does the Dashboard Show YTD Performance?
Similarly, the table displays YTD metrics:
-
Actual CY YTD
-
Target CY YTD
-
YTD Icon – ▲ or ▼ with color indicators
-
Target vs Actual (YTD) – Actual YTD / Target YTD
-
PY YTD
-
CY vs PY (YTD) – Year-over-year YTD comparison
As a result, long-term IP performance becomes easy to evaluate.
2) KPI Trend Page: How Can You Analyze IP Trends Over Time?
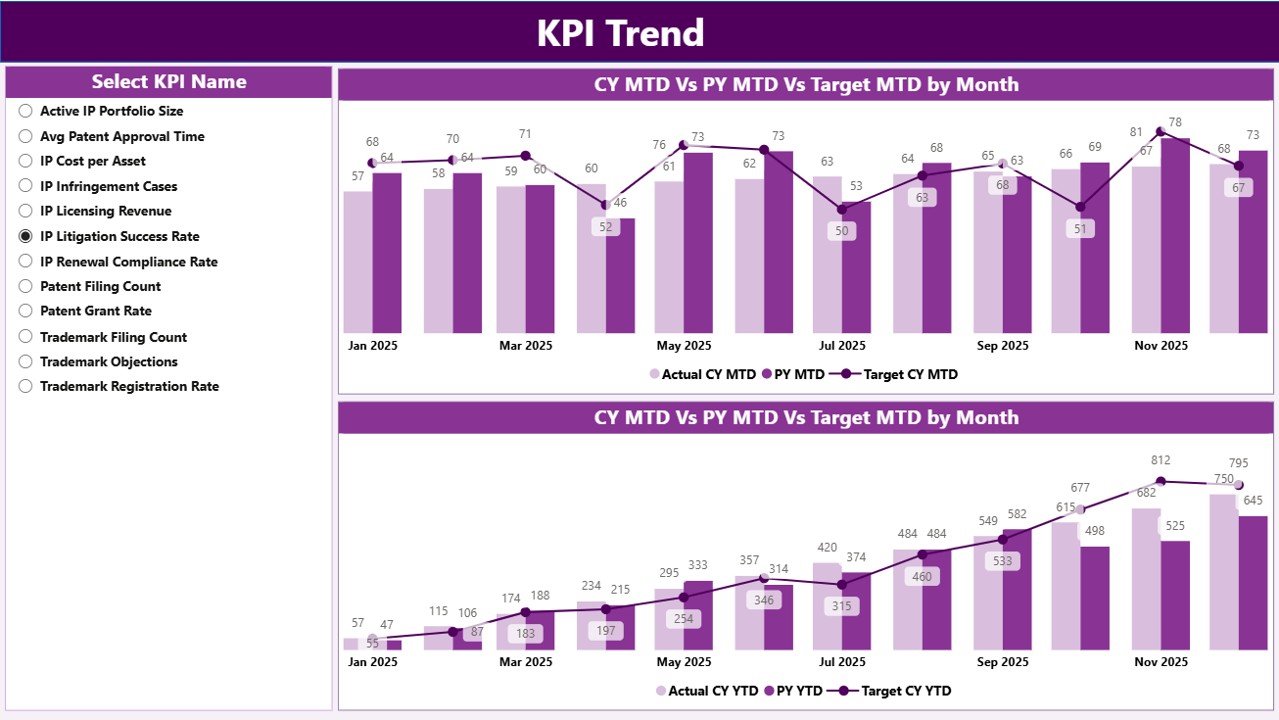
The KPI Trend Page focuses on trend analysis.
What Visuals Are Used on the KPI Trend Page?
This page contains two combo charts:
-
MTD Trend Chart
-
YTD Trend Chart
Each chart displays:
-
Actual values for the current year
-
Actual values for the previous year
-
Target values
Because combo charts combine bars and lines, trends become clear and intuitive.
How Do Users Select KPIs on the Trend Page?
A KPI Name slicer appears on the left side. Users can select any KPI to view its trend instantly.
Therefore, stakeholders can analyze one KPI at a time without clutter.
Click to Purchases Intellectual Property (IP) KPI Dashboard in Power BI
3) KPI Definition Page: Why Is It Important?
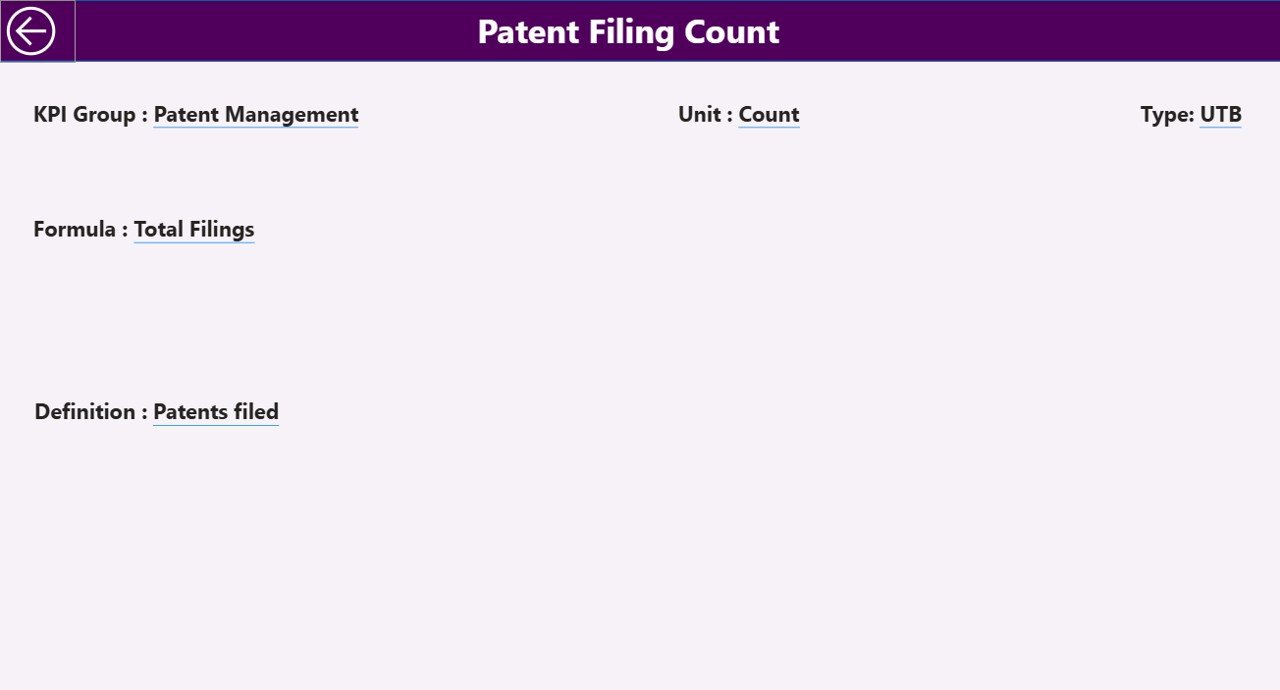
The KPI Definition Page acts as a reference guide.
What Makes This Page Special?
-
It remains hidden by default
-
Users access it via drill-through from the Summary Page
What Information Does the KPI Definition Page Show?
It displays:
-
KPI Formula
-
KPI Definition
-
Measurement logic
Because of this, users never misunderstand KPI calculations.
To return to the Summary Page, users simply click the Back button on the top-left corner.
What Are the Advantages of an Intellectual Property (IP) KPI Dashboard in Power BI?
1) Centralized IP Performance Monitoring
All IP KPIs appear in one dashboard. Therefore, teams avoid scattered reports.
2) Faster Decision-Making
Because insights update instantly, leaders act quickly on risks and opportunities.
3) Clear Target vs Actual Visibility
Visual indicators make underperformance obvious.
4) Year-over-Year Performance Comparison
MTD and YTD comparisons show growth or decline clearly.
5) Improved Accountability
Defined KPIs and targets encourage ownership across teams.
6) Reduced Manual Effort
Excel-based input combined with Power BI automation saves time.
Who Should Use an Intellectual Property KPI Dashboard?
This dashboard works perfectly for:
-
Legal and IP teams
-
R&D departments
-
Compliance teams
-
Innovation leaders
-
Senior management
-
Strategy and planning teams
Because the dashboard stays flexible, both small and large organizations can use it.
What Are the Best Practices for the Intellectual Property KPI Dashboard in Power BI?
1) Define KPIs Clearly Before Implementation
Always finalize KPI definitions, formulas, and ownership first.
2) Maintain Clean and Consistent Excel Data
Ensure dates use the first day of each month and values stay accurate.
3) Review MTD KPIs Frequently
Monthly reviews help detect issues early.
4) Track Both LTB and UTB KPIs Separately
This approach avoids misinterpretation of performance indicators.
5) Use Trend Analysis for Strategic Planning
Trend pages reveal long-term IP performance patterns.
6) Keep KPI Definitions Updated
Whenever KPI logic changes, update the definition sheet immediately.
What Challenges Does an IP KPI Dashboard Solve?
Click to Purchases Intellectual Property (IP) KPI Dashboard in Power BI
Without this dashboard:
-
IP data remains fragmented
-
Targets lack visibility
-
Trend analysis becomes time-consuming
-
Decision-making slows down
However, with this dashboard:
-
Data becomes structured
-
Insights appear instantly
-
Risks surface early
-
Strategy improves
Conclusion: Why Should You Use an Intellectual Property KPI Dashboard in Power BI?
An Intellectual Property (IP) KPI Dashboard in Power BI transforms complex IP data into clear, actionable insights. Instead of manual tracking, organizations gain real-time visibility into MTD and YTD performance, trends, and targets.
Moreover, because the dashboard uses Excel for data input and Power BI for visualization, it stays both powerful and user-friendly. As a result, IP teams improve performance, accountability, and strategic decision-making.
If your organization treats intellectual property as a valuable asset, then this dashboard becomes a must-have tool.
Frequently Asked Questions (FAQs)
1) What is an Intellectual Property KPI Dashboard in Power BI?
It is an interactive dashboard that tracks IP-related KPIs using Excel data and Power BI visuals.
2) Can I customize KPIs in this dashboard?
Yes. You can add, modify, or remove KPIs by updating the Excel input sheets.
3) Does this dashboard support MTD and YTD analysis?
Yes. It provides both MTD and YTD metrics along with target comparisons.
4) What does LTB and UTB mean?
LTB means Lower the Better, while UTB means Upper the Better.
5) Do I need advanced Power BI skills to use this dashboard?
No. You only need basic Excel knowledge to update data.
6) Can this dashboard help with IP strategy planning?
Yes. Trend analysis and year-over-year comparisons support long-term IP planning.
Visit our YouTube channel to learn step-by-step video tutorials