In today’s fast-paced financial environment, investment banks handle an enormous amount of data daily. From deal values to client satisfaction and profit margins, the need for accurate, real-time analysis has never been greater. The Investment Banking Dashboard in Excel is a ready-to-use, interactive, and powerful solution that transforms complex banking data into actionable insights.
This article explores every detail about the Investment Banking Dashboard in Excel — including its structure, features, advantages, best practices, and frequently asked questions. Whether you’re a financial analyst, portfolio manager, or banking executive, this dashboard will help you manage deals, analyze profits, and monitor performance across multiple dimensions — all within Microsoft Excel.
Click to Purchases Investment Banking Dashboard in Excel
What Is an Investment Banking Dashboard in Excel?
An Investment Banking Dashboard in Excel is a dynamic data visualization and reporting tool that tracks key performance indicators (KPIs) for investment banking operations. It simplifies complex data from multiple sources into meaningful visuals and metrics.
This dashboard allows users to:
-
Evaluate deal performance by region, sector, or client type.
-
Analyze profit margins, fees, and risk ratings in one view.
-
Compare monthly trends for performance evaluation.
-
Monitor client satisfaction and identify areas for improvement.
By integrating Excel’s analytical power with interactive charts and slicers, this dashboard empowers decision-makers to analyze performance and make informed financial decisions with confidence.
Click to Purchases Investment Banking Dashboard in Excel
Why Investment Banking Needs Dashboards
Investment banking is a data-intensive field. Analysts and executives handle complex datasets involving mergers, acquisitions, financing deals, and client portfolios. Without proper visualization, valuable insights often remain hidden within spreadsheets.
That’s where a well-structured dashboard becomes a game-changer. It allows professionals to:
-
Track ongoing and closed deals instantly.
-
Compare performance across banks, clients, and sectors.
-
Identify profitable opportunities and reduce financial risks.
-
Present data visually in meetings or investor presentations.
In short, it transforms traditional Excel reports into a live, data-driven command center for investment performance.
Click to Purchases Investment Banking Dashboard in Excel
Key Features of the Investment Banking Dashboard in Excel
The Investment Banking Dashboard includes five main analytical pages, along with a support sheet and data sheet for backend data management. Let’s explore each page in detail.
1. Overview Page — The Central Performance Snapshot
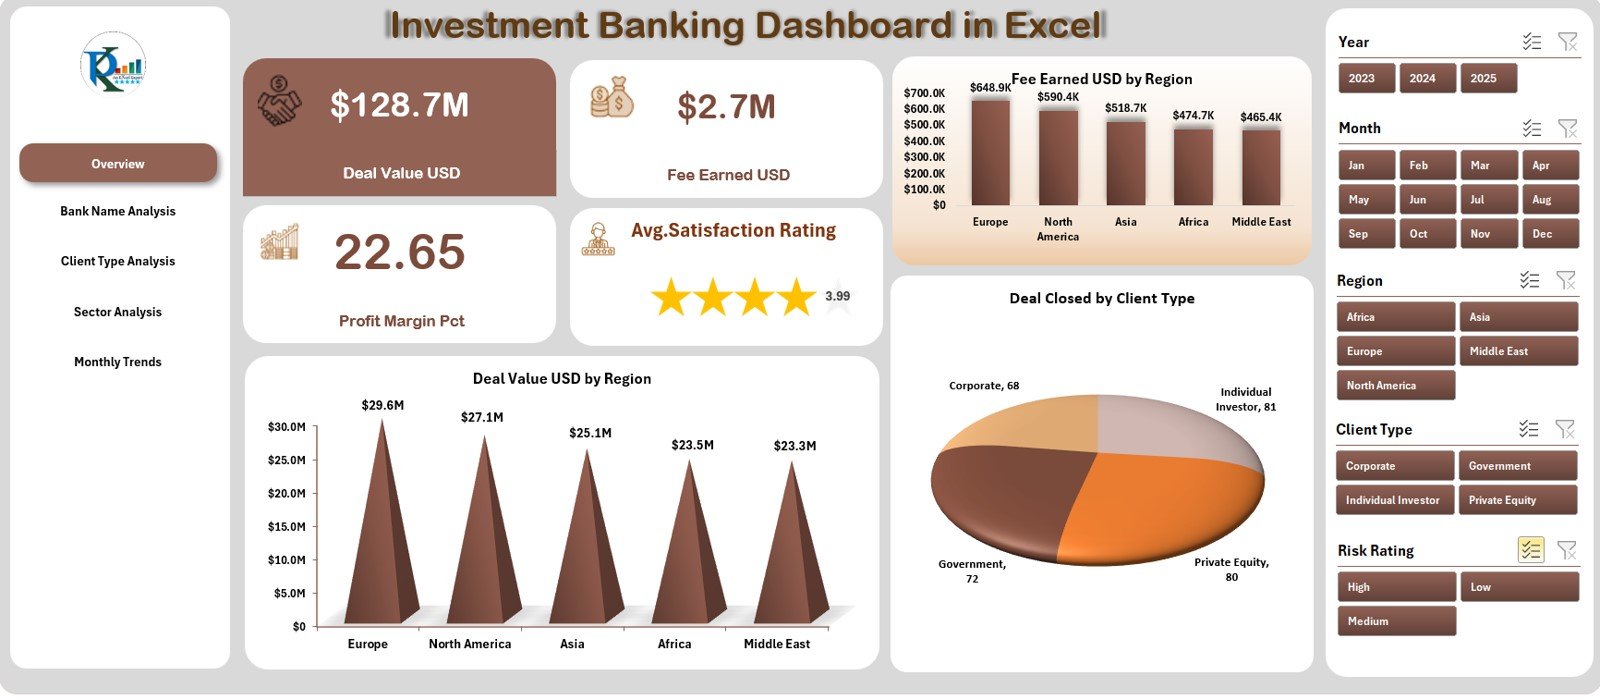
The Overview Page is the main hub of the dashboard. It provides a holistic view of key financial metrics and KPIs.
Highlights of the Overview Page:
-
Page Navigator: Located on the left side, it helps users quickly switch between different pages.
-
Slicers: Positioned on the right side, slicers allow filtering data by period, region, or sector.
-
Cards: Four key performance cards display top-level metrics like total deal value, total fees earned, and profit margin percentage.
-
Charts:
-
Deal Value (USD) by Region
-
Fee Earned (USD) by Region
-
Deals Closed by Client Type
-
This page provides a real-time executive summary that helps decision-makers understand the company’s performance at a glance.
2. Bank Name Analysis — Measuring Institutional Performance
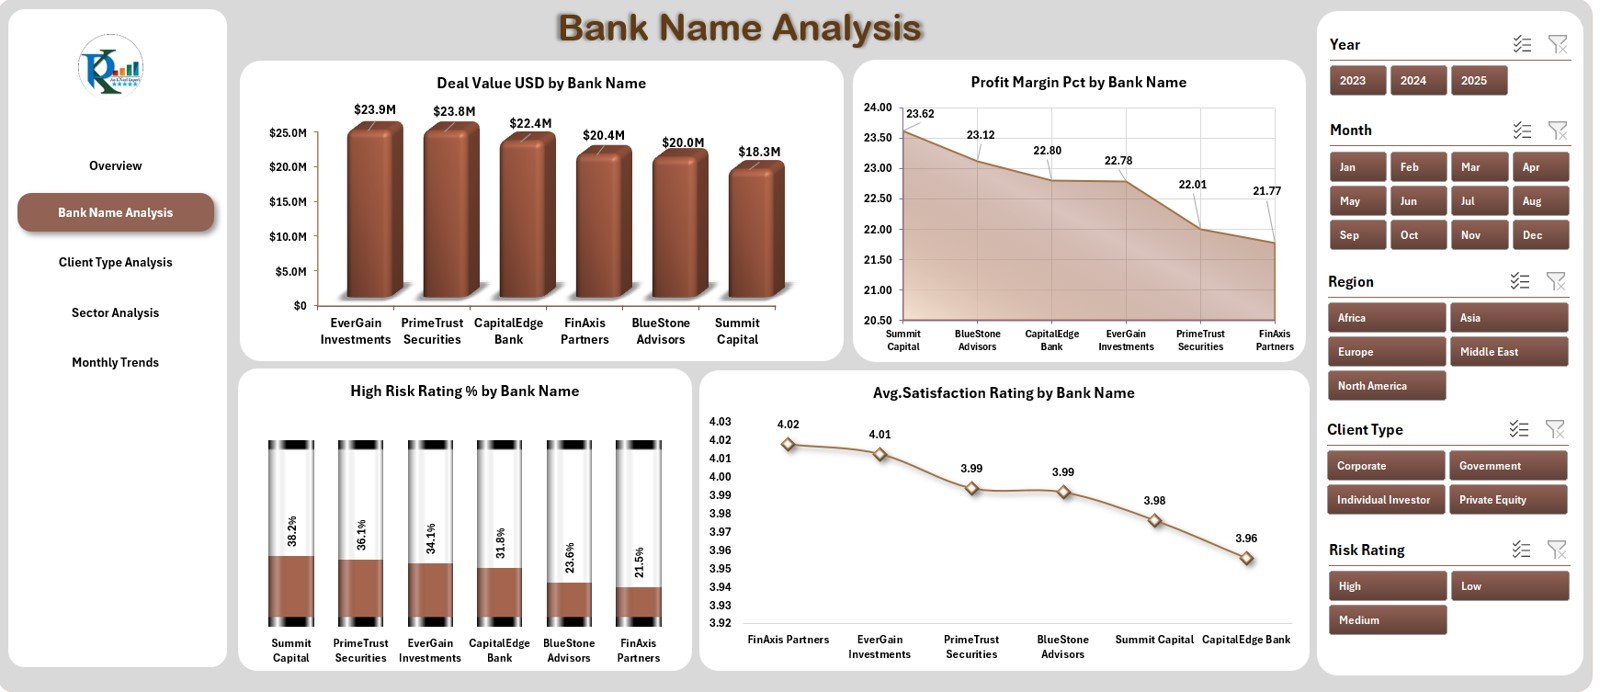
The Bank Name Analysis Page focuses on evaluating how each bank performs across multiple metrics.
Key Visuals on This Page:
-
Deal Value (USD) by Bank Name — Identifies which banks handle higher transaction volumes.
-
Profit Margin (%) by Bank Name — Measures profitability per institution.
-
High-Risk Rating (%) by Bank Name — Highlights potential exposure to risky clients or deals.
-
Average Satisfaction Rating by Bank Name — Shows client perceptions and satisfaction levels.
This page helps management teams identify which banks deliver consistent results and which require strategic support or improvement.
3. Client Type Analysis — Understanding Customer Segments
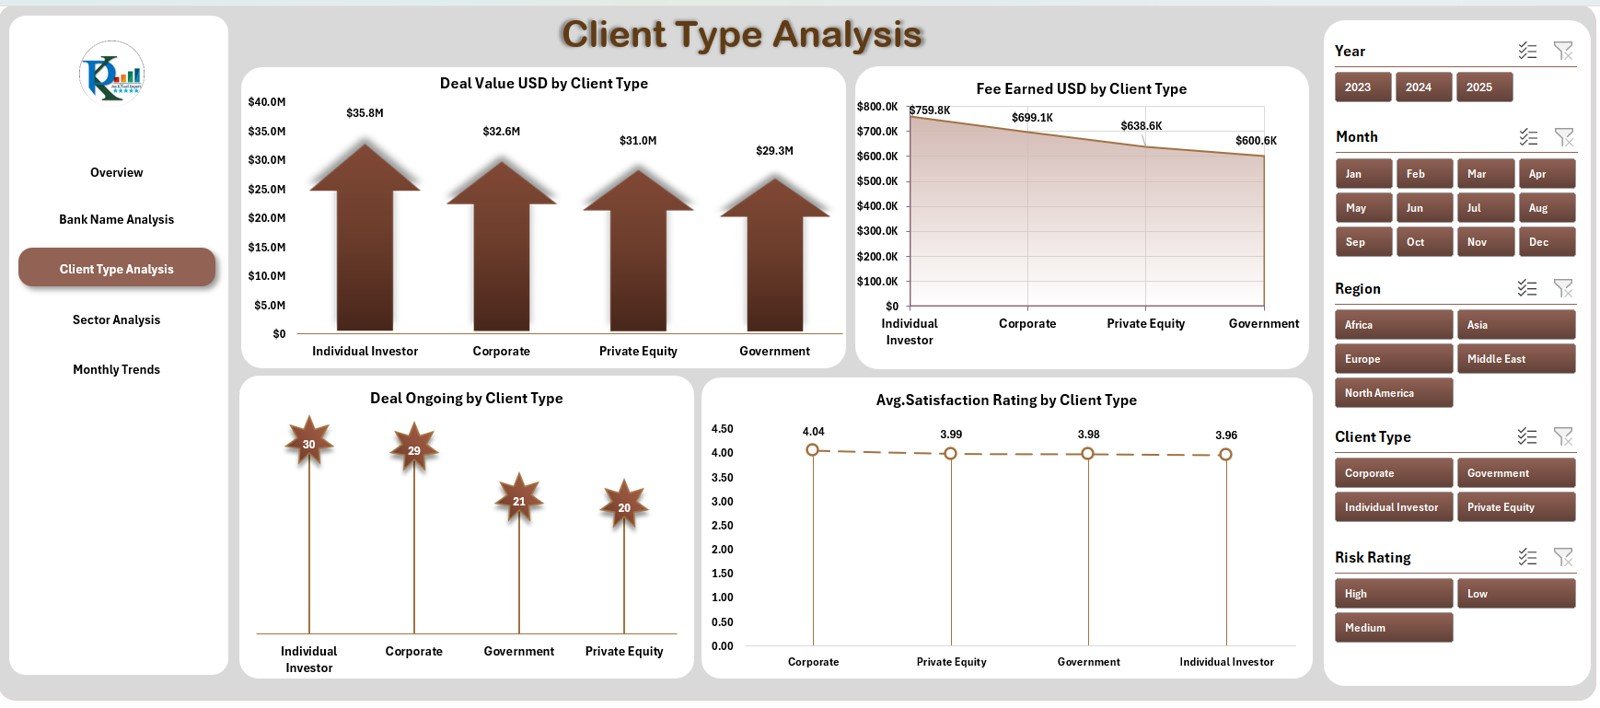
The Client Type Analysis Page gives an in-depth understanding of different client categories such as retail investors, corporate clients, and institutional investors.
Charts and Insights Include:
-
Deal Value (USD) by Client Type — Displays which client segment contributes most to revenue.
-
Fee Earned (USD) by Client Type — Compares profitability across client groups.
-
Deals Ongoing by Client Type — Tracks the number of active deals for each client segment.
-
Average Satisfaction Rating by Client Type — Provides insight into client experience and relationship quality.
This analysis allows investment banks to tailor their strategies, improve client relationships, and focus on high-value segments.
4. Sector Analysis — Tracking Industry-Specific Performance
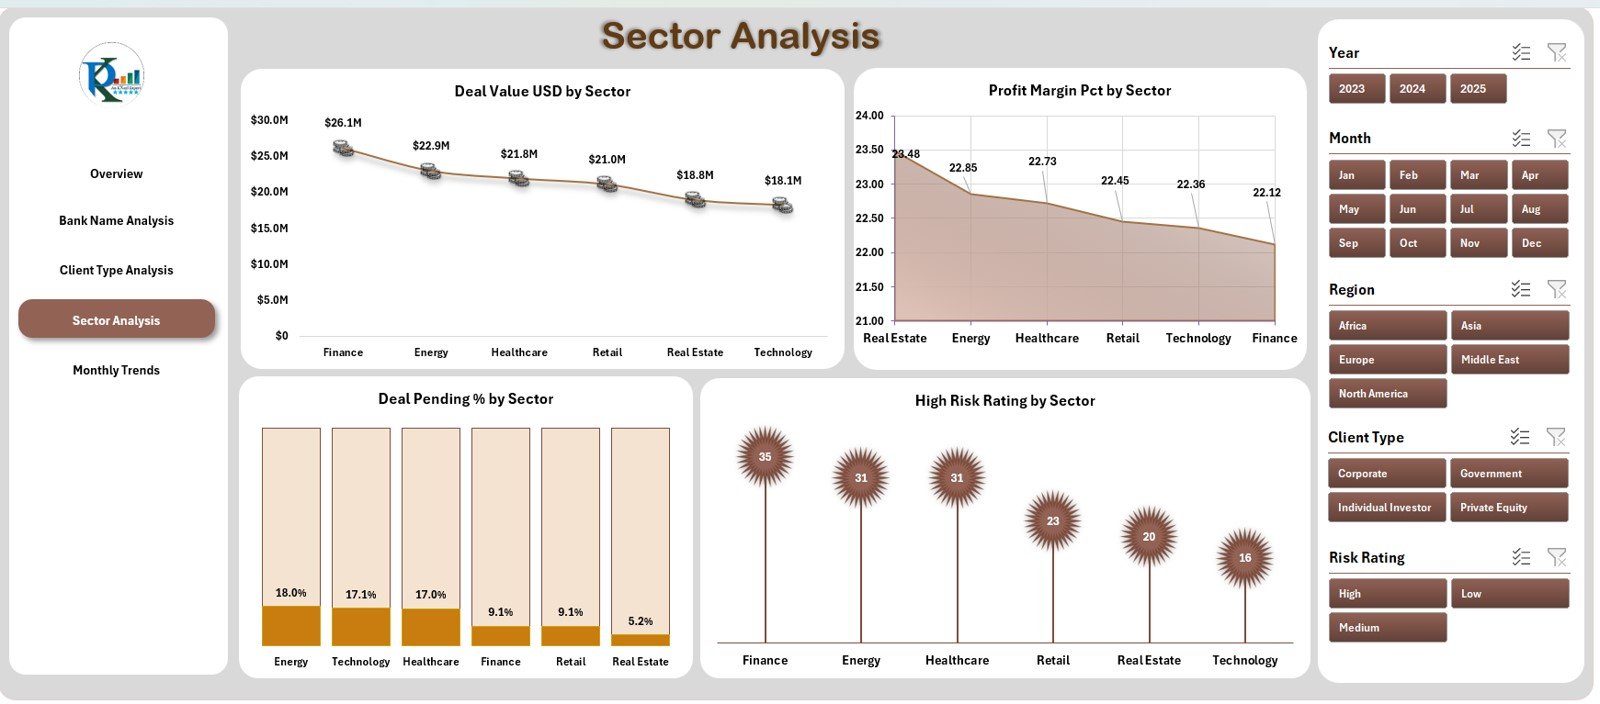
The Sector Analysis Page evaluates deals and profitability across various industry sectors like technology, healthcare, energy, real estate, and manufacturing.
Main Visuals and Metrics:
-
Deal Value (USD) by Sector — Identifies leading industries based on transaction value.
-
Profit Margin (%) by Sector — Highlights which sectors yield higher margins.
-
Deals Pending (%) by Sector — Shows sectors where deal closures are delayed.
-
High-Risk Rating (%) by Sector — Points out sectors with higher investment risks.
This insight helps banks allocate resources wisely and strengthen their portfolio balance across industries.
Click to Purchases Investment Banking Dashboard in Excel
5. Monthly Trends — Tracking Financial Growth Over Time
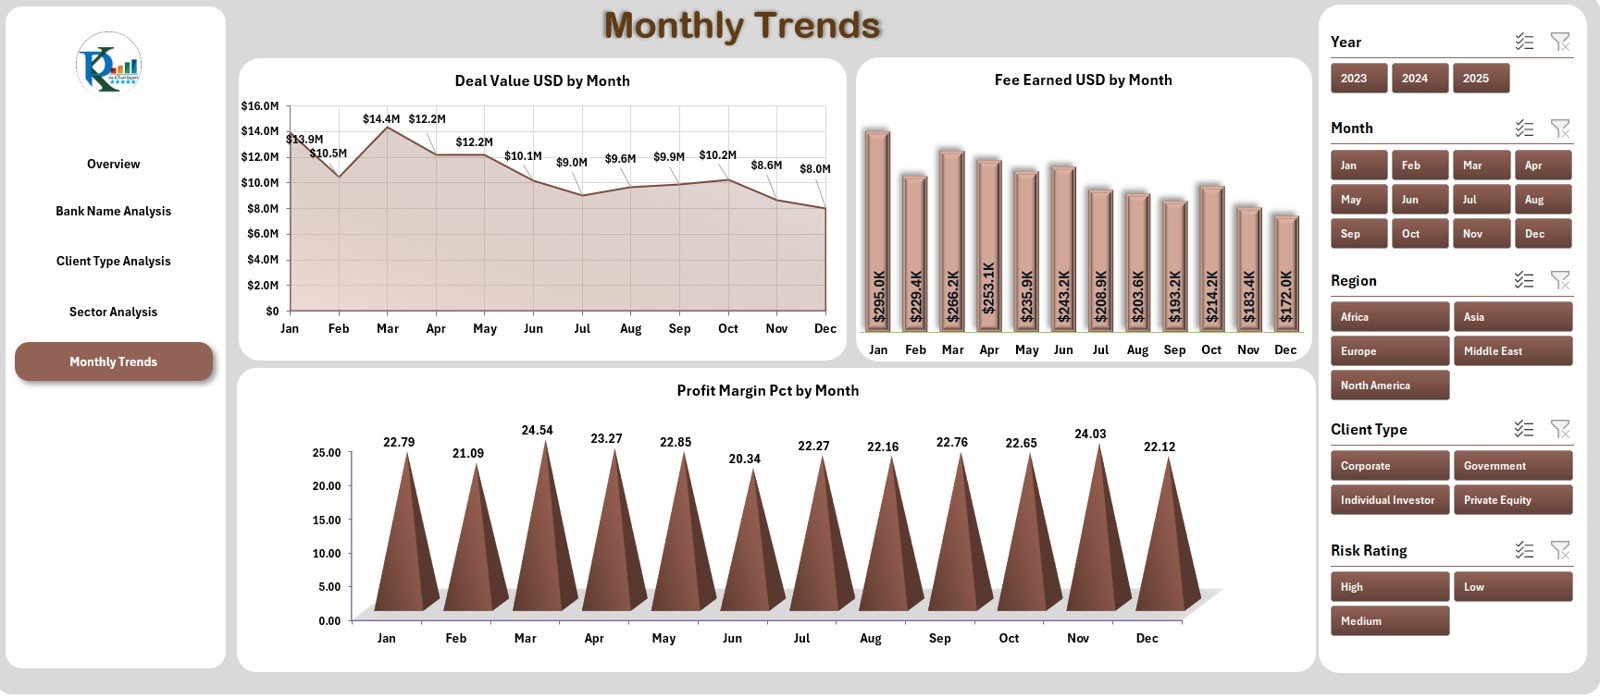
The Monthly Trends Page captures time-based patterns to understand how the bank’s performance evolves month by month.
Visuals Included:
-
Deal Value (USD) by Month — Tracks growth and seasonality of transactions.
-
Fee Earned (USD) by Month — Shows trends in revenue generation.
-
Profit Margin (%) by Month — Reflects efficiency and profitability over time.
By observing these metrics, analysts can identify peak periods, forecast future trends, and align strategic goals accordingly.
Support Sheet and Data Sheet
Behind every powerful dashboard lies strong data infrastructure.
-
The Support Sheet manages lists, lookup tables, and slicer connections to ensure dynamic filtering and seamless page navigation.
-
The Data Sheet stores raw data, which drives all metrics and visualizations across the dashboard.
This structure maintains flexibility, scalability, and real-time responsiveness without the need for complex external databases.
Advantages of the Investment Banking Dashboard in Excel
A professionally designed Excel dashboard offers numerous advantages for financial professionals. Let’s explore them in detail:
1. Easy to Use
No programming or BI tool expertise is required. With Excel’s familiar interface, users can explore insights effortlessly.
2. Centralized Data View
All essential metrics are presented in one file — reducing the need to switch between multiple reports or sheets.
3. Real-Time Performance Tracking
Through slicers and formulas, users can filter data instantly and visualize up-to-date results.
4. Customizable Design
Add or modify KPIs, update chart types, or integrate new datasets without complex configuration.
5. Cost-Effective Solution
Unlike expensive BI platforms, this Excel-based dashboard is budget-friendly yet powerful enough for professional use.
6. Enhanced Decision-Making
Visual insights help executives understand performance faster and act confidently on data.
7. Improved Collaboration
Teams can share the same file, review metrics together, and align strategies across departments.
Opportunities for Improvement
Even though the Investment Banking Dashboard in Excel is robust, continuous improvement enhances its value.
Here are a few ideas:
-
Add Automation: Use VBA macros to refresh data automatically.
-
Integrate APIs: Link to financial data APIs for real-time deal updates.
-
Include Forecasting Models: Add trendlines or predictive analytics using Excel’s built-in tools.
-
Enhance Visualization: Introduce conditional formatting and dynamic sparklines.
-
Expand KPI Library: Incorporate more detailed ratios like Return on Equity (ROE) or Cost-to-Income ratio.
These improvements can make the dashboard even more dynamic and insightful for decision-makers.
Click to Purchases Investment Banking Dashboard in Excel
Best Practices for Using the Investment Banking Dashboard in Excel
To maximize efficiency, follow these best practices while using or designing the dashboard:
-
Define Clear KPIs: Identify metrics that directly impact performance — such as deal closure rates, client satisfaction, and profit margins.
-
Maintain Data Accuracy: Regularly validate input data to avoid calculation errors.
-
Use Slicers Strategically: Limit the number of slicers for optimal speed and clarity.
-
Update Monthly: Refresh data and review trends consistently to stay updated.
-
Protect Formulas: Lock critical cells and use data validation to maintain integrity.
-
Visual Consistency: Use uniform colors, fonts, and chart styles across all pages.
-
Leverage Conditional Formatting: Highlight high or low performance visually for quick interpretation.
-
Document Everything: Maintain a “User Guide” sheet explaining data sources and navigation.
-
Backup Regularly: Keep copies of past versions to monitor progress over time.
-
Engage Stakeholders: Collect feedback from analysts and managers to refine dashboard usability.
How to Build an Investment Banking Dashboard in Excel
If you wish to create a similar dashboard from scratch, follow these steps:
-
Gather Data: Collect historical deal data, client records, and transaction details.
-
Prepare Data Tables: Structure data with consistent headers like Bank Name, Client Type, Sector, Deal Value, Fee, Profit Margin, etc.
-
Create KPIs: Define key performance indicators relevant to your operations.
-
Design Layout: Plan your sheet tabs — Overview, Bank Analysis, Client Analysis, Sector Analysis, and Monthly Trends.
-
Insert Charts: Use PivotCharts and PivotTables for dynamic visuals.
-
Add Slicers: Allow users to filter by Month, Region, Sector, or Bank Name.
-
Add Navigation Buttons: Use hyperlinks or shapes for easy movement between sheets.
-
Test and Refine: Validate accuracy and responsiveness of visuals.
-
Apply Formatting: Use color codes for performance categories (e.g., Green = Good, Red = Poor).
-
Protect and Share: Lock formulas and distribute the dashboard to users securely.
By following these steps, you can develop a professional, interactive dashboard tailored to your organization’s financial analytics.
Conclusion
The Investment Banking Dashboard in Excel revolutionizes how financial data is analyzed, visualized, and reported. It offers a structured, user-friendly, and cost-effective way to track deals, evaluate client performance, and monitor profitability — all in real time.
With five analytical pages covering Overview, Bank, Client, Sector, and Trends, this dashboard empowers investment professionals to make strategic, data-driven decisions. Whether you’re managing portfolios or preparing executive reports, this Excel dashboard ensures your financial insights remain accurate, timely, and actionable.
Click to Purchases Investment Banking Dashboard in Excel
Frequently Asked Questions (FAQs)
1. What is the purpose of the Investment Banking Dashboard in Excel?
It helps investment bankers and analysts track, visualize, and analyze key performance metrics such as deal values, profit margins, fees earned, and client satisfaction.
2. Is the dashboard suitable for beginners?
Yes, the dashboard uses Excel’s standard features like PivotTables and slicers, making it easy for anyone with basic Excel skills to use.
3. Can I customize the dashboard for my organization?
Absolutely. You can modify KPIs, adjust chart types, or integrate new datasets based on your firm’s analytical needs.
4. How often should I update the data?
It’s best to refresh your data monthly or after every reporting cycle to ensure real-time accuracy.
5. Can I use this dashboard for presentation purposes?
Yes. The dashboard’s visuals, charts, and navigation structure make it ideal for management meetings and investor presentations.
6. Does it require any paid Excel add-ins?
No. The dashboard is fully built with standard Excel functions and does not require additional plugins.
7. How does it help improve decision-making?
By presenting financial metrics visually, it allows decision-makers to identify trends, evaluate performance, and plan future strategies effectively.
8. Is this dashboard compatible with both Windows and Mac?
Yes. It works seamlessly on both platforms, though some advanced VBA features may vary.
Click to Purchases Investment Banking Dashboard in Excel
Visit our YouTube channel to learn step-by-step video tutorials