Managing investments without clarity always leads to missed opportunities and delayed decisions. Therefore, investors, analysts, portfolio managers, and finance teams now rely on structured dashboards instead of scattered spreadsheets. An Investment Management Dashboard in Excel helps you track performance, monitor risks, and analyze returns in one centralized view.
In this detailed guide, you will learn what an Investment Management Dashboard in Excel is, why it matters, how it works, and how you can use it effectively. Moreover, this article explains dashboard sheets, advantages, best practices, real-world use cases, and frequently asked questions so you can confidently manage investment portfolios using Excel.
Click to buy Investment Management Dashboard in Excel
What Is an Investment Management Dashboard in Excel?
An Investment Management Dashboard in Excel is a ready-to-use analytical tool designed to track, analyze, and visualize investment performance across portfolios, regions, asset types, and time periods.
Instead of manually reviewing raw data, this dashboard converts investment data into meaningful insights using charts, KPIs, and interactive views. As a result, you can instantly understand how your investments perform and where adjustments are required.
Moreover, Excel makes this dashboard flexible, cost-effective, and easy to customize for different investment strategies.
Why Do You Need an Investment Management Dashboard?
Investment decisions demand accuracy, speed, and visibility. However, managing investments manually often causes delays and errors. Therefore, an Investment Management Dashboard becomes essential.
Key reasons to use this dashboard include:
- You want a single source of truth for all investments
- You need real-time visibility into portfolio performance
- You want to track ROI, active, closed, and matured investments
- You want to compare invested amount vs current value
- You need region-wise and portfolio-wise insights
As a result, this dashboard supports smarter, faster, and data-driven decisions.
How Does an Investment Management Dashboard in Excel Work?
The dashboard works by capturing investment data in structured Excel tables. Then, formulas, pivot tables, and charts transform that data into visual insights.
Typical workflow:
- Enter or import investment data into Excel
- Organize data by portfolio, region, investment type, and date
- Use formulas to calculate ROI, active %, and totals
- Build pivot tables for analysis
- Visualize data using charts and KPI cards
Because Excel updates instantly, any data change reflects automatically across the dashboard.
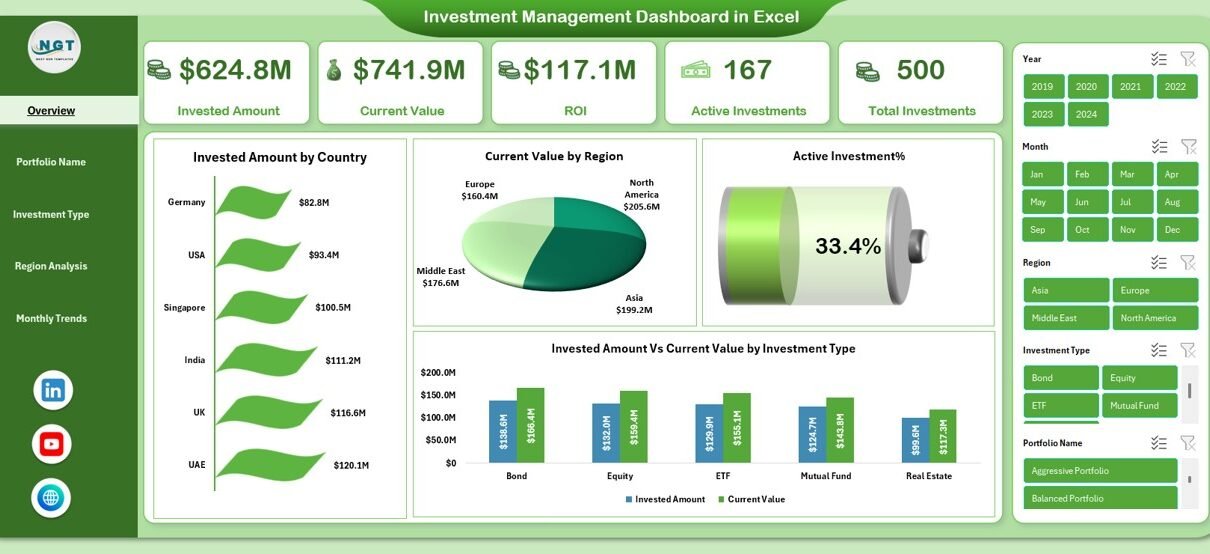
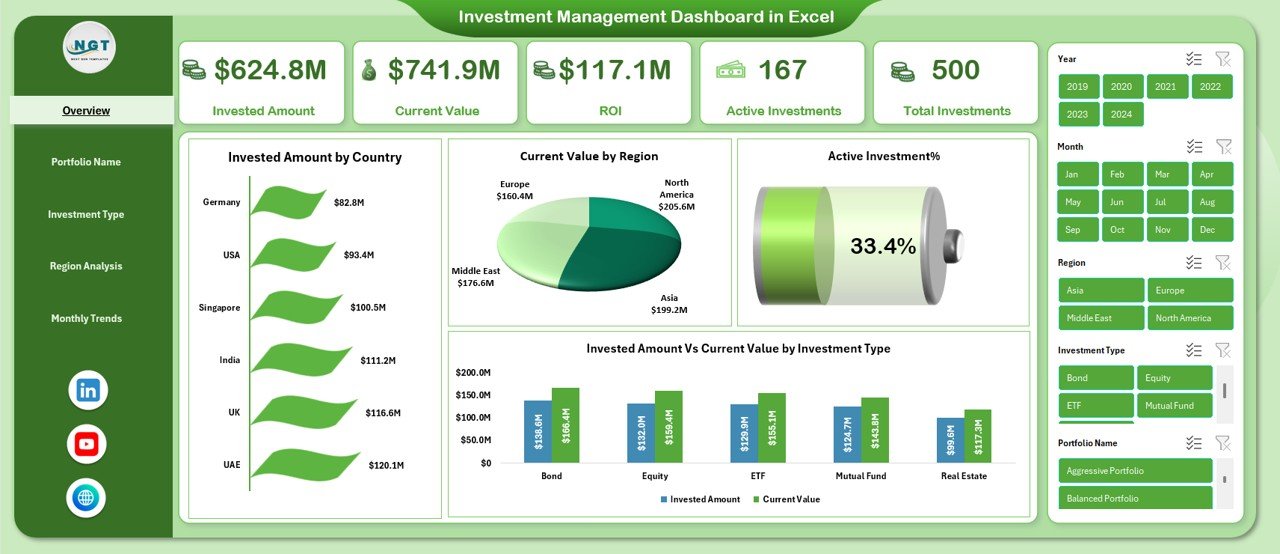
Overview Sheet Tab: Portfolio Snapshot at a Glance
The Overview Sheet serves as the main control panel of the Investment Management Dashboard in Excel. It gives you a complete snapshot of portfolio health within seconds.
Key KPIs on the Overview Sheet
- Invested Amount – Total capital invested
- Current Value – Current market value of investments
- ROI – Return on investment percentage
- Active Investments – Number of ongoing investments
- Total Investments – Overall investment count
These KPIs help you instantly evaluate portfolio performance.
Overview Visuals Explained
- Invested Amount by Country – Shows capital distribution across countries
- Current Value by Region – Highlights regional performance
- Active Investment % – Displays active investment ratio
- Invested Amount vs Current Value by Investment Type – Compares growth by asset class
Therefore, the Overview Sheet helps you spot trends, risks, and opportunities quickly.
Click to buy Investment Management Dashboard in Excel
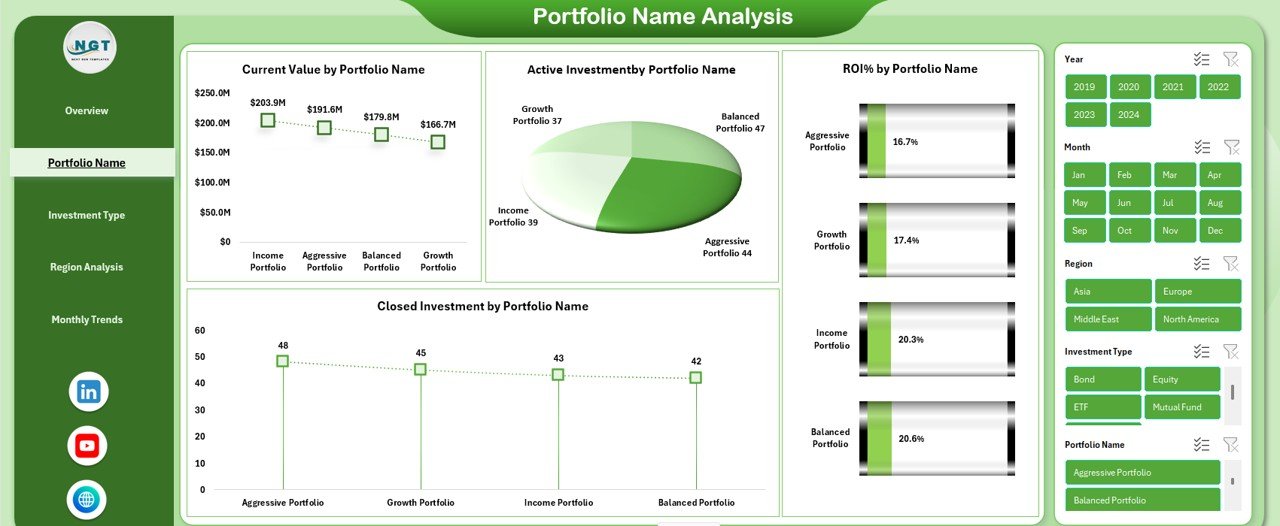
Portfolio Name Analysis: How Do Individual Portfolios Perform?
Portfolio-level analysis plays a critical role in investment management. Therefore, the Portfolio Name Analysis sheet focuses on individual portfolio performance.
Key Metrics in Portfolio Name Analysis
- Current Value by Portfolio Name – Measures portfolio worth
- Active Investment by Portfolio Name – Tracks ongoing investments
- Closed Investment by Portfolio Name – Shows exited investments
- ROI % by Portfolio Name – Evaluates profitability
As a result, you can compare portfolios, identify top performers, and reallocate funds intelligently.
Click to buy Investment Management Dashboard in Excel
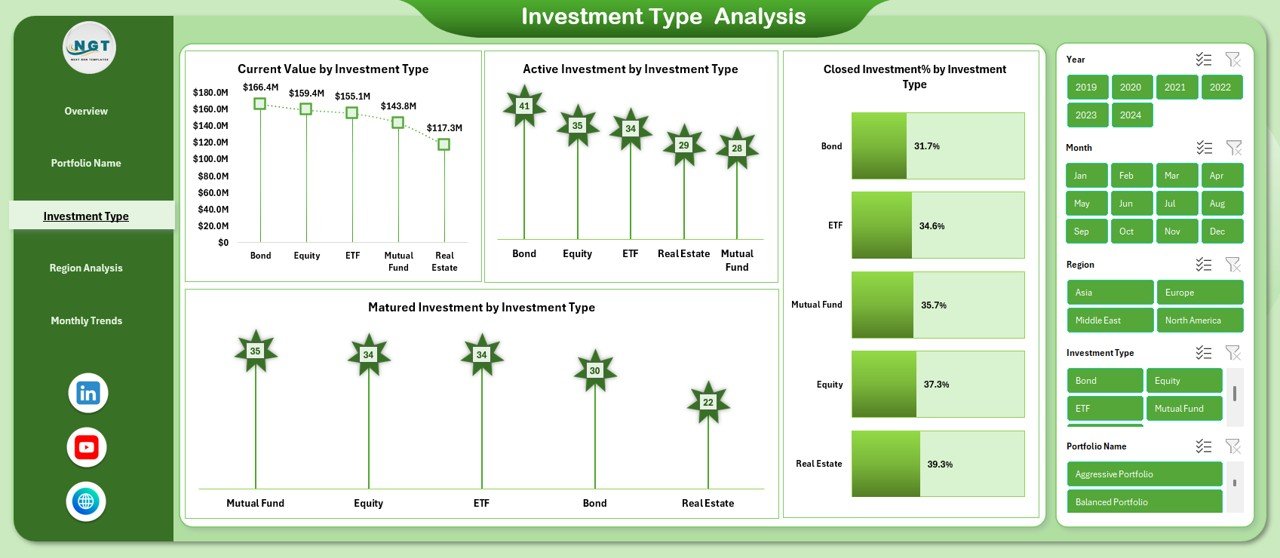
Investment Type Analysis: Which Assets Deliver Better Returns?
Diversification always matters in investment strategies. Therefore, the Investment Type Analysis sheet evaluates performance across asset classes.
Insights from Investment Type Analysis
- Current Value by Investment Type – Shows asset-wise valuation
- Active Investment by Investment Type – Tracks ongoing investments
- Matured Investment by Investment Type – Identifies matured assets
- Closed Investment % by Investment Type – Highlights exit patterns
This analysis helps you understand which investment types deliver stable returns and which require optimization.
Click to buy Investment Management Dashboard in Excel
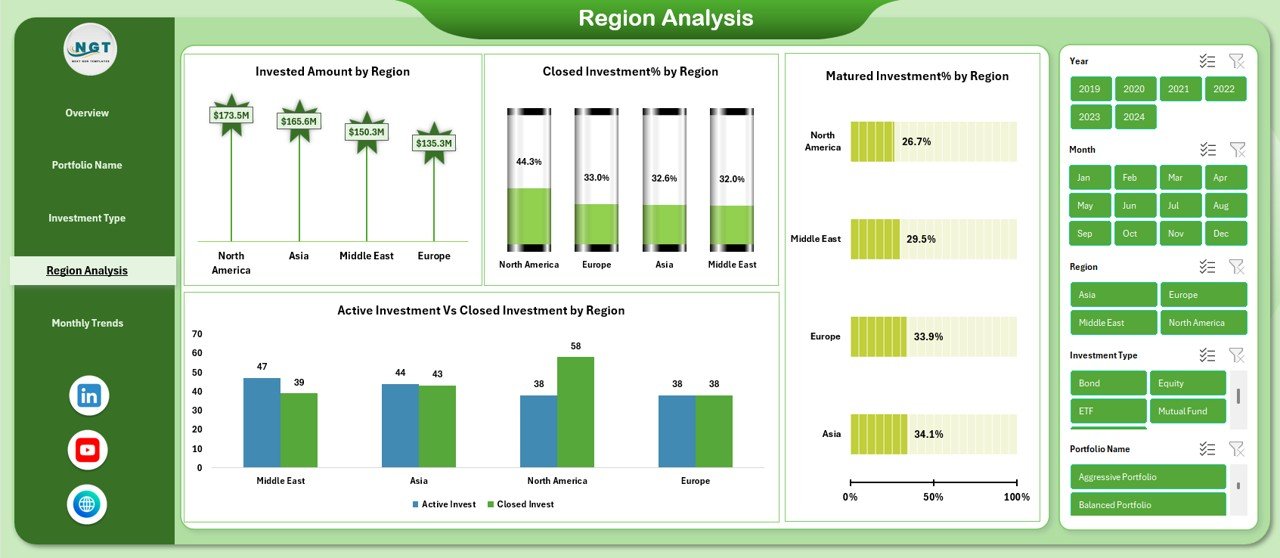
Region Analysis: How Do Regions Impact Portfolio Performance?
Geographical diversification reduces risk and increases stability. Therefore, the Region Analysis sheet focuses on regional investment performance.
Key Regional Metrics
- Invested Amount by Region – Capital allocation by geography
- Closed Investment % by Region – Exit trends across regions
- Active vs Closed Investment by Region – Investment status comparison
- Matured Investment % by Region – Maturity distribution
As a result, this sheet helps you balance regional exposure effectively.
Click to buy Investment Management Dashboard in Excel
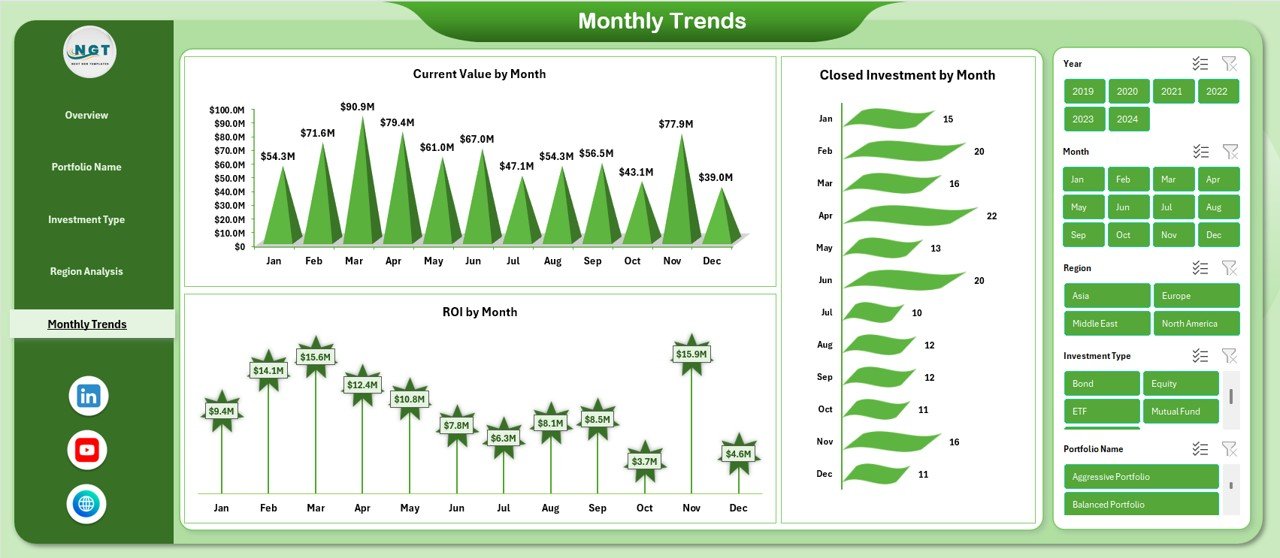
Monthly Trends: How Does Performance Change Over Time?
Trends reveal growth patterns and market behavior. Therefore, the Monthly Trends sheet analyzes performance over time.
Monthly Trend Metrics
- Current Value by Month – Tracks portfolio growth
- ROI by Month – Measures profitability trends
- Closed Investment by Month – Shows exit activity
Because trends matter, this sheet supports forecasting and strategic planning.
Click to buy Investment Management Dashboard in Excel
Advantages of Investment Management Dashboard in Excel
Using an Investment Management Dashboard in Excel delivers several benefits.
Major Advantages
- Centralized investment tracking in one file
- Clear visualization of complex data
- Real-time updates with automatic calculations
- Cost-effective solution without expensive tools
- Customizable structure for any investment strategy
- Improved decision-making through actionable insights
As a result, both individual investors and institutions benefit from better control and clarity.
Who Can Use an Investment Management Dashboard in Excel?
This dashboard supports a wide range of users.
Ideal Users Include:
- Individual investors
- Portfolio managers
- Wealth management firms
- Financial analysts
- Investment advisors
- Finance teams and CFOs
Because Excel remains widely used, adoption becomes easy and fast.
Best Practices for the Investment Management Dashboard in Excel
To maximize value, you should follow proven best practices.
- Keep Data Clean and Structured
Always maintain consistent formats for dates, currency, and percentages.
- Update Data Regularly
Frequent updates ensure accurate insights and timely decisions.
- Use Clear Naming Conventions
Use clear portfolio, region, and investment type names.
- Focus on Key KPIs
Avoid clutter and track only meaningful metrics.
- Validate ROI Calculations
Double-check formulas to avoid misleading conclusions.
- Use Filters and Slicers
Interactive controls improve usability and analysis speed.
How Does This Dashboard Support Better Decision-Making?
An Investment Management Dashboard in Excel transforms raw data into insights. Therefore, decision-makers can:
- Identify underperforming investments
- Optimize asset allocation
- Reduce risk through diversification
- Improve ROI through timely exits
- Monitor portfolio health continuously
As a result, investment strategies become proactive rather than reactive.
Common Challenges and How to Overcome Them
Challenge: Data Overload
Solution: Focus on essential KPIs and summary views.
Challenge: Manual Errors
Solution: Use structured tables and protected formulas.
Challenge: Lack of Visibility
Solution: Use charts and KPI cards for clarity.
By addressing these challenges, the dashboard becomes more reliable and powerful.
Conclusion: Why Investment Management Dashboard in Excel Is a Must-Have Tool
An Investment Management Dashboard in Excel empowers investors with clarity, control, and confidence. It simplifies portfolio tracking, enhances analysis, and supports informed decisions.
Moreover, this ready-to-use dashboard eliminates guesswork and transforms Excel into a powerful investment management system. Therefore, whether you manage personal investments or institutional portfolios, this dashboard adds measurable value.
Frequently Asked Questions About Investment Management Dashboard in Excel
What is the main purpose of an Investment Management Dashboard in Excel?
The main purpose is to track, analyze, and visualize investment performance in one centralized Excel file.
Can beginners use this dashboard easily?
Yes, the dashboard uses simple layouts, clear visuals, and easy-to-understand metrics.
Does this dashboard support multiple portfolios?
Yes, it supports portfolio-wise, region-wise, and investment-type-wise analysis.
Can I customize the dashboard?
Yes, Excel allows full customization of KPIs, charts, and layouts.
Is Excel suitable for long-term investment tracking?
Yes, Excel works well for long-term tracking when data stays organized and updated.
Does this dashboard help improve ROI?
Yes, it highlights performance gaps and opportunities, helping you improve ROI over time.
Visit our YouTube channel to learn step-by-step video tutorials
Watch the step-by-step video tutorial:
Click to buy Investment Management Dashboard in Excel