Investor relations play a critical role in building trust, transparency, and long-term value between organizations and their investors. However, managing investor data using scattered spreadsheets, static reports, and manual presentations often creates confusion and delays. As a result, leadership teams struggle to communicate performance clearly and respond quickly to investor expectations.
That is exactly why an Investor Relations Dashboard in Power BI has become an essential analytics solution for modern businesses, startups, private equity firms, and venture capital organizations.
In this in-depth and SEO-friendly guide, you will learn what an Investor Relations Dashboard in Power BI is, how it works, its page-wise structure, advantages, best practices, and frequently asked questions. Moreover, this article uses simple language, real-world logic, and practical explanations so you can apply everything immediately.
Click to Purchases Investor Relations Dashboard in Power BI
What Is an Investor Relations Dashboard in Power BI?
An Investor Relations Dashboard in Power BI is a centralized, interactive reporting solution that visualizes investor-related data in a clear and structured format. Instead of relying on multiple spreadsheets or manual reports, organizations use this dashboard to monitor investments, investor performance, funding rounds, expected returns, and monthly trends in one place.
Because Power BI connects directly to structured data sources, the dashboard updates automatically. As a result, investor relations teams gain real-time insights without manual effort.
More importantly, this dashboard helps decision-makers explain complex financial information in a visual and easy-to-understand manner. Therefore, both internal stakeholders and external investors stay aligned.
Why Do Organizations Need an Investor Relations Dashboard?
Investor communication demands accuracy, clarity, and speed. However, traditional reporting methods often slow down the process.
Here is why organizations increasingly adopt an Investor Relations Dashboard in Power BI:
-
Investor data usually sits in multiple systems
-
Manual reporting increases errors and inconsistencies
-
Static charts fail to explain performance trends
-
Leadership needs real-time visibility during meetings
-
Investors expect transparency and professionalism
Because of these challenges, a Power BI dashboard becomes a strategic advantage rather than just a reporting tool.
How Does an Investor Relations Dashboard in Power BI Work?
The dashboard works by connecting structured investor data—typically stored in Excel, databases, or cloud systems—to Power BI. Once connected, Power BI transforms raw data into visual insights using charts, cards, and filters.
Here is how the process flows:
-
Collect investor, company, funding, and return data
-
Clean and structure the data in a consistent format
-
Load the data into Power BI
-
Build interactive visuals and slicers
-
Publish and refresh the dashboard regularly
Because Power BI supports dynamic filtering, users can analyze data by company, investor type, funding round, or month instantly.
What Is the Page-Wise Structure of the Investor Relations Dashboard in Power BI?
This Investor Relations Dashboard contains five powerful analytical pages, each designed to answer specific business questions. Let us explore each page in detail.
Overview Page: How Can You Get a Snapshot of Investor Performance?
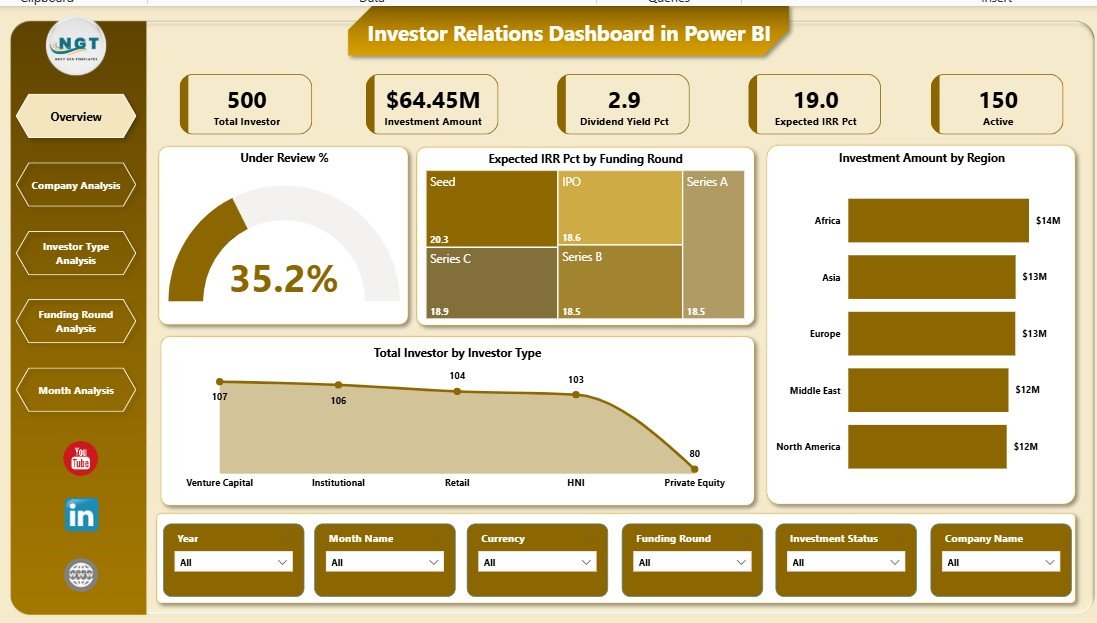
The Overview Page serves as the entry point of the dashboard. It provides a high-level summary of overall investor activity and performance.
Key Features of the Overview Page
-
Interactive slicers for quick filtering
-
Four key performance cards
-
Regional and category-based insights
Visuals on the Overview Page
-
Under Review %
This card shows the percentage of investments currently under review. As a result, teams quickly understand the pipeline status. -
Expected IRR % by Funding Round
This chart highlights expected returns across funding rounds. Therefore, leadership can identify high-return stages instantly. -
Investment Amount by Region
This visual displays where investments concentrate geographically. Consequently, teams spot regional exposure and opportunities. -
Total Investment by Investor Type
This chart compares investment amounts across investor categories, such as institutional, angel, or venture capital investors.
Because this page summarizes critical metrics, it becomes ideal for leadership reviews and investor presentations.
Company Analysis Page: How Do Individual Companies Perform?
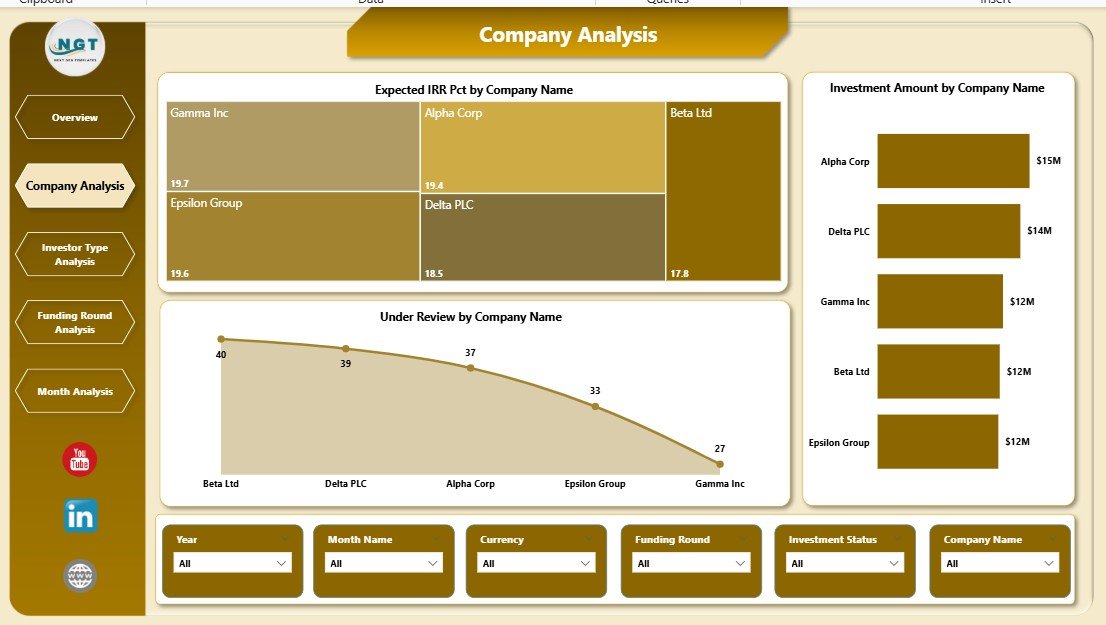
The Company Analysis Page focuses on performance at the company level. This page helps users evaluate where capital flows and how each company performs.
Key Visuals on the Company Analysis Page
-
Expected IRR % by Company Name
This chart shows projected returns for each company, enabling quick comparison. -
Investment Amount by Company Name
This visual highlights capital allocation across portfolio companies. -
Under Review by Company Name
This chart identifies companies with investments still under evaluation.
Because this page offers deep company-level insights, it supports due diligence, portfolio reviews, and strategic decision-making.
Click to Purchases Investor Relations Dashboard in Power BI
Investor Type Analysis Page: Which Investor Categories Drive Growth?
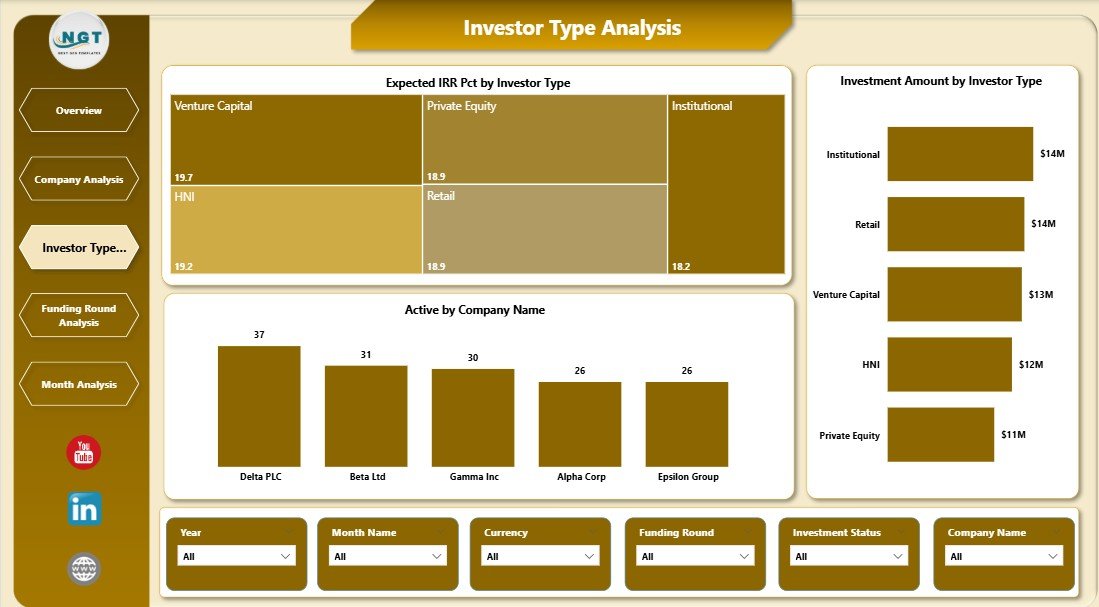
The Investor Type Analysis Page breaks down performance by investor category. This view helps organizations understand who drives funding and returns.
Key Visuals on the Investor Type Analysis Page
-
Expected IRR % by Investor Type
This chart compares return expectations across investor segments. -
Investment Amount by Investor Type
This visual reveals which investor categories contribute the most capital. -
Active by Investor Type
This metric shows active participation across investor groups.
As a result, investor relations teams can tailor communication strategies based on investor behavior.
Funding Round Analysis Page: How Do Funding Stages Impact Performance?
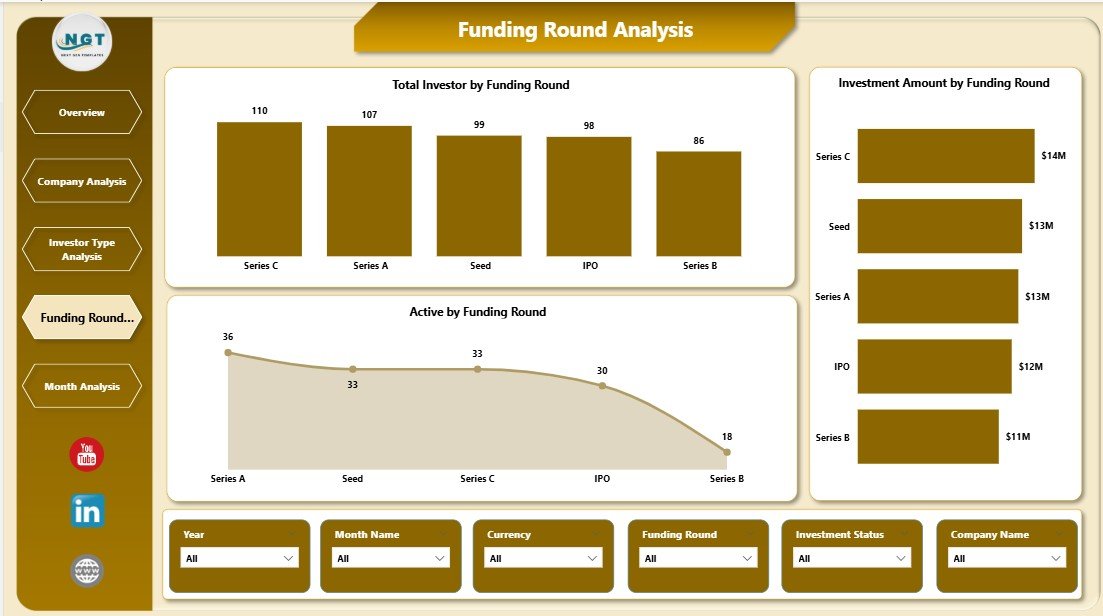
The Funding Round Analysis Page focuses on performance across funding stages such as Seed, Series A, Series B, and beyond.
Key Visuals on the Funding Round Analysis Page
-
Total Investors by Funding Round
This chart displays investor participation across funding stages. -
Investor Amount by Funding Round
This visual shows capital distribution by funding stage. -
Active by Funding Round
This metric highlights engagement levels during each round.
Because funding stage analysis plays a crucial role in capital planning, this page supports future fundraising strategies.
Monthly Trends Page: How Do Investor Metrics Change Over Time?
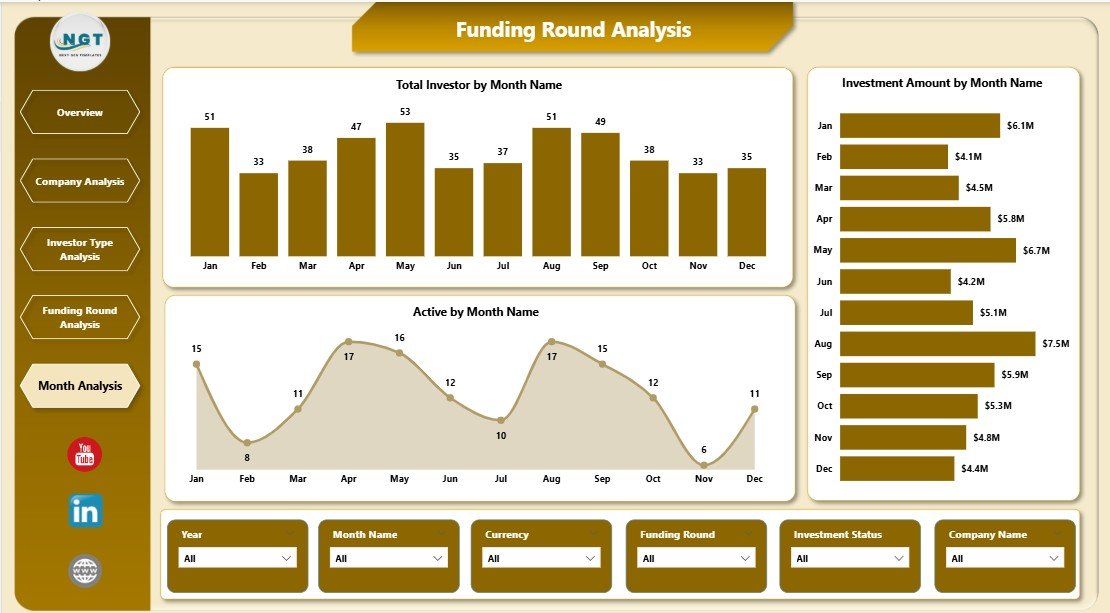
The Monthly Trends Page tracks changes over time, which helps identify growth patterns and seasonality.
Key Visuals on the Monthly Trends Page
-
Total Investors by Month
-
Investor Amount by Month
-
Active by Month
Because time-based trends reveal momentum, this page becomes invaluable for forecasting and performance reviews.
Advantages of an Investor Relations Dashboard in Power BI
An Investor Relations Dashboard delivers measurable business value. Below are the key advantages.
1. Centralized Investor Data
Instead of juggling multiple files, teams access all investor data in one dashboard. Consequently, reporting becomes faster and more reliable.
2. Real-Time Insights
Because Power BI refreshes data automatically, users always see the latest information. Therefore, decision-makers act with confidence.
3. Improved Transparency
Clear visuals improve trust and credibility with investors. As a result, communication becomes more professional.
4. Faster Decision-Making
Interactive slicers allow instant analysis. Hence, leadership answers questions during meetings without delays.
5. Scalable Reporting
As investor data grows, the dashboard scales effortlessly. Thus, organizations future-proof their reporting process.
Who Can Benefit from an Investor Relations Dashboard?
Click to Purchases Investor Relations Dashboard in Power BI
This dashboard serves a wide range of professionals:
-
Investor Relations Managers
-
CFOs and Finance Leaders
-
Founders and Startup Executives
-
Private Equity Firms
-
Venture Capital Firms
-
Strategy and Portfolio Teams
Because the dashboard adapts to different needs, it delivers value across organizational levels.
Best Practices for the Investor Relations Dashboard in Power BI
To maximize dashboard impact, follow these best practices.
1. Keep Data Clean and Consistent
Always standardize company names, investor types, and funding rounds. Clean data improves accuracy and trust.
2. Use Clear KPI Definitions
Define each metric clearly so users understand what they see. Clarity prevents misinterpretation.
3. Limit Visual Clutter
Focus on essential visuals only. Simplicity improves usability and engagement.
4. Use Meaningful Slicers
Include slicers for investor type, funding round, company, and time. Flexible filtering enhances analysis.
5. Refresh Data Regularly
Schedule automatic refreshes to keep insights current. Updated data builds credibility.
Opportunities for Improvement in Investor Relations Dashboards
Even a strong dashboard can improve over time.
-
Add benchmark comparisons for expected IRR
-
Include drill-through pages for deeper analysis
-
Integrate ESG or risk metrics
-
Add commentary or notes for context
-
Enable mobile-friendly layouts
Because Power BI evolves continuously, dashboards can grow with business needs.
How Does This Dashboard Support Investor Communication?
Clear visuals simplify storytelling. Instead of overwhelming investors with spreadsheets, teams present insights visually. Consequently, discussions become more focused and productive.
Moreover, the dashboard helps align internal teams before investor meetings. Therefore, everyone communicates the same message.
Conclusion: Why Should You Use an Investor Relations Dashboard in Power BI?
An Investor Relations Dashboard in Power BI transforms raw investor data into meaningful insights. It improves transparency, speeds up decision-making, and strengthens investor confidence.
Because the dashboard combines clarity, interactivity, and scalability, it becomes an essential tool for organizations that take investor communication seriously.
If you want better control over investor data, clearer reporting, and smarter decisions, this dashboard delivers exactly that.
Frequently Asked Questions (FAQs)
What is the main purpose of an Investor Relations Dashboard in Power BI?
The main purpose is to centralize investor data and visualize performance metrics clearly for better communication and decision-making.
Can this dashboard handle large investor datasets?
Yes, Power BI efficiently handles large datasets and scales as data grows.
Do I need technical skills to use the dashboard?
No. End users interact with filters and visuals without technical knowledge.
Can I customize the dashboard for my organization?
Yes. You can modify visuals, KPIs, slicers, and layouts based on business needs.
How often should I refresh the dashboard data?
You should refresh data daily or weekly, depending on how frequently investor data changes.
Visit our YouTube channel to learn step-by-step video tutorials