In modern agriculture and water resource management, data-driven decision-making is essential. Farmers, irrigation authorities, and sustainability teams need to monitor efficiency, water usage, and performance to ensure sustainable results. The Irrigation Systems KPI Dashboard in Excel is a powerful, ready-to-use template that helps achieve these goals through automation, visualization, and analysis.
This dashboard converts raw irrigation data into clear, actionable insights—allowing users to evaluate system efficiency, detect issues, and plan better for the future. Let’s explore everything about this Excel-based KPI dashboard—its features, structure, benefits, and best practices.
Click to Purchases Irrigation Systems KPI Dashboard in Excel
🌿 What Is an Irrigation Systems KPI Dashboard in Excel?
An Irrigation Systems KPI Dashboard is a comprehensive Excel-based tool designed to monitor and evaluate the performance of irrigation networks. It brings together key performance indicators (KPIs) such as water usage, system efficiency, maintenance cost, and coverage ratio—all in one visual workspace.
By integrating monthly and yearly data, it enables managers and farmers to compare actual performance with targets and identify opportunities for improvement. This dashboard eliminates the need for complex software or manual calculations—making irrigation performance tracking easy and intuitive.
With this dashboard, you can:
-
Monitor Month-to-Date (MTD) and Year-to-Date (YTD) irrigation KPIs.
-
Compare Actual vs Target vs Previous Year (PY) data.
-
Use color-coded indicators and trend charts to evaluate progress.
-
Record and analyze historical performance across multiple years.
-
Make better, faster, and data-driven irrigation decisions.
📊 Structure of the Irrigation Systems KPI Dashboard
The Irrigation Systems KPI Dashboard in Excel includes seven key worksheets, each with a specific function. Together, they create a full-fledged irrigation performance tracking system.
1️⃣ Home Sheet (Navigation Page)
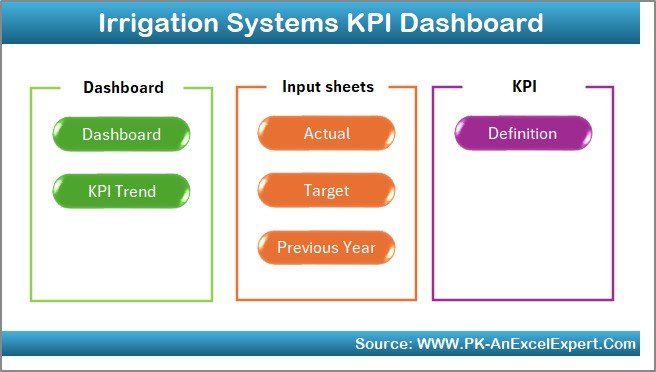
The Home Sheet serves as the index page of the workbook. It includes six navigation buttons that allow users to jump directly to respective sheets such as Dashboard, KPI Trend, or Data Input pages.
This sheet helps simplify navigation—ideal for users managing multiple irrigation datasets.
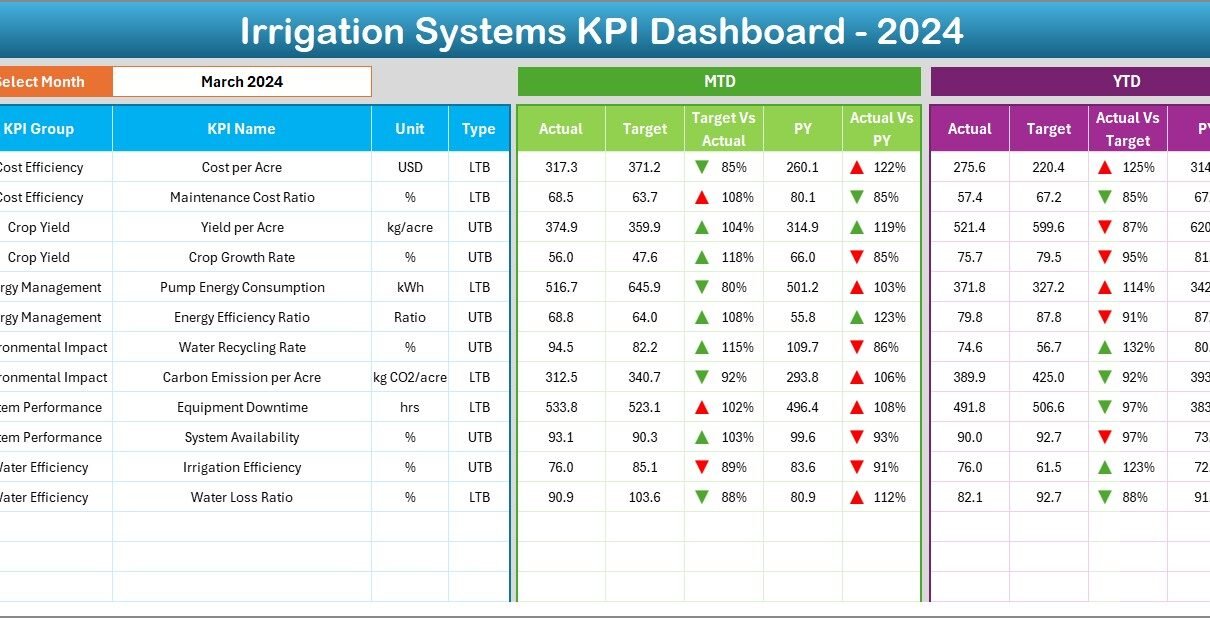
2️⃣ Dashboard Sheet (Main Dashboard)
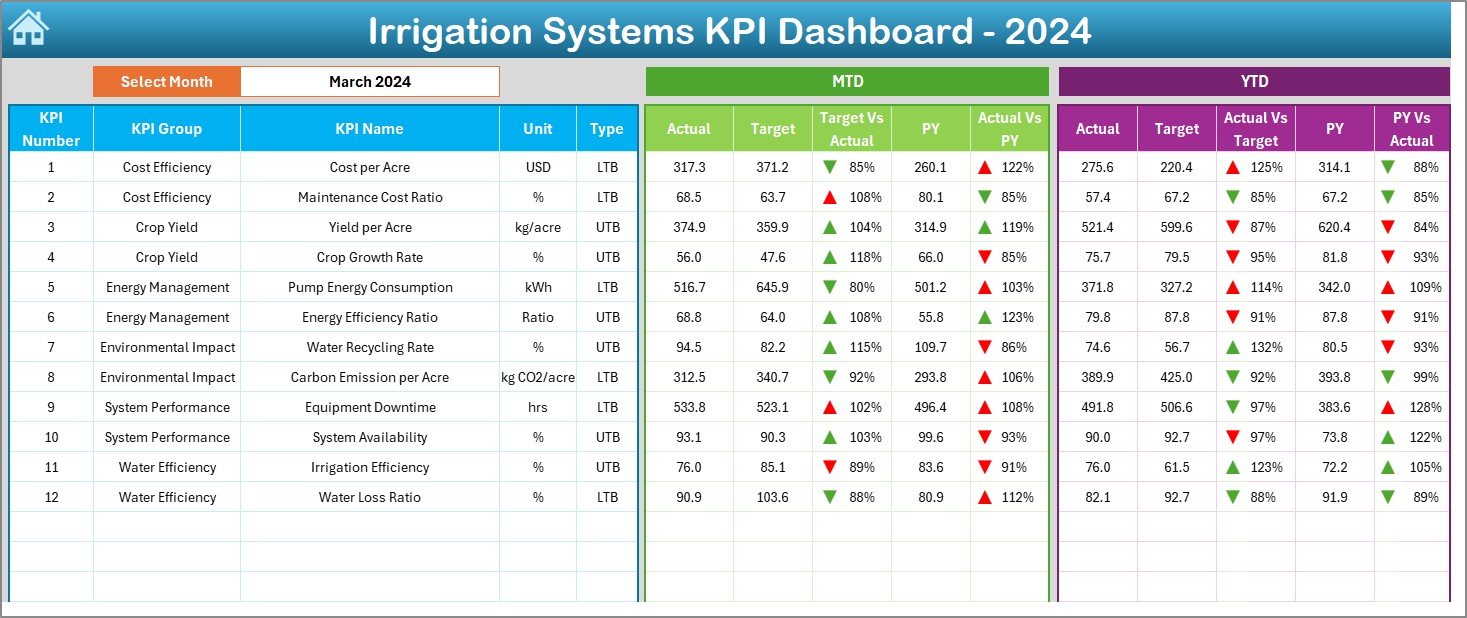
This is the core sheet of the template and displays all KPI-related information.
🔑 Key Features:
-
Month Selector (Range D3): Choose a specific month to update the dashboard instantly.
-
MTD Section: Displays actual, target, and previous year data for each KPI with conditional formatting.
-
YTD Section: Shows year-to-date actuals, targets, and comparisons with PY (Previous Year).
-
Performance Indicators: Uses arrows (▲ and ▼) with color formatting to visualize whether KPIs are improving or declining.
-
Comprehensive KPI Table: Includes metrics such as water efficiency, pump uptime, system pressure, and operational cost.
This interactive sheet provides a snapshot of irrigation performance at a glance.
3️⃣ KPI Trend Sheet Tab
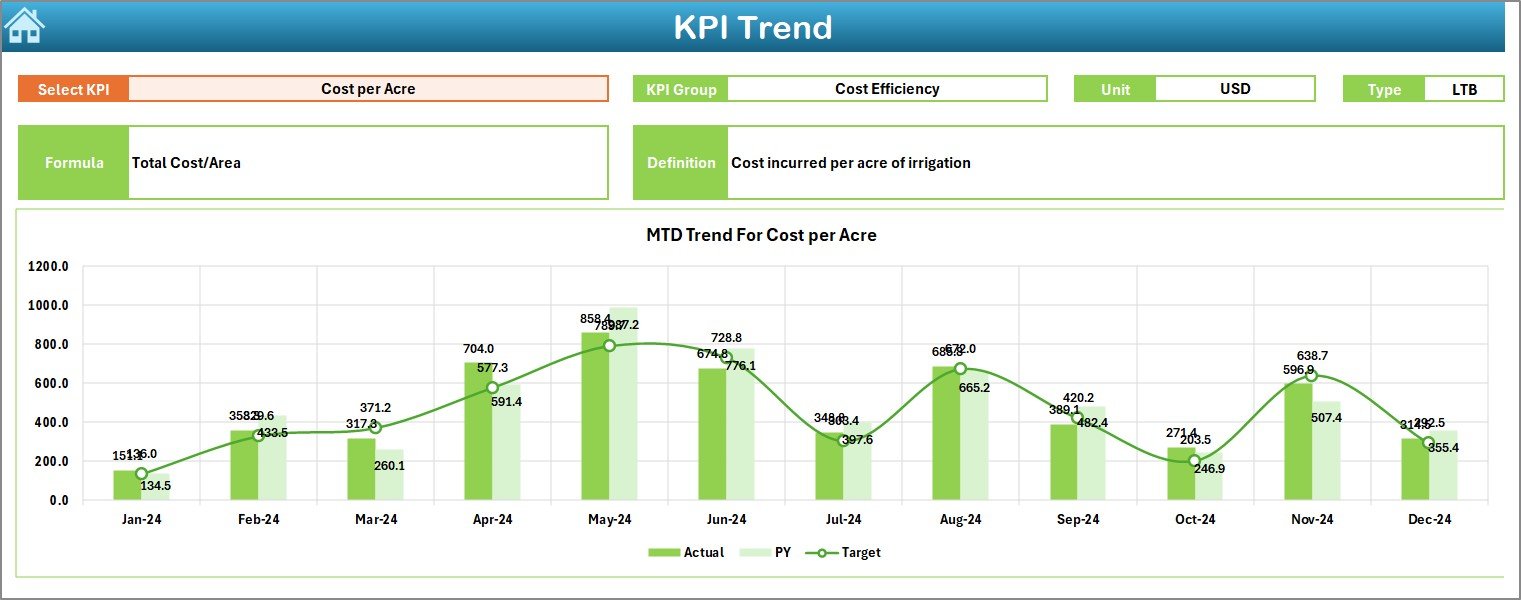
The KPI Trend Sheet is dedicated to in-depth performance analysis of each KPI.
📈 Key Features:
-
KPI Selection (Range C3): Choose any KPI to display its trend over time.
-
KPI Details: Displays KPI Group, Unit, Type (LTB or UTB), Formula, and Definition.
-
Trend Charts: Show MTD and YTD performance for Actual, Target, and PY numbers.
-
Visual Trend Analysis: Helps identify months with unusual changes or performance dips.
This sheet is ideal for irrigation analysts who want to study performance variations over months or seasons.
Click to Purchases Irrigation Systems KPI Dashboard in Excel
4️⃣ Actual Numbers Input Sheet

This sheet allows you to enter actual performance data for each month.
🧾 Highlights:
-
MTD and YTD Data: Input both month-to-date and cumulative year-to-date values.
-
Dynamic Month Selection (Range E1): Change the first month of the year to automatically update the timeline.
-
Data Validation: Ensures consistent and accurate data entry across KPIs.
This sheet forms the foundation for dashboard calculations.
5️⃣ Target Sheet Tab

Set your performance goals in the Target Sheet.
🎯 Features:
-
Enter monthly and yearly targets for every KPI.
-
Maintain MTD and YTD target figures for accurate performance evaluation.
-
Align targets with seasonal goals (e.g., pre-monsoon, irrigation phase, or harvest phase).
6️⃣ Previous Year Number Sheet

Track historical performance for better benchmarking.
🕒 Details:
-
Input last year’s MTD and YTD numbers for every KPI.
-
Use this data to calculate PY vs Actual comparisons automatically.
-
Identify year-over-year improvements or declines.
7️⃣ KPI Definition Sheet

This is the reference guide of your dashboard.
📘 Contents:
-
KPI Name – e.g., Water Usage Efficiency, Energy Consumption.
-
KPI Group – e.g., Water Management, Maintenance, Cost.
-
Unit – %, Liters, Hours, or Dollars.
-
Formula – Used for automatic calculations.
-
Definition – Short description for clarity.
-
Type (LTB/UTB) – Indicates if a lower or higher value is desirable.
This tab ensures everyone in the team interprets KPIs the same way.
⚙️ How the Dashboard Works
The Irrigation Systems KPI Dashboard automates data calculations using formulas and conditional formatting.
-
Data Entry: Input Actual, Target, and Previous Year data in respective sheets.
-
Calculation: Excel formulas automatically compute percentage differences.
-
Visualization: The Dashboard sheet updates with MTD, YTD, and PY performance.
-
Trend Analysis: View charts in the KPI Trend sheet to understand historical performance.
-
Definition Reference: Cross-check formulas and KPI meaning in the KPI Definition sheet.
The system ensures transparency, accuracy, and efficiency—without requiring macros or external tools.
Click to Purchases Irrigation Systems KPI Dashboard in Excel
🌞 Advantages of the Irrigation Systems KPI Dashboard in Excel
Implementing this dashboard provides multiple benefits for irrigation and water management operations.
1️⃣ Centralized Monitoring
Manage all irrigation KPIs in one place for quick decision-making.
2️⃣ Real-Time Analysis
Change the month selector to instantly view up-to-date performance.
3️⃣ Improved Efficiency
Identify resource wastage, low-performance pumps, or excessive costs early.
4️⃣ Data Transparency
All formulas and logic are visible, ensuring full accountability.
5️⃣ Historical Comparison
Track improvement trends year-over-year for better long-term planning.
6️⃣ Cost Optimization
Control maintenance and energy costs by continuously monitoring performance.
7️⃣ Easy to Customize
Add, remove, or modify KPIs without complex reconfiguration.
🚀 Opportunities for Improvement
While Excel offers a solid foundation, you can enhance your irrigation KPI tracking by:
-
Integrating IoT sensors: Automate data collection from pumps and flow meters.
-
Using Power BI for visualization: Create interactive online dashboards.
-
Adding Weather Data: Include rainfall and temperature to understand water needs.
-
Implementing Forecasting Models: Predict water demand or maintenance needs.
-
Automating Reports: Generate monthly summary reports using VBA or Power Query.
💡 Best Practices for Using the Dashboard
To make the most of this tool, follow these best practices:
-
Update Data Monthly: Regular updates keep analysis accurate.
-
Maintain Data Integrity: Validate values before inputting.
-
Set Clear Targets: Define achievable MTD and YTD goals for every KPI.
-
Analyze Trends: Review charts monthly to identify early warning signs.
-
Document Formulas: Maintain clarity on how KPIs are calculated.
-
Train Users: Ensure your team understands the dashboard layout.
-
Backup Regularly: Keep older versions for audit or reporting purposes.
-
Use Conditional Formatting Wisely: Highlight only critical deviations.
🧠 Example Use Case: Water Efficiency Tracking
Let’s consider a practical example:
An agricultural department manages irrigation for 2,000 acres. Using this dashboard, they can:
-
Track total water usage each month.
-
Monitor pump uptime and downtime trends.
-
Identify farms with higher leakage rates.
-
Compare actual costs vs target costs.
-
Evaluate performance improvements compared to last year.
This approach helps decision-makers enhance water conservation and operational efficiency.
Click to Purchases Irrigation Systems KPI Dashboard in Excel
🌍 Who Can Use This Dashboard?
The Irrigation Systems KPI Dashboard in Excel is ideal for:
-
Agricultural organizations
-
Government water departments
-
Irrigation consultants
-
Farm managers
-
Water utility companies
-
NGOs working in water sustainability
Its flexible design ensures usability across diverse irrigation projects.
🏁 Conclusion
The Irrigation Systems KPI Dashboard in Excel is a complete, data-driven solution for tracking water management performance. It empowers users to monitor critical metrics like efficiency, cost, and system reliability—all within an easy-to-use Excel interface.
By combining automation, visualization, and trend analysis, this dashboard helps organizations make informed, sustainable, and cost-effective irrigation decisions. It’s a must-have tool for anyone seeking to optimize water usage and ensure long-term agricultural productivity.
Click to Purchases Irrigation Systems KPI Dashboard in Excel
❓ Frequently Asked Questions (FAQs)
1️⃣ What is the main purpose of the Irrigation Systems KPI Dashboard?
It helps track, analyze, and improve irrigation performance using measurable KPIs in Excel.
2️⃣ Can I customize the KPIs in this dashboard?
Yes, all KPIs, formulas, and visuals are fully editable.
3️⃣ How do I update data in the dashboard?
Simply enter monthly actuals, targets, and previous year data in their respective sheets.
4️⃣ Does this dashboard work for both drip and canal irrigation systems?
Yes, it can be adapted for any irrigation type by updating relevant KPIs.
5️⃣ Can I use it to generate reports?
Yes, you can print or export performance summaries directly from Excel.
6️⃣ Does it support MTD and YTD analysis?
Absolutely — the dashboard is built with both MTD and YTD comparison logic.
7️⃣ Is any coding required?
No, the dashboard runs entirely on Excel formulas and conditional formatting.
8️⃣ Who benefits most from this dashboard?
Farmers, irrigation managers, and policymakers who rely on water performance metrics.
Click to Purchases Irrigation Systems KPI Dashboard in Excel
Visit our YouTube channel to learn step-by-step video tutorials