In today’s fast-paced digital world, technology teams need more than just intuition to measure success. That’s where a well-structured KPI Dashboard becomes essential. Whether you’re managing an IT department, leading a tech startup, or running internal systems for a large enterprise, keeping track of your growth metrics through a dashboard can make or break your performance.
In this article, we’ll walk you through a powerful tool — the IT and Tech Growth Metrics KPI Dashboard in Excel. This dashboard is ready-to-use, fully customizable, and designed to track month-to-date (MTD) and year-to-date (YTD) performance metrics with ease. Let’s dive into how this dashboard works, why you need it, and how you can make the most of it.
Click to Purchases IT and Tech Growth Metrics KPI Dashboard in Excel
What Is an IT and Tech Growth Metrics KPI Dashboard?
A KPI (Key Performance Indicator) Dashboard is a visual interface that displays critical business metrics. In the IT and tech space, these KPIs reflect how effectively your technology function supports overall business goals.
The IT and Tech Growth Metrics KPI Dashboard in Excel does exactly that — it tracks performance, highlights areas of concern, and showcases achievements in a clear and simple way. The dashboard uses Excel’s powerful features like drop-down selections, charts, conditional formatting, and automated calculations.
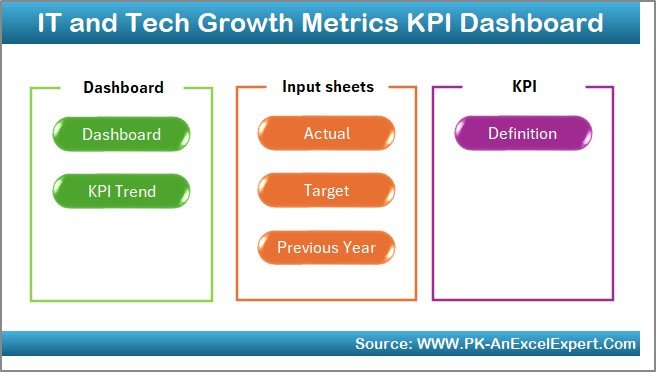
What’s Inside the Dashboard?
This template comes with seven pre-designed worksheets that work seamlessly together. Here’s a breakdown of each one:
Home Sheet
-
Serves as a central navigation hub.
-
Contains six clickable buttons that take you directly to the relevant sheets.
-
Helps users access the entire dashboard in a structured and intuitive manner.
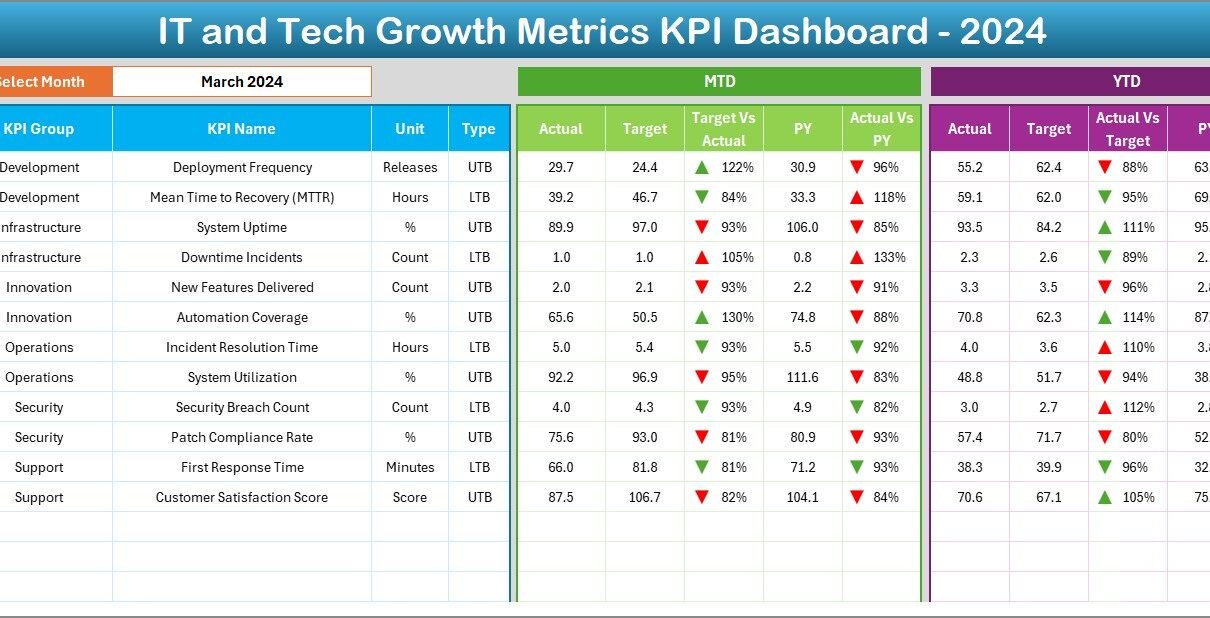
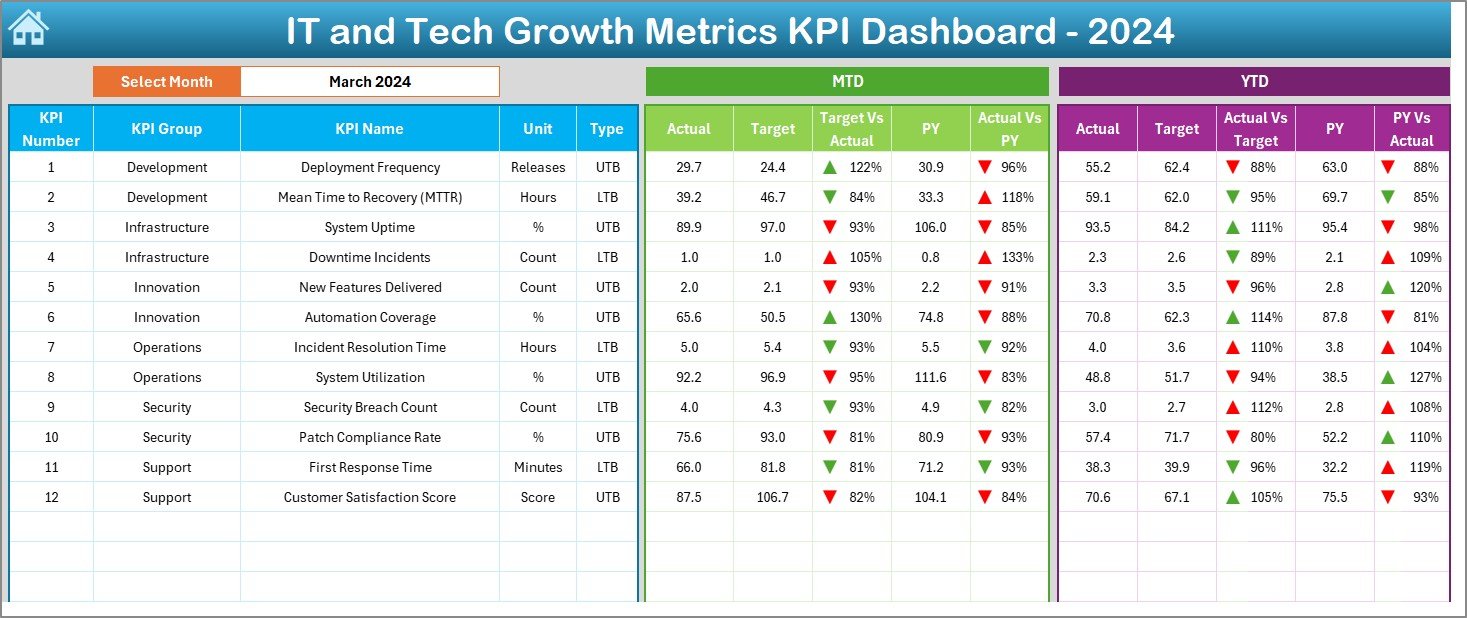
Dashboard Sheet Tab
-
This is the main visualization sheet.
-
Allows you to select a month from a drop-down (Range D3).
Displays the following metrics:
- MTD Actual, Target, and Previous Year values.
- YTD Actual, Target, and Previous Year values.
- Conditional formatting with up/down arrows indicates performance trends.
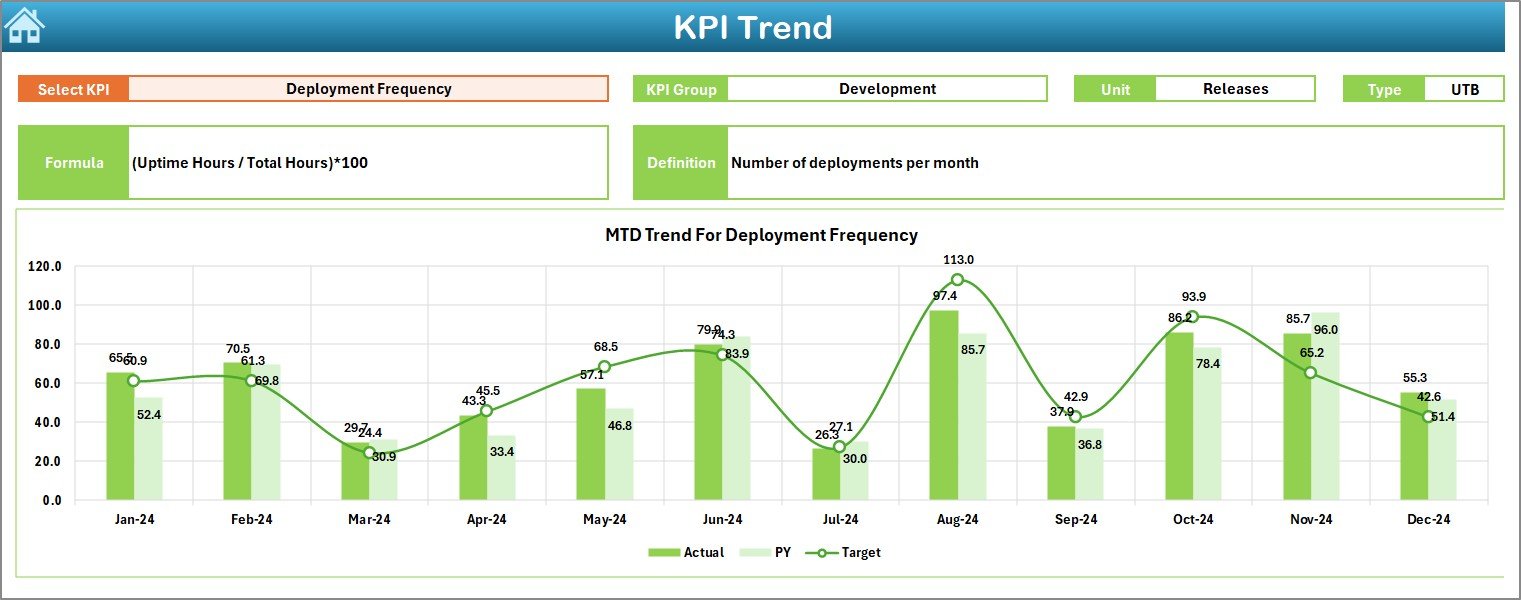
KPI Trend Sheet Tab
-
Choose any KPI from a drop-down (Range C3).
Click to Purchases IT and Tech Growth Metrics KPI Dashboard in Excel
Displays:
- KPI Group
- Unit of Measure
- KPI Type (Upper the Better or Lower the Better)
- Formula and Definition
-
Shows trend charts for MTD and YTD performance over time.
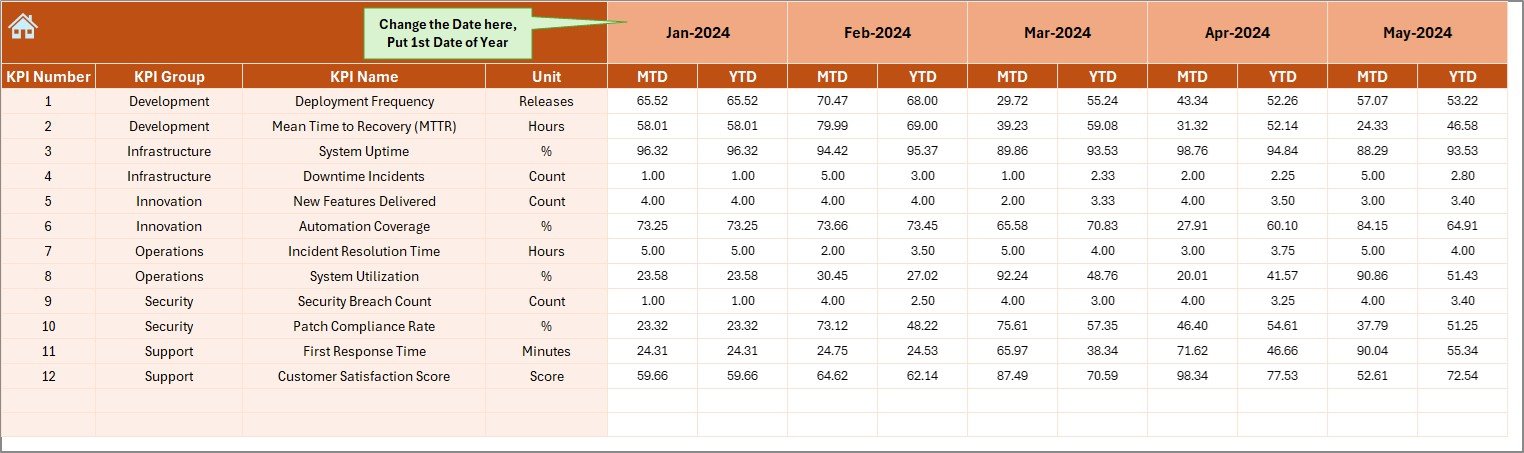
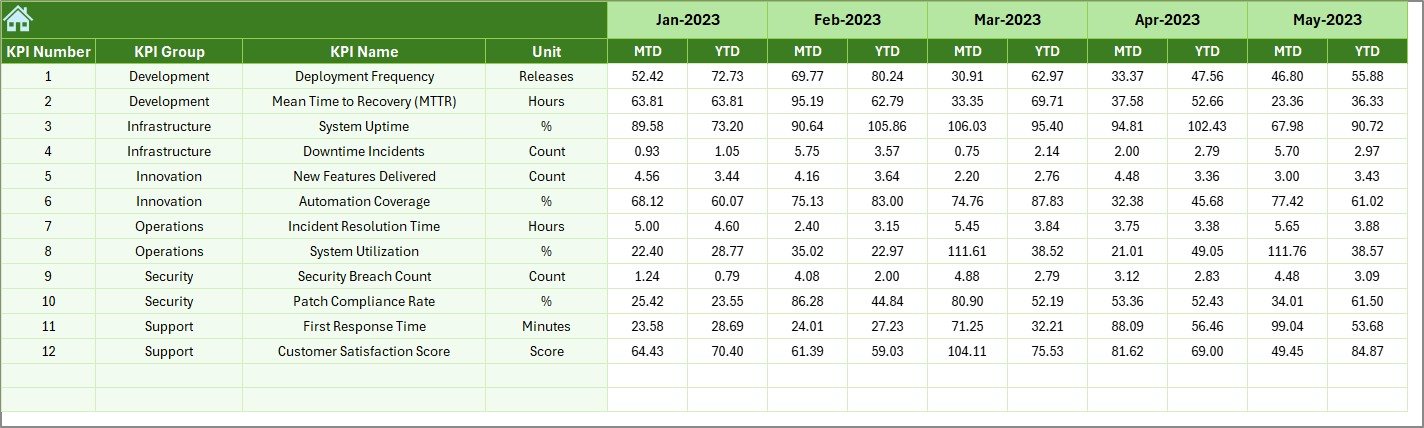
Actual Numbers Input Sheet
-
Enter actual performance data for each KPI.
-
You can define the starting month of the year (Cell E1).
-
Update both MTD and YTD figures for each selected month.
Target Sheet Tab
-
Enter the monthly target values (both MTD and YTD) for each KPI.
-
Provides side-by-side comparisons with actual results on the dashboard.
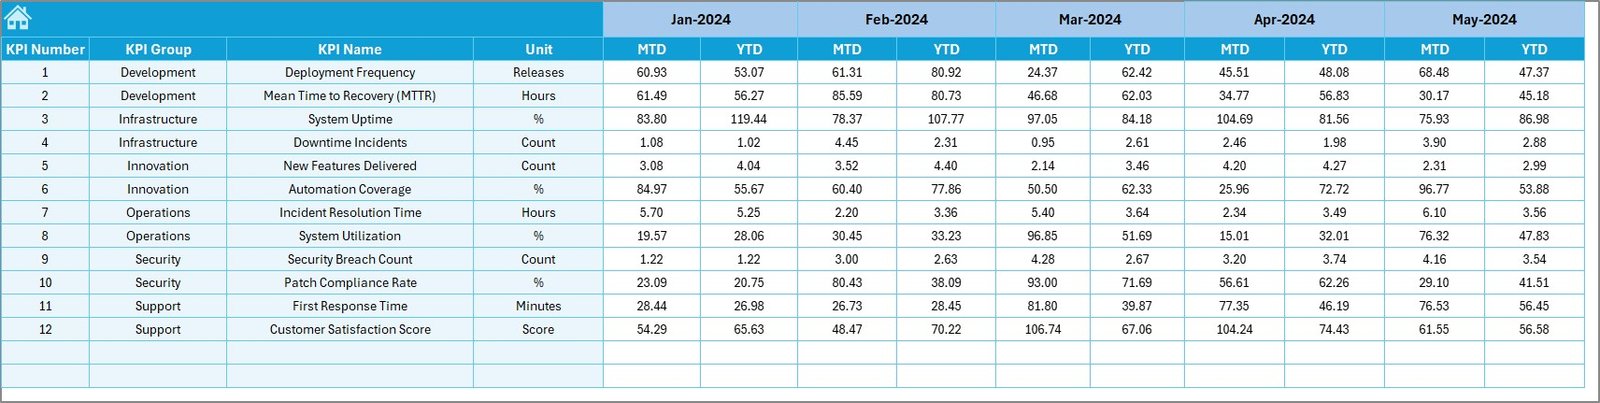
Previous Year Number Sheet Tab
-
Enter previous year’s MTD and YTD values for each KPI.
-
Helps in year-over-year comparisons and identifying growth trends.
KPI Definition Sheet Tab
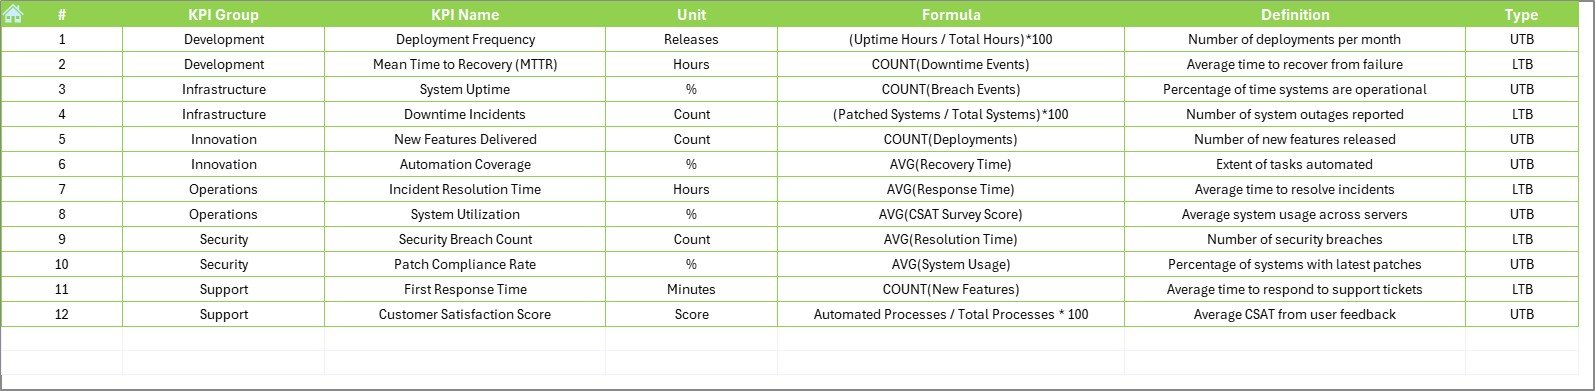
-
A comprehensive reference sheet.
Includes:
- KPI Name
- KPI Group
- Unit
- Formula
- Short, actionable KPI definition
Why Should You Use This Dashboard?
Let’s face it — manually tracking IT growth across spreadsheets, emails, or scattered tools is a nightmare. This dashboard helps eliminate that chaos.
Advantages of IT and Tech Growth Metrics KPI Dashboard in Excel
✅ Centralized Performance View
Track all your KPIs in one place, making it easier to align team efforts with organizational goals.
✅ Visual Insights with Trend Arrows
Quickly identify what’s working and what’s not using color-coded arrows and charts.
✅ Improved Decision-Making
Use the dashboard to inform strategy, optimize operations, and allocate resources smartly.
✅ Historical and Target Comparisons
Benchmark current performance against last year’s numbers and defined targets.
✅ User-Friendly and Fully Editable
Even non-tech professionals can use this Excel tool without needing advanced knowledge.
How to Use the Dashboard Effectively
If you’re new to this type of dashboard, here’s a simple guide to get started:
Step 1: Enter the Actual Data
Navigate to the Actual Numbers Input sheet. Input your current data for each KPI by month.
Step 2: Define the Targets
Use the Target Sheet to enter your MTD and YTD goals. These values will appear on the dashboard for comparison.
Step 3: Add Previous Year Data
Go to the Previous Year Number sheet and input past performance numbers. This will help track year-over-year growth.
Step 4: Analyze the Dashboard
Jump to the Dashboard Sheet and pick the month from the drop-down menu. Instantly, your numbers, arrows, and trends update!
Step 5: Dive Deeper with Trends
Use the KPI Trend Sheet to monitor performance over time. Spot early trends and adjust your strategy accordingly.
Click to Purchases IT and Tech Growth Metrics KPI Dashboard in Excel
Best Practices for IT and Tech KPI Dashboards
To make your dashboard even more effective, follow these proven best practices:
-
Be Selective with KPIs: Don’t overload the dashboard. Choose 10–15 metrics that matter most.
-
Use Actionable Definitions: Ensure every KPI has a clear definition and business relevance.
-
Keep Data Fresh: Update actual, target, and previous year data every month to maintain accuracy.
-
Visualize Smartly: Use color-coded arrows, bar charts, and doughnut charts to communicate data visually.
-
Engage Stakeholders: Share the dashboard monthly with your leadership or team during reviews.
How This Dashboard Supports Continuous Growth
This isn’t just a static report. By regularly updating the dashboard, you create a continuous feedback loop that drives performance:
-
Measure what’s happening now.
-
Compare with goals and past results.
-
Decide what needs action.
-
Improve based on insights.
-
Repeat every month.
This cycle leads to continuous improvement, helping your team deliver more value over time.
Who Should Use This KPI Dashboard?
This tool is perfect for:
-
IT Managers tracking infrastructure and service KPIs
-
CTOs and CIOs needing high-level monthly reporting
-
Startup Founders looking to monitor early growth
-
Project Managers keeping an eye on deliverables
-
Data Analysts preparing performance reports
Customization Tips
Want to take it a step further? Here are some ways to personalize your dashboard:
-
Add slicers for department or region-wise analysis.
-
Insert charts like stacked column, line, or combo graphs.
-
Use VBA to automate data entry or monthly snapshots.
-
Integrate with Power Query or Power BI for more advanced insights.
Conclusion
The IT and Tech Growth Metrics KPI Dashboard in Excel is more than just a spreadsheet — it’s a powerful performance engine. It helps you monitor what matters, compare against your targets, and act quickly when things go off track. Best of all, it’s easy to use, visually rich, and customizable for any tech environment.
If you’re serious about scaling your tech operations and improving efficiency, this dashboard gives you everything you need in one place.
Frequently Asked Questions (FAQs)
1. Can I customize the KPIs in this dashboard?
Absolutely! You can add, rename, or delete KPIs directly from the KPI Definition and Data sheets.
2. Do I need to know Excel formulas to use this?
Not at all. Most of the heavy lifting is already done. You just enter the values, and the dashboard updates automatically.
3. Can this be used for weekly reporting instead of monthly?
While this dashboard is optimized for monthly data, you can easily adapt it for weekly use by updating date ranges and formulas.
4. Is this compatible with older versions of Excel?
Yes. This dashboard works in Excel 2013 and above. For best performance, use Excel 2016 or later.
5. What’s the best way to share this with others?
You can save it as a PDF report, or export to PowerPoint for presentations. You can also upload it to a shared drive for team access.
Visit our YouTube channel to learn step-by-step video tutorials
Click to Purchases IT and Tech Growth Metrics KPI Dashboard in Excel