Managing IT assets can be a time-consuming and error-prone process—especially if you still rely on scattered spreadsheets, manual updates, or outdated systems. Whether you are handling hardware, software licenses, or IT infrastructure components, it’s crucial to monitor everything accurately and efficiently. That’s where the IT Asset Management Dashboard in Excel steps in to transform your operations.
This article will walk you through everything you need to know about using an IT Asset Management Dashboard in Excel—from its structure and features to advantages, best practices, and FAQs.
Click to Purchases IT Asset Management Dashboard in Excel
What Is an IT Asset Management Dashboard in Excel?
An IT Asset Management (ITAM) Dashboard in Excel is a prebuilt, interactive, and visually-driven tool that helps organizations manage their IT assets with clarity and control. It brings together key data like asset type, status, department allocation, depreciation value, vendor information, and warranty timelines—all in a single, dynamic Excel file.
Designed for IT teams, administrators, and business managers, this tool eliminates guesswork, enables quick decision-making, and ensures cost-efficient IT operations.
Inside the IT Asset Management Dashboard – Sheet-by-Sheet Breakdown
The Excel template comes with 5 powerful dashboard pages and 2 supporting sheets to help you gain actionable insights with just a few clicks.
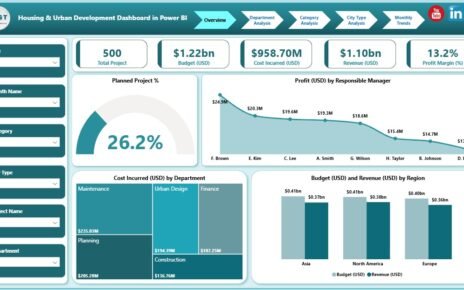
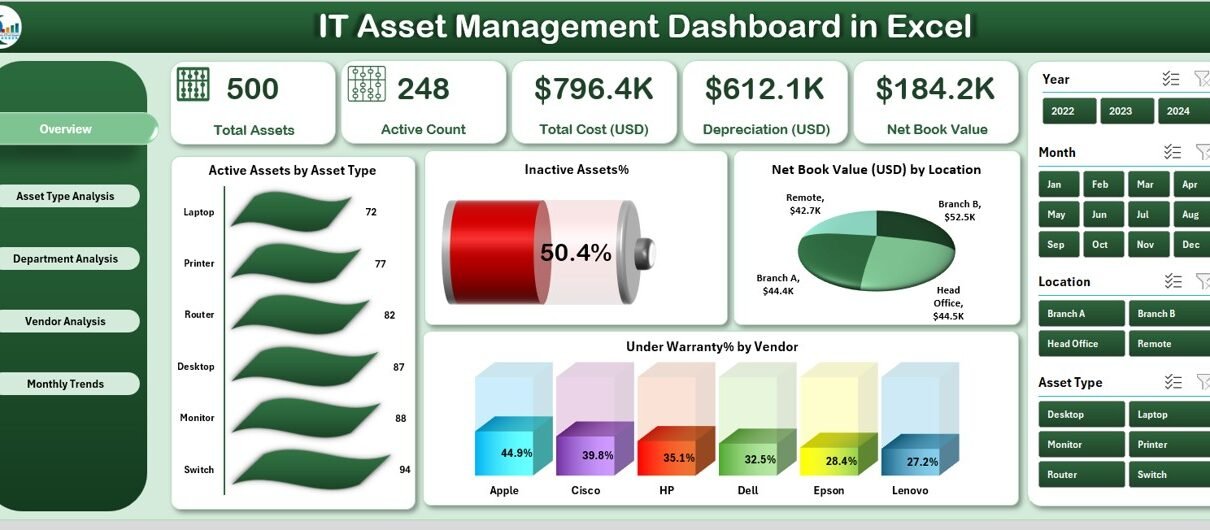
Overview Page – A Snapshot of Your IT World
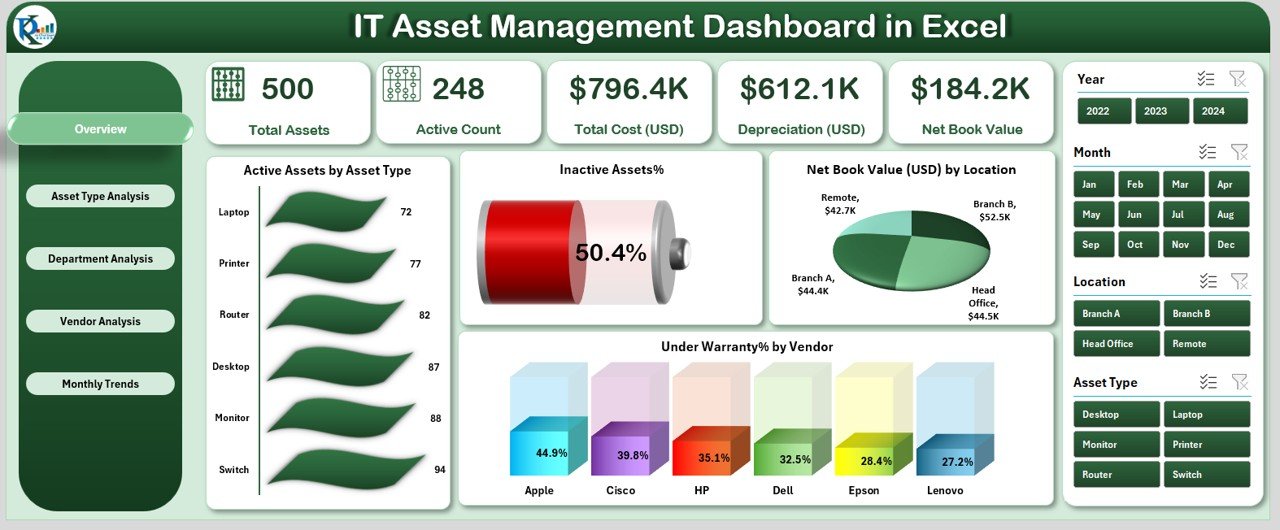
The Overview Page is the central hub of your asset management dashboard. On the left, a page navigator allows seamless switching between tabs. On the right, slicers (filters) give you the flexibility to drill down by date, department, asset type, or vendor.
What You’ll See Here:
5 KPI Cards showing:
-
Total Assets
-
Active Assets
-
Inactive Assets
-
Total Net Book Value (USD)
-
Assets Under Warranty (%)
4 Key Charts:
-
Active Assets by Asset Type
-
Inactive Assets (%)
-
Net Book Value (USD) by Location
-
Under Warranty (%) by Vendor
This page offers a bird’s-eye view of your IT inventory and its financial implications.
Asset Type Analysis – Know What You Own

This section breaks down the data based on asset types—whether it’s laptops, desktops, servers, routers, or mobile devices.
Charts Included:
-
Net Book Value (USD) by Asset Type
-
Inactive Assets by Asset Type
-
Under Warranty (%) by Asset Type
Use this page to identify which asset types carry more value, where replacements are due, and how well warranties are managed.
Department Analysis – Who Uses What?
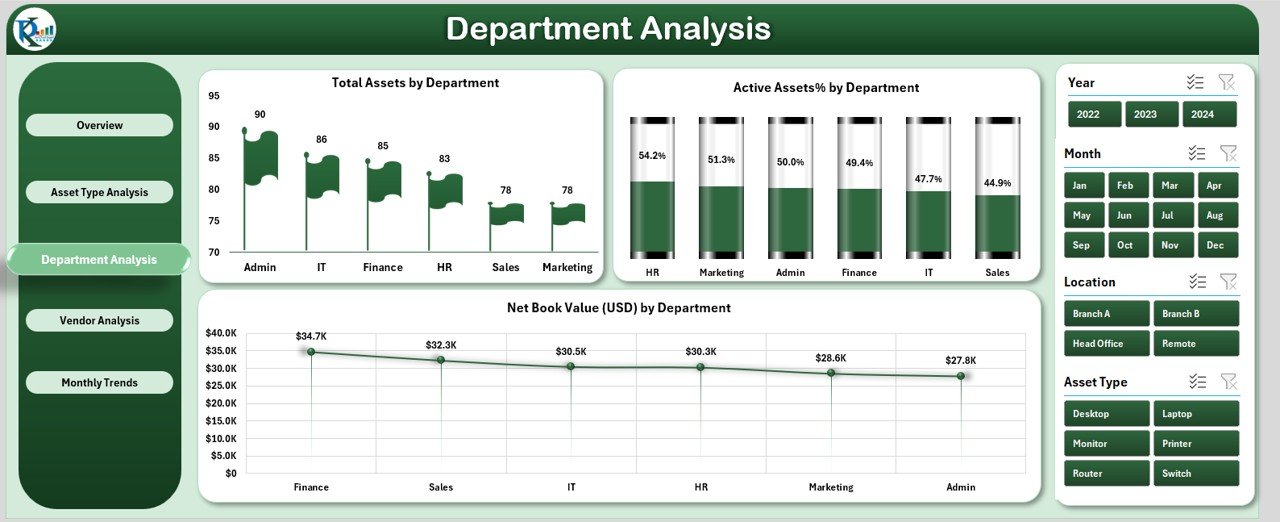
The Department Analysis Page tells you how assets are distributed across various departments—HR, Finance, Sales, IT, Admin, etc.
Charts Covered:
-
Total Assets by Department
-
Active Assets (%) by Department
-
Net Book Value (USD) by Department
This is crucial for budgeting, inter-department audits, and operational planning.
Location Analysis – Are Your Vendors Performing?

Keeping track of vendors is critical when it comes to warranty, asset replacement, and depreciation.
Charts You’ll See:
-
Avg. Asset Age (Days) by Vendor
-
Avg. Warranty Left (Days) by Vendor
-
Depreciation (USD) by Vendor
-
Under Warranty (%) by Vendor
Tip: This page can help you negotiate better contracts and understand the performance of vendors over time.
Monthly Trends – Analyze the Movement
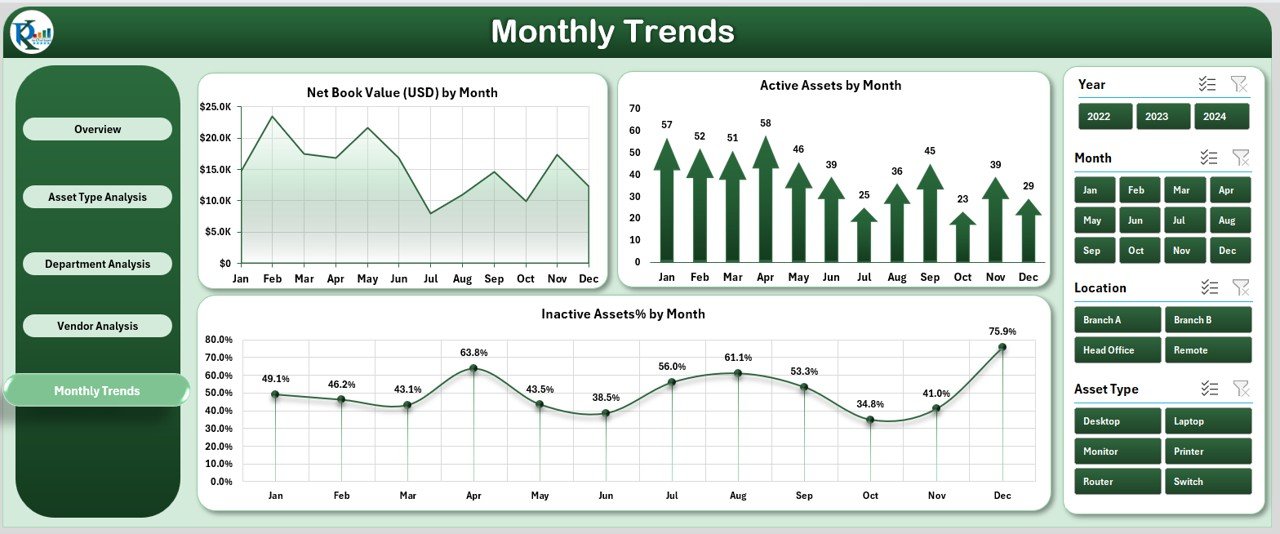
The Monthly Trends Page reveals how your assets evolve over time. You can see trends in asset acquisition, deactivation, depreciation, and warranty aging.
Included Charts:
-
Net Book Value (USD) by Month
-
Active Assets by Month
-
Inactive Assets (%) by Month
Use this for monthly reports and planning new purchases or replacements.
Supporting Sheets – The Backbone of the Dashboard
Click to Purchases IT Asset Management Dashboard in Excel
Data Sheet
The Data Sheet is where you maintain raw data. It includes columns like:
-
Asset ID
-
Asset Type
-
Department
-
Vendor
-
Purchase Date
-
Warranty Period
-
Current Value
-
Depreciation Rate
-
Asset Status (Active/Inactive)
This sheet powers all the calculations and visualizations in your dashboard.
Support Sheet
This sheet contains reference data like dropdown options, asset types, vendor names, department names, and formulas used for slicers and calculations. It ensures the dashboard remains dynamic and user-friendly.
Advantages of IT Asset Management Dashboard in Excel
Implementing this Excel-based tool offers a range of benefits. Here are the top advantages:
✅ Centralized Data: All asset-related data lives in one file—no need for multiple systems
📊 Visual Insights: Charts and KPIs help you spot issues and opportunities instantly
🧩 Customizable: Easily adapt the dashboard to your organization’s structure
💰 Cost-Effective: No expensive software required—works in Excel
🔄 Real-Time Updates: Automatically reflects changes in data
🕵️ Better Compliance: Helps track warranties, depreciation, and ownership for audits
⏱️ Time-Saving: Less manual tracking, more automation
Best Practices for the IT Asset Management Dashboard in Excel
To get the most out of your ITAM dashboard, follow these proven best practices:
1. Keep Data Clean and Updated
Regularly review the Data Sheet. Avoid duplicates, update statuses, and ensure warranty dates are current.
2. Use Drop-Downs and Data Validation
Prevent manual errors by using predefined lists for fields like department, asset type, and vendor.
3. Schedule Monthly Audits
At least once a month, run a sanity check on the dashboard—especially the asset age and warranty columns.
4. Automate Calculations
Leverage Excel formulas (like DATEDIF, IFERROR, and VLOOKUP) to auto-calculate warranty expiry, depreciation, and asset age.
5. Use Conditional Formatting
Highlight assets nearing warranty expiration or those marked inactive for over 90 days.
6. Integrate with Barcode or QR Scanners (Optional)
If you manage a large inventory, consider adding barcode tags and scanning them into Excel.
Who Should Use This Dashboard?
This dashboard is ideal for:
✅ IT Managers
✅ Asset and Inventory Officers
✅ Small and Medium Business Owners
✅ Facility Managers
✅ Internal Auditors
✅ Corporate Procurement Teams
Whether you’re managing 100 or 10,000 assets, this tool simplifies your tracking and reporting process.
Why Use Excel for IT Asset Management?
You may wonder, “Why Excel? Isn’t that outdated?”
Here’s why Excel still rocks for asset management:
📥 Easily Accessible: Most businesses already use Excel
💡 Familiar Interface: No learning curve
🧮 Formula Power: Enables advanced calculations without coding
📊 Visualization Tools: PivotCharts, slicers, and conditional formatting
🔌 Integration Ready: Easily export to Power BI, SharePoint, or Google Sheets
Excel offers flexibility without the high costs or steep learning curves of ERP tools.
Conclusion – Make Smarter IT Decisions with Excel Dashboards
Managing IT assets doesn’t have to be chaotic or overly complex. With the IT Asset Management Dashboard in Excel, you gain control, clarity, and confidence in your IT operations.
This tool doesn’t just track assets—it empowers decisions, supports compliance, and saves time. You don’t need to invest in expensive asset management systems when Excel, with the right structure, can do the job with elegance and accuracy.
So, start using this ready-to-use dashboard today and turn your IT asset chaos into crystal-clear intelligence.
Frequently Asked Questions (FAQs)
Q1. Can I use this IT Asset Management Dashboard without any advanced Excel knowledge?
Absolutely! The dashboard is designed for non-technical users. If you know basic Excel operations like entering data and using filters, you’re good to go.
Q2. How can I calculate asset depreciation in Excel?
You can use the straight-line depreciation formula:Depreciation = (Purchase Cost – Salvage Value) / Useful Life
You can implement this easily in the data sheet using Excel formulas.
Q3. Can I track software licenses using this dashboard?
Yes, you can extend the asset types to include software licenses, cloud subscriptions, and more. Just adjust the columns to capture license expiration and user assignments.
Q4. What if I manage multiple locations?
The dashboard supports filtering by location, allowing you to view asset distribution and net book value by site.
Q5. Is this dashboard scalable for large enterprises?
Yes. You can manage thousands of records with this tool. For even more power, you can connect it with Power BI or migrate to Google Sheets with App Scripts for cloud-based collaboration.
Q6. Can I customize the dashboard to match my company branding?
Definitely! You can change chart colors, add your company logo, and even create branded headers and footers.
Q7. How often should I update the dashboard?
Ideally, update it weekly or monthly—especially after new purchases, disposals, or software updates. You can automate reminders using Excel alerts or Power Automate.
Visit our YouTube channel to learn step-by-step video tutorials