Managing IT assets has become one of the most critical operational responsibilities in today’s tech-driven business landscape. Whether you’re running a small startup or a large enterprise, keeping track of your hardware, software, and related infrastructure can make or break your IT department’s efficiency and budget.
That’s where the IT Asset Management Report in Excel comes in—a ready-to-use, easy-to-navigate reporting system that helps you track asset usage, value, status, and warranties. In this article, we’ll explore the full scope of this Excel-based report: its features, benefits, use cases, and best practices.
Click to Purchases IT Asset Management Report in Excel
What is an IT Asset Management Report in Excel?
An IT Asset Management (ITAM) Report in Excel is a comprehensive, spreadsheet-based tool designed to document, track, and analyze your organization’s IT inventory. This includes computers, servers, software licenses, peripherals, and even network equipment. With built-in dashboards, slicers, and pivot charts, this report gives you real-time insights into your asset lifecycle—from acquisition to disposal.
Unlike complex asset management software that often requires training and subscriptions, this Excel report offers a lightweight, budget-friendly solution that is simple yet powerful.
Key Features of the IT Asset Management Report in Excel
This professionally designed template contains three core pages and a support sheet, each tailored for detailed tracking and dynamic visualization.
Summary Page
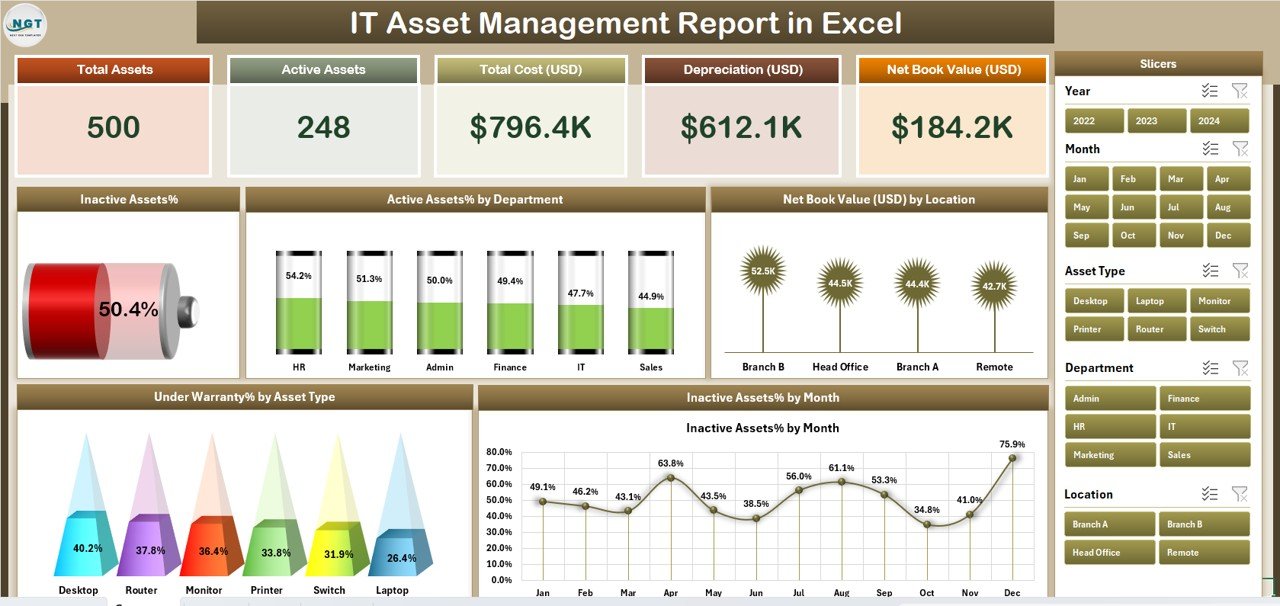
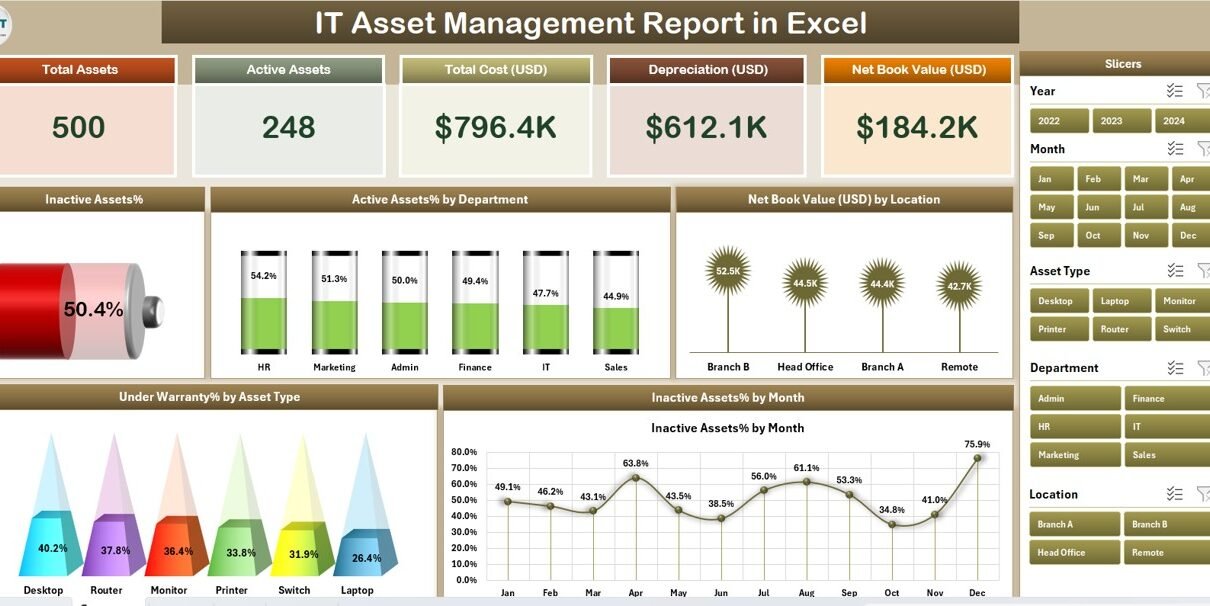
The Summary Page is the heart of this Excel report. It provides a high-level overview of your IT assets, making it ideal for C-level presentations and operational reviews.
It Includes:
🎯 Top 5 KPI Cards such as:
- Total Assets
- Active Assets %
- Inactive Assets %
- Under Warranty Assets
- Net Book Value (USD)
📊 Charts for Visual Analysis:
- Inactive Assets %
- Active Assets % by Department
- Net Book Value (USD) by Location
- Under Warranty % by Asset Type
- Inactive Assets % by Month
📌 Right-side Slicer for quick data filtering (by Department, Status, Location, etc.)
This page ensures that key metrics are always just one click away.
Report Page
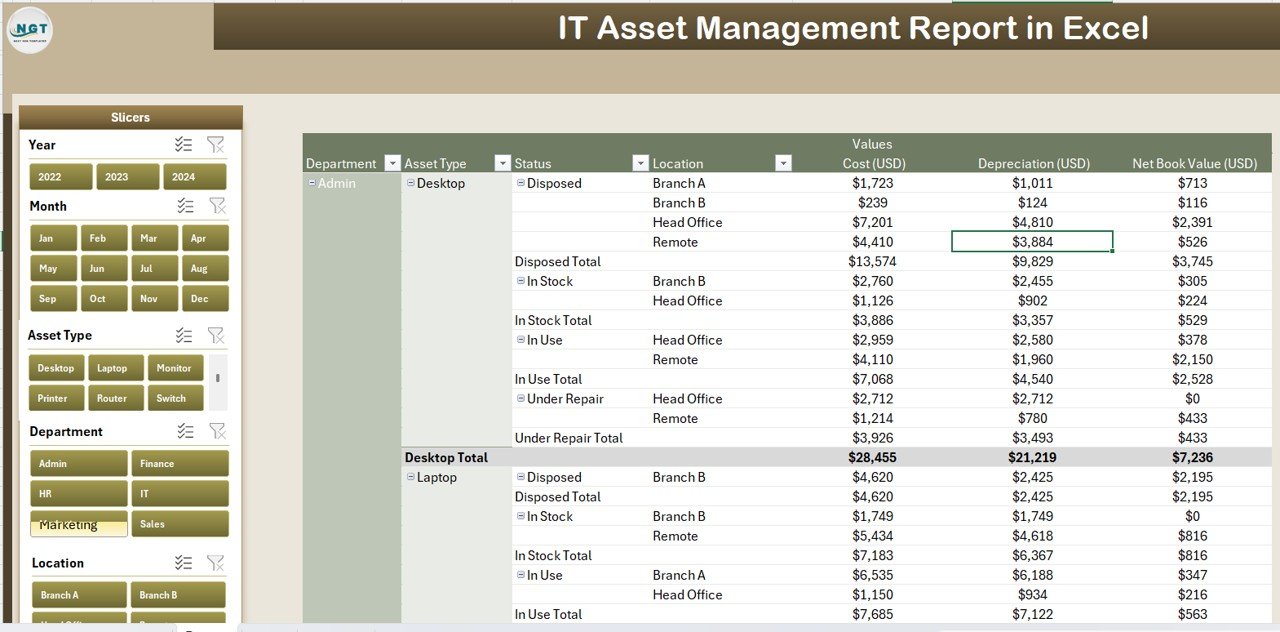
This section is designed for in-depth data inspection. Whether you’re preparing an internal audit, verifying asset transfers, or checking inventory accuracy, this page offers a searchable, slicer-driven table layout.
Features:
-
🔍 Left-side Slicer for customizable filtering
-
📑 Detailed Information Table with sortable columns
-
💡 Ideal for procurement teams and compliance officers
Click to Purchases IT Asset Management Report in Excel
Data Sheet
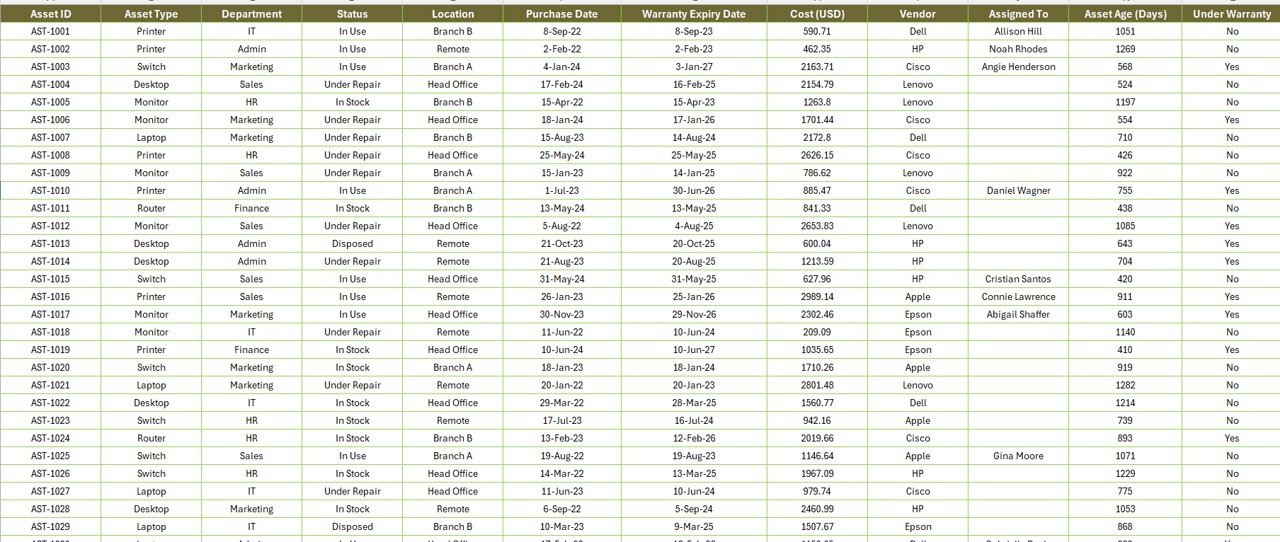
The Data Sheet is the backbone of this report. It houses all the raw data, including:
Support Sheet
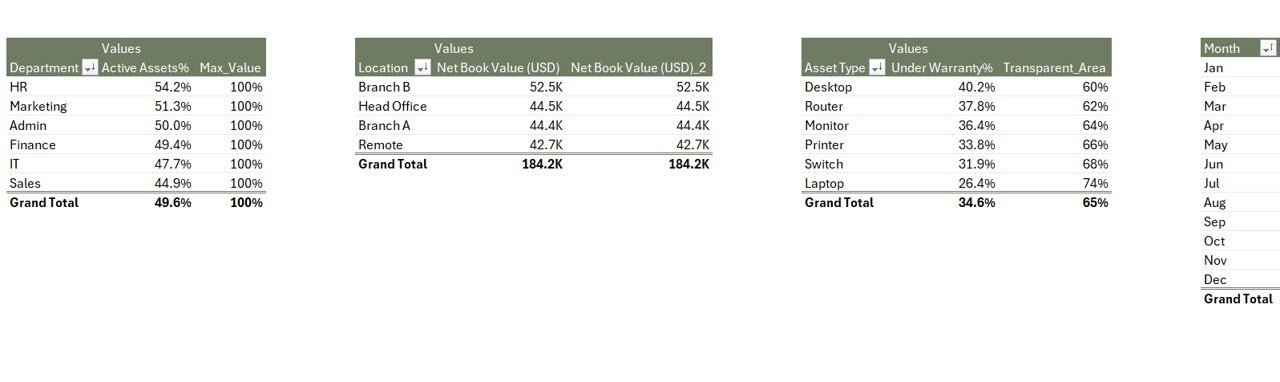
This sheet contains all necessary reference lists such as:
-
Department Names
-
Asset Types
-
Locations
-
Status Options
-
Warranty Flags (Yes/No)
It ensures dropdowns are consistent and error-free across the file.
Why Use Excel for IT Asset Management?
You might wonder, “Why not use specialized software like ServiceNow or ManageEngine?” Well, while those tools are powerful, they are often costly, complex, and require dedicated IT staff for implementation.
On the other hand, Excel provides:
-
🆓 No additional cost (already part of MS Office Suite)
-
⚡ Quick implementation
-
🛠️ Full customization
-
💻 Offline accessibility
-
📁 Easy backup and sharing
Real-World Use Cases
Here are a few practical scenarios where this IT Asset Management Report can prove invaluable:
-
Annual IT Audit Reporting
-
Asset Warranty Expiry Tracking
-
Department-wise Budget Allocation Reviews
-
Compliance Monitoring for ISO or SOC2
-
Depreciation Tracking and Net Book Value Evaluation
Advantages of IT Asset Management Report in Excel
-
✅ User-Friendly Design: Clean layout with slicers and charts
-
✅ Real-Time Filtering: Get instant insights with pivot slicers
-
✅ No Training Needed: Designed for Excel users of all levels
-
✅ Customizable: Add your company’s logo, branding, or fields
-
✅ Time-Saving: Automates reporting, no need for manual summaries
-
✅ Better Decision Making: Enables quick identification of inactive, outdated, or underutilized assets
-
✅ Enhanced Accountability: Assign ownership and track movement
Best Practices for Using the IT Asset Management Report in Excel
To get the most out of this report, consider the following:
-
🗓️ Update regularly: Set weekly or monthly update cycles for the data sheet
-
🧑💼 Assign Responsibility: Designate team members to maintain accurate records
-
🔐 Restrict Access: Protect the data sheet with passwords to avoid accidental edits
-
🧮 Integrate Formulas: Use Excel’s
IF,VLOOKUP,INDEX MATCHto automate checks -
📅 Track Warranty Expiry: Use conditional formatting to highlight expiring warranties
-
📤 Backup Periodically: Save multiple versions or sync with OneDrive for redundancy
-
📈 Leverage Pivot Charts: Use filters to present department-specific summaries in meetings
How to Customize the IT Asset Management Report
Here are a few customization ideas to match your specific organizational needs:
-
Add fields like Serial Number, Last Service Date, or Assigned To
-
Integrate color-coded conditional formatting for status tracking
-
Create drop-down filters for software licenses, lease status, or cost centers
-
Incorporate Gantt chart or timeline for lifecycle analysis
-
Add slicers for Month and Year in the Summary Page
How This Template Saves You Time and Money
Instead of wasting hours building manual reports or navigating complex software, this template provides:
-
🧭 One-click navigation with page buttons
-
📊 Automatic charts and summaries
-
🔄 Refreshable pivot tables
-
📥 Ease of data import/export
-
📉 Visual indicators for warranty, inactivity, or depreciation
Final Thoughts
An IT Asset Management Report in Excel is more than just a spreadsheet—it’s a powerful tracking tool designed to simplify your workflow, reduce costs, and improve your asset lifecycle decisions. With built-in visualizations, real-time filtering, and easy data input options, this Excel template is the perfect starting point for businesses that want control without complexity.
Start using this ready-to-use tool today and gain clarity over your IT ecosystem—without relying on complicated software.
Frequently Asked Questions (FAQs)
1. Can I use this Excel template without technical skills?
Absolutely. It’s designed with user-friendly slicers and dropdowns. Anyone with basic Excel knowledge can use it.
2. Can I add more fields like Serial Number or Assigned User?
Yes, you can easily add extra columns in the Data Sheet and update pivot tables accordingly.
3. Is this report suitable for large enterprises?
Yes. While it’s built in Excel, it can comfortably manage thousands of records. However, for extremely large inventories, integrating it with a database might improve performance.
4. Can I use this on Excel Online or Google Sheets?
It is optimized for Excel desktop version due to slicers and pivot chart dependencies. Google Sheets lacks some of these advanced features.
5. Can I track software assets too?
Yes. You can add a new Asset Type category like “Software” and track license keys, vendors, and expiry dates.
6. Is the dashboard mobile-friendly?
Since it’s an Excel file, it is best viewed on desktops or tablets. Mobile viewing is possible but limited in interaction.
7. Can I password-protect my report?
Yes. Excel allows you to lock sheets and protect them with a password to prevent unauthorized editing.
8. How often should I update the asset records?
Ideally, update it every time there’s a new purchase, decommissioning, or reassignment. A weekly or bi-weekly cycle works well.
Visit our YouTube channel to learn step-by-step video tutorials