Legal advisory teams play a critical role in every organization. They manage contracts, handle litigation, ensure compliance, control risks, and support strategic decisions. However, legal work often feels complex to measure. Many teams still depend on emails, static spreadsheets, or manual reports. As a result, leadership lacks clarity, and legal teams struggle to prove value.
That is exactly where a Legal Advisory KPI Dashboard in Excel delivers real impact.
In this in-depth and SEO-friendly guide, you will learn what a Legal Advisory KPI Dashboard in Excel is, why it matters, how it works, and how each worksheet supports legal performance tracking. Moreover, you will explore the advantages, best practices, and frequently asked questions related to this ready-to-use dashboard. By the end of this article, you will clearly understand how this Excel dashboard helps legal teams move from reactive reporting to proactive, data-driven decision-making.
Click to Purchases Legal Advisory KPI Dashboard in Excel
What Is a Legal Advisory KPI Dashboard in Excel?
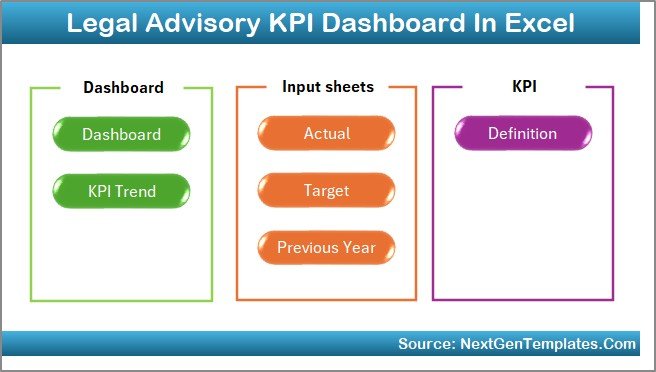
A Legal Advisory KPI Dashboard in Excel is a structured, interactive, and ready-to-use reporting tool designed to track, monitor, and analyze key performance indicators related to legal advisory functions.
Instead of managing multiple files or manual reports, this dashboard consolidates all legal KPIs into a single Excel workbook. As a result, legal heads, compliance officers, general counsels, and senior management gain instant visibility into performance.
Moreover, Excel provides flexibility, familiarity, and control. Therefore, legal teams can update data quickly, customize KPIs easily, and analyze trends without complex software.
Why Do Legal Advisory Teams Need a KPI Dashboard?
Legal departments handle sensitive, high-risk, and time-critical work. However, without structured tracking, decision-making becomes reactive. A Legal Advisory KPI Dashboard in Excel solves this challenge effectively.
Key Reasons Legal Teams Need This Dashboard
-
It provides clear visibility into legal workload and outcomes
-
It tracks MTD and YTD performance against targets
-
It highlights risks, delays, and compliance gaps early
-
It supports data-backed reporting to leadership
-
It improves accountability across legal functions
Therefore, this dashboard transforms legal operations from intuition-driven to insight-driven.
How Does a Legal Advisory KPI Dashboard in Excel Work?
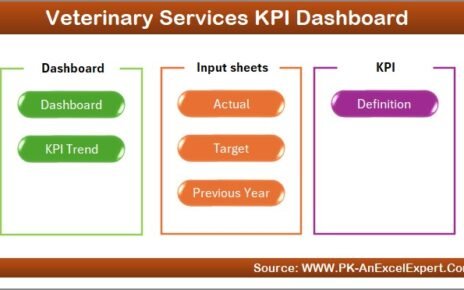
The Legal Advisory KPI Dashboard in Excel works through a well-structured system of interconnected worksheets. Each sheet serves a specific purpose, while formulas and charts update results automatically.
You enter data once, and the dashboard instantly reflects performance across Monthly, Year-to-Date, Target, and Previous Year comparisons.
Because everything runs inside Excel, users avoid complex tools and lengthy training.
What Are the Key Features of the Legal Advisory KPI Dashboard in Excel?
This ready-to-use dashboard includes 7 professionally designed worksheets. Each worksheet plays a vital role in legal performance management.
1. Home Sheet: How Does the Index Page Improve Navigation?
The Home Sheet acts as the central navigation hub of the dashboard.
Key Highlights of the Home Sheet
-
Clean and professional index layout
-
6 interactive buttons to navigate instantly
-
One-click access to all major worksheets
-
User-friendly design for non-technical users
As a result, users save time and move across sheets without confusion.
2. Dashboard Sheet: How Does It Show Complete KPI Performance?
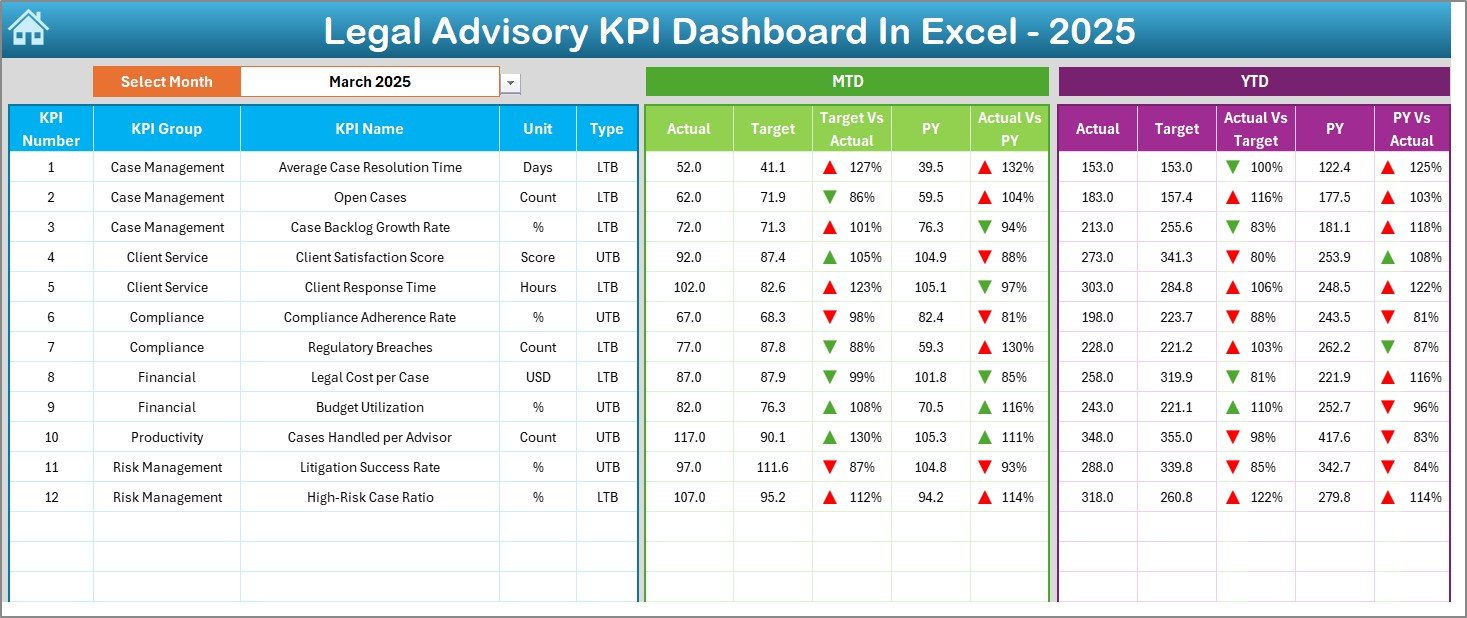
The Dashboard Sheet serves as the main analytical page of the Legal Advisory KPI Dashboard in Excel.
What Makes This Dashboard Powerful?
-
Month selection using a drop-down on cell D3
-
Automatic refresh of all metrics based on the selected month
-
Clear comparison across Actual, Target, and Previous Year
KPIs Displayed on the Dashboard
-
MTD Actual vs Target
-
MTD Actual vs Previous Year
-
YTD Actual vs Target
-
YTD Actual vs Previous Year
Additionally, the dashboard uses conditional formatting with up and down arrows. Therefore, users instantly identify positive or negative trends.
3. KPI Trend Sheet: How Can You Analyze KPI Behavior Over Time?
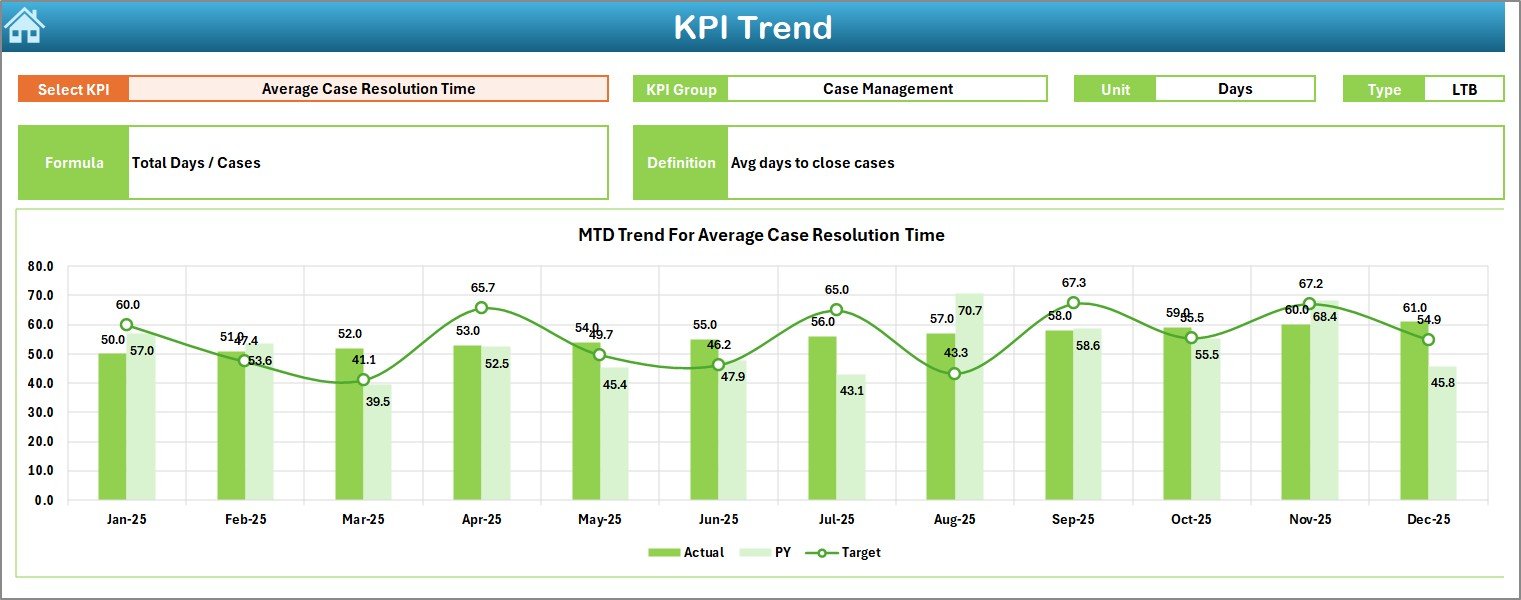
The KPI Trend Sheet focuses on deep KPI-level analysis.
How This Sheet Works
-
Select the KPI Name from the drop-down (Cell C3)
-
Automatically display:
-
KPI Group
-
KPI Unit
-
KPI Type (LTB or UTB)
-
KPI Formula
-
KPI Definition
-
Visual Insights Provided
-
MTD trend chart for Actual, Target, and Previous Year
-
YTD trend chart for Actual, Target, and Previous Year
As a result, legal teams quickly understand performance patterns, improvements, or risks.
Click to Purchases Legal Advisory KPI Dashboard in Excel
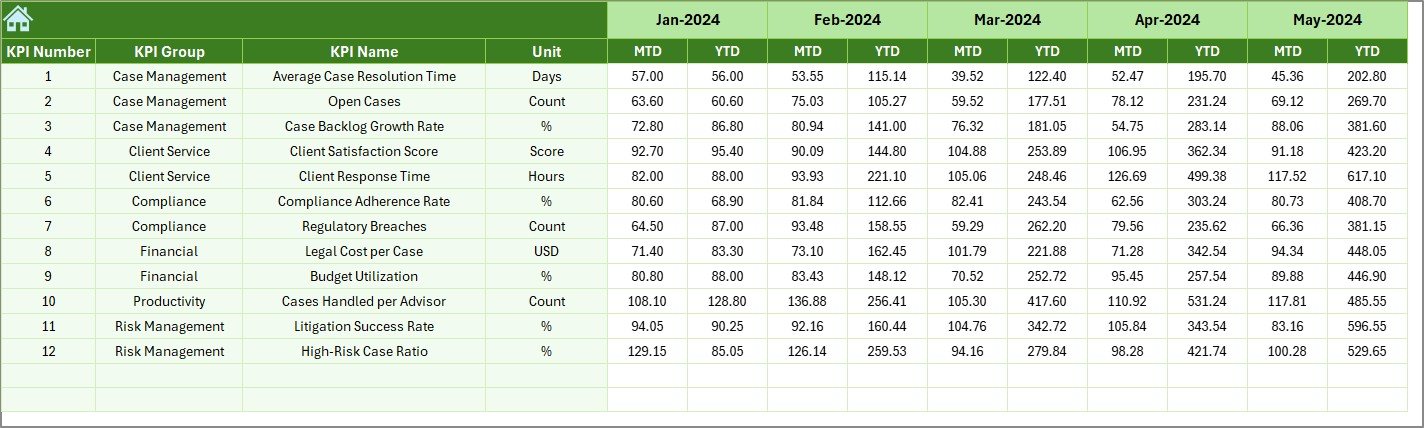
4. Actual Numbers Input Sheet: How Do You Enter Legal Performance Data?
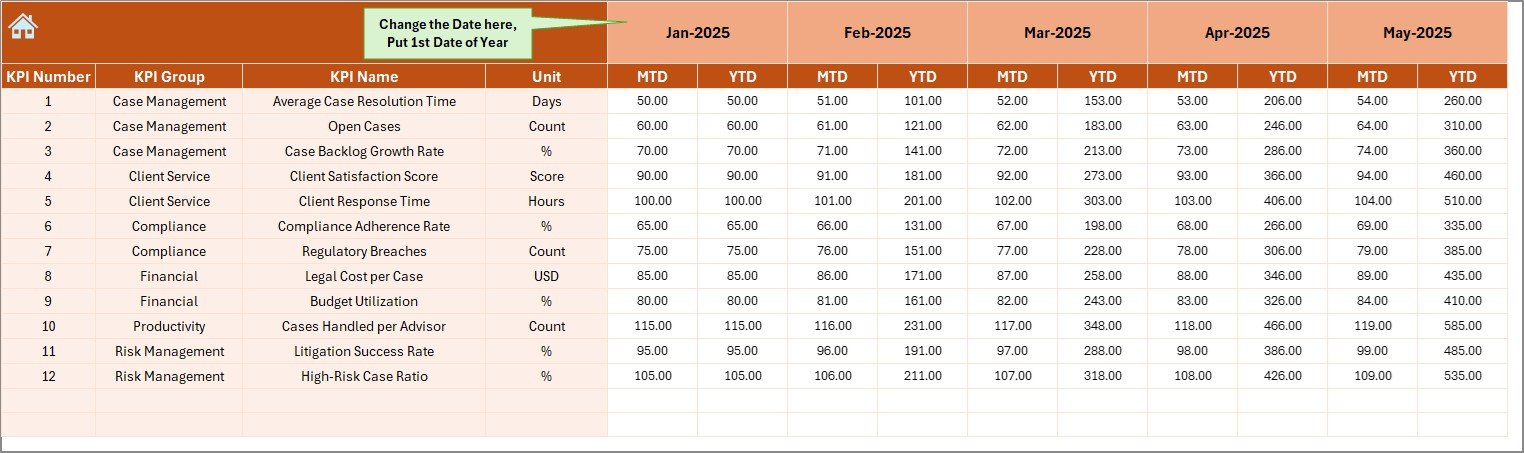
The Actual Numbers Input Sheet captures real performance data.
Key Functionalities
-
Enter MTD and YTD actual values
-
Change the reporting month using Cell E1
-
Enter only the first month of the year once
-
Automatic calculations for subsequent months
Because of this design, users avoid repetitive data entry and reduce errors.
5. Target Sheet: How Do You Track Legal Goals?
The Target Sheet defines performance expectations.
Why Target Tracking Matters
-
It sets clear benchmarks for each KPI
-
It aligns legal efforts with organizational goals
-
It enables fair performance evaluation
What You Enter in This Sheet
-
Monthly MTD target values
-
Cumulative YTD target values
Once entered, the dashboard compares actuals against targets automatically.
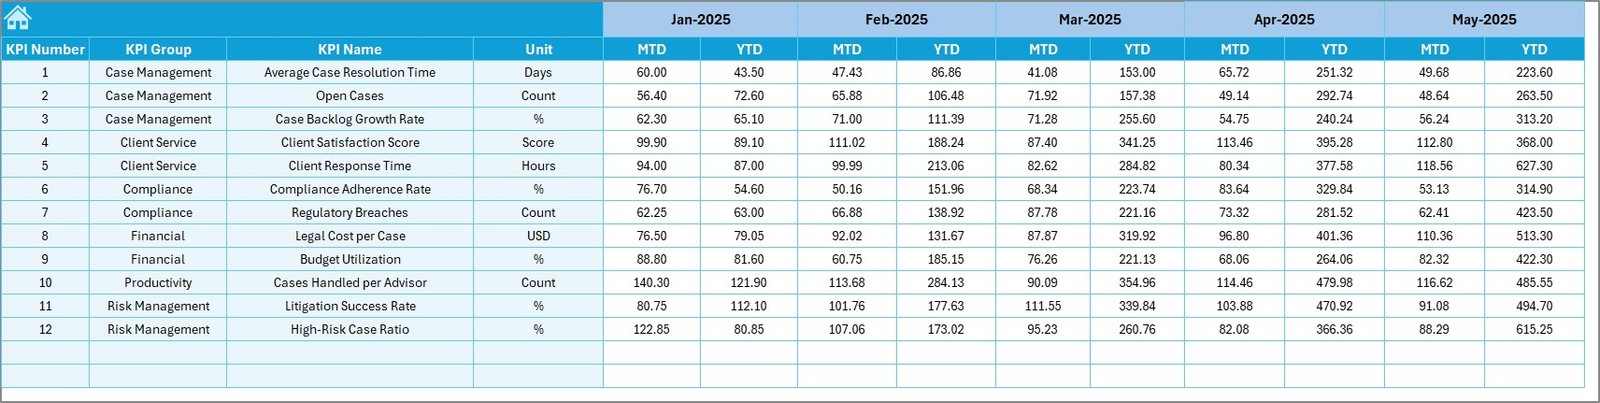
6. Previous Year Numbers Sheet: Why Is Historical Comparison Important?
The Previous Year Numbers Sheet stores last year’s legal performance data.
Benefits of Previous Year Comparison
-
Understand growth or decline clearly
-
Identify recurring legal issues
-
Measure long-term improvements
You enter data in the same structure as the current year, which ensures consistent comparison.
7. KPI Definition Sheet: How Does It Ensure KPI Clarity?
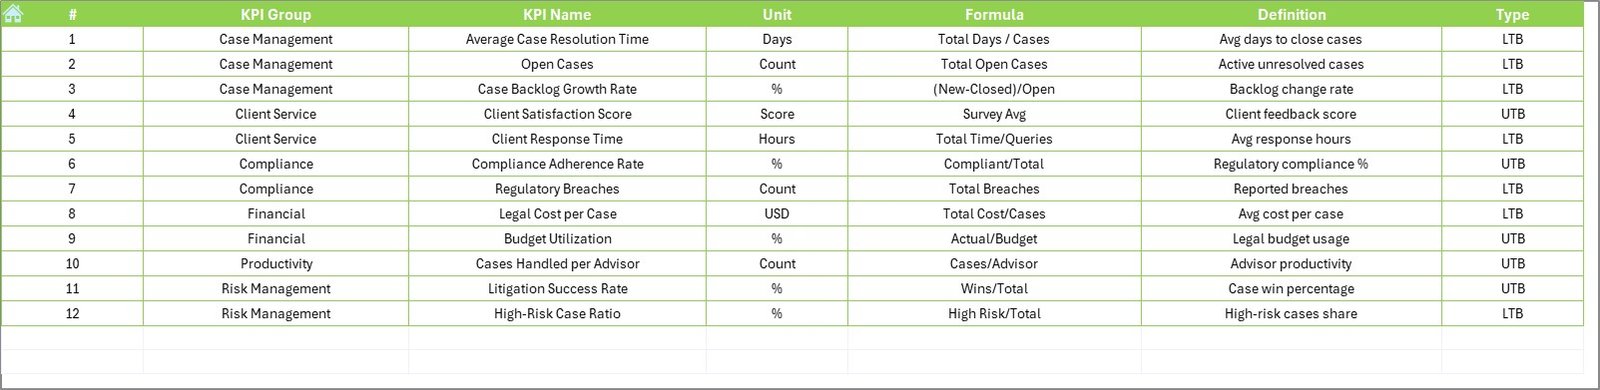
The KPI Definition Sheet acts as the foundation of the dashboard.
Information Captured in This Sheet
-
KPI Name
-
KPI Group
-
Unit of Measurement
-
Formula
-
KPI Definition
Because all KPIs stay clearly defined, teams avoid confusion and misinterpretation.
What KPIs Can You Track Using a Legal Advisory KPI Dashboard in Excel?
This dashboard supports a wide range of legal KPIs, including:
-
Contract turnaround time
-
Litigation success rate
-
Compliance adherence rate
-
Legal cost per case
-
Case resolution cycle time
-
Regulatory filings completion rate
-
Internal legal request closure rate
Moreover, teams can customize KPIs based on organizational needs.
Advantages of Legal Advisory KPI Dashboard in Excel
Click to Purchases Legal Advisory KPI Dashboard in Excel
A Legal Advisory KPI Dashboard in Excel offers several strategic and operational advantages.
Key Advantages
-
Centralized legal performance tracking
-
Real-time visibility into MTD and YTD metrics
-
Improved accountability across legal functions
-
Better decision-making using data-backed insights
-
Easy customization without technical skills
-
Cost-effective solution compared to BI tools
-
Excel-native design familiar to most users
Therefore, this dashboard becomes a powerful management tool rather than just a reporting file.
How Does This Dashboard Support Legal Leadership?
Legal leaders often struggle to communicate performance clearly. This dashboard simplifies that challenge.
Leadership Benefits
-
Clear performance snapshots during reviews
-
Visual comparison against targets
-
Early risk identification
-
Strong support for board-level reporting
As a result, legal leaders gain confidence and credibility.
Best Practices for the Legal Advisory KPI Dashboard in Excel
To maximize value, teams should follow proven best practices.
Best Practices to Follow
-
Define KPIs clearly before implementation
-
Update actual data consistently every month
-
Review trends, not just current values
-
Align targets with realistic legal capacity
-
Use previous year data for context
-
Keep KPI definitions short and clear
-
Train users on navigation and interpretation
By following these practices, teams ensure accuracy and long-term usability.
How Can Organizations Customize This Dashboard?
One major strength of Excel dashboards lies in customization.
Customization Options
-
Add new KPIs easily
-
Modify KPI groups
-
Change targets annually
-
Adjust visuals and formatting
-
Extend data for multiple years
Therefore, the dashboard grows with the organization.
Who Should Use a Legal Advisory KPI Dashboard in Excel?
This dashboard fits multiple roles and industries.
Ideal Users
-
Legal Advisory Teams
-
Corporate Legal Departments
-
Law Firms
-
Compliance Officers
-
Risk Management Teams
-
General Counsels
-
Legal Operations Managers
Because of its flexible design, both small teams and large enterprises can use it effectively.
How Does This Dashboard Improve Legal Efficiency?
Click to Purchases Legal Advisory KPI Dashboard in Excel
Efficiency improves when teams track what truly matters.
Efficiency Gains Include
-
Faster identification of bottlenecks
-
Reduced manual reporting effort
-
Improved turnaround times
-
Better workload distribution
-
Stronger performance ownership
Thus, the dashboard supports continuous improvement.
Conclusion: Why Is a Legal Advisory KPI Dashboard in Excel a Must-Have?
A Legal Advisory KPI Dashboard in Excel transforms how legal teams measure, manage, and communicate performance. Instead of relying on fragmented data and manual reports, teams gain a centralized, interactive, and insight-driven solution.
With structured worksheets, automated calculations, trend analysis, and clear visual indicators, this dashboard empowers legal teams to operate strategically. Moreover, Excel’s flexibility ensures easy adoption and long-term scalability.
In short, this dashboard helps legal teams prove value, manage risk, and support smarter decisions—all from a single Excel file.
Frequently Asked Questions (FAQs)
What is a Legal Advisory KPI Dashboard in Excel used for?
A Legal Advisory KPI Dashboard in Excel tracks and analyzes legal performance metrics such as compliance, litigation outcomes, and turnaround times in one centralized file.
Can non-technical users operate this dashboard?
Yes, the dashboard uses Excel-native features, drop-downs, and buttons. Therefore, non-technical users can operate it easily.
Can I customize KPIs in the Legal Advisory KPI Dashboard?
Yes, you can add, remove, or modify KPIs by updating the KPI Definition Sheet and related input sheets.
How often should data be updated?
You should update actual and target data monthly to ensure accurate MTD and YTD analysis.
Does the dashboard support year-over-year comparison?
Yes, the Previous Year Numbers Sheet enables clear comparison with last year’s performance.
Is this dashboard suitable for law firms?
Absolutely. Law firms can track case efficiency, legal costs, success rates, and productivity using this dashboard.
Why use Excel instead of BI tools?
Excel offers flexibility, lower cost, ease of use, and faster customization without advanced technical skills.
Visit our YouTube channel to learn step-by-step video tutorials