In today’s fast-paced business environment, legal and compliance teams play a vital role in risk management, governance, and regulatory adherence. However, managing resources efficiently in these functions is not always straightforward. Teams must balance regulatory requirements, organizational policies, audits, and employee training while also making sure resources are used effectively.
This is where a Legal and Compliance Resource Allocation KPI Dashboard in Excel becomes a game-changer. By tracking the right Key Performance Indicators (KPIs), organizations can ensure that legal and compliance functions remain both effective and efficient.
This article will give you a detailed guide to the structure, features, benefits, and best practices of using this dashboard. Whether you are a compliance officer, legal manager, or operations executive, this tool can help you make smarter, data-driven decisions.
Click to Purchases Legal and Compliance Resource Allocation KPI Dashboard in Excel
What Is a Legal and Compliance Resource Allocation KPI Dashboard?
A Legal and Compliance Resource Allocation KPI Dashboard is a centralized tool built in Excel that allows organizations to track, monitor, and analyze compliance and legal performance metrics. It ensures resources like people, time, and budget are allocated wisely while keeping the organization aligned with internal and external regulations.
Instead of handling multiple spreadsheets or complex reports, the dashboard presents information in visual charts, cards, and tables that make analysis quicker and more accurate.
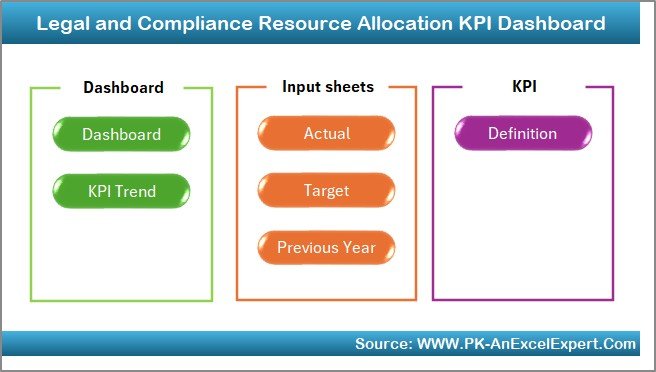
Structure of the Dashboard
This ready-to-use Excel template comes with seven interactive worksheet tabs, each serving a unique purpose:
Home Sheet
-
Functions as the index page.
-
Includes buttons for quick navigation to all other sheets.
-
Saves time and ensures smooth access to dashboard components.
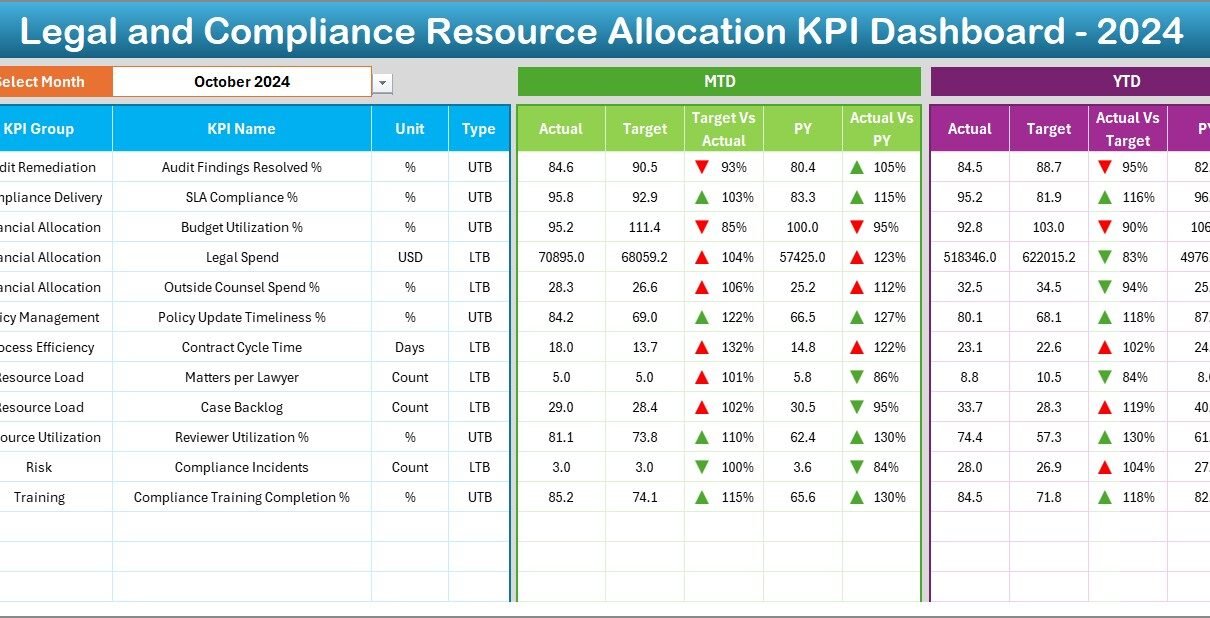
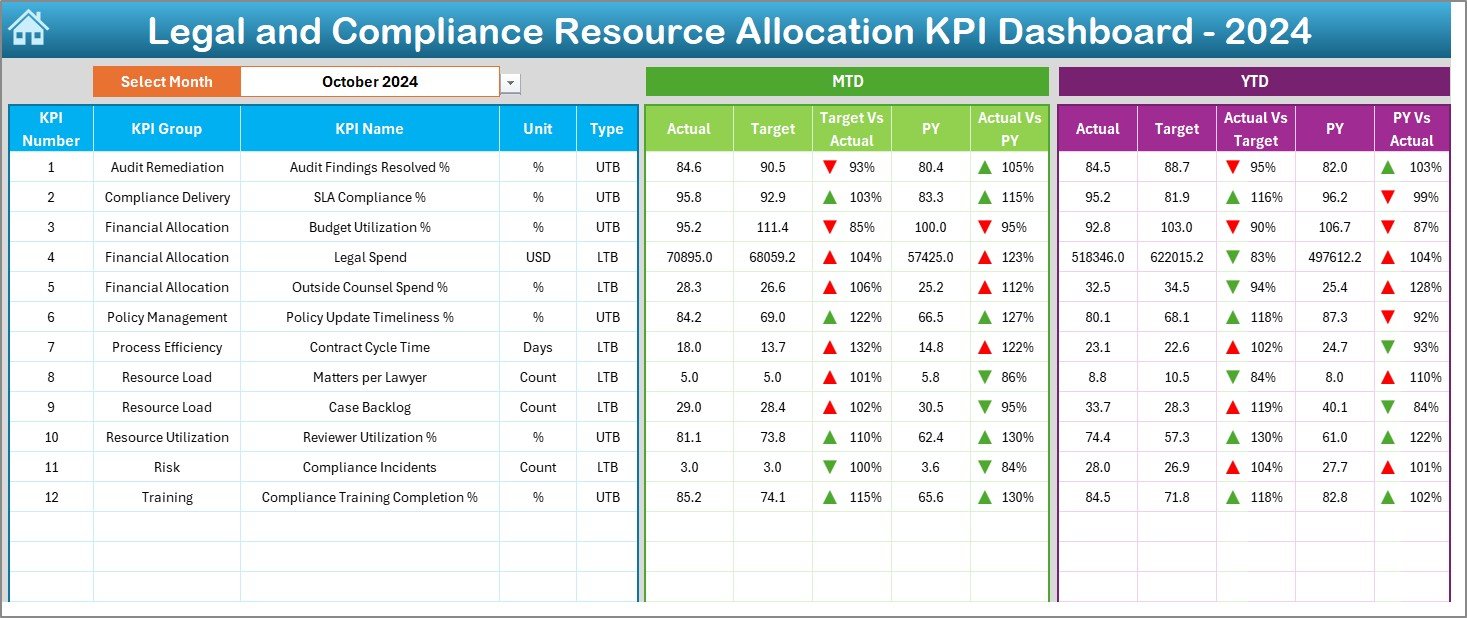
Dashboard Sheet
-
Acts as the main hub for monitoring KPIs.
-
On cell D3, users can select a month from a drop-down list, and all numbers update instantly.
Displays:
- MTD (Month-to-Date) metrics with Actual, Target, and Previous Year (PY) comparisons.
- YTD (Year-to-Date) metrics with Actual, Target, and PY comparisons.
-
Includes conditional formatting arrows (up/down) to show improvement or decline at a glance.
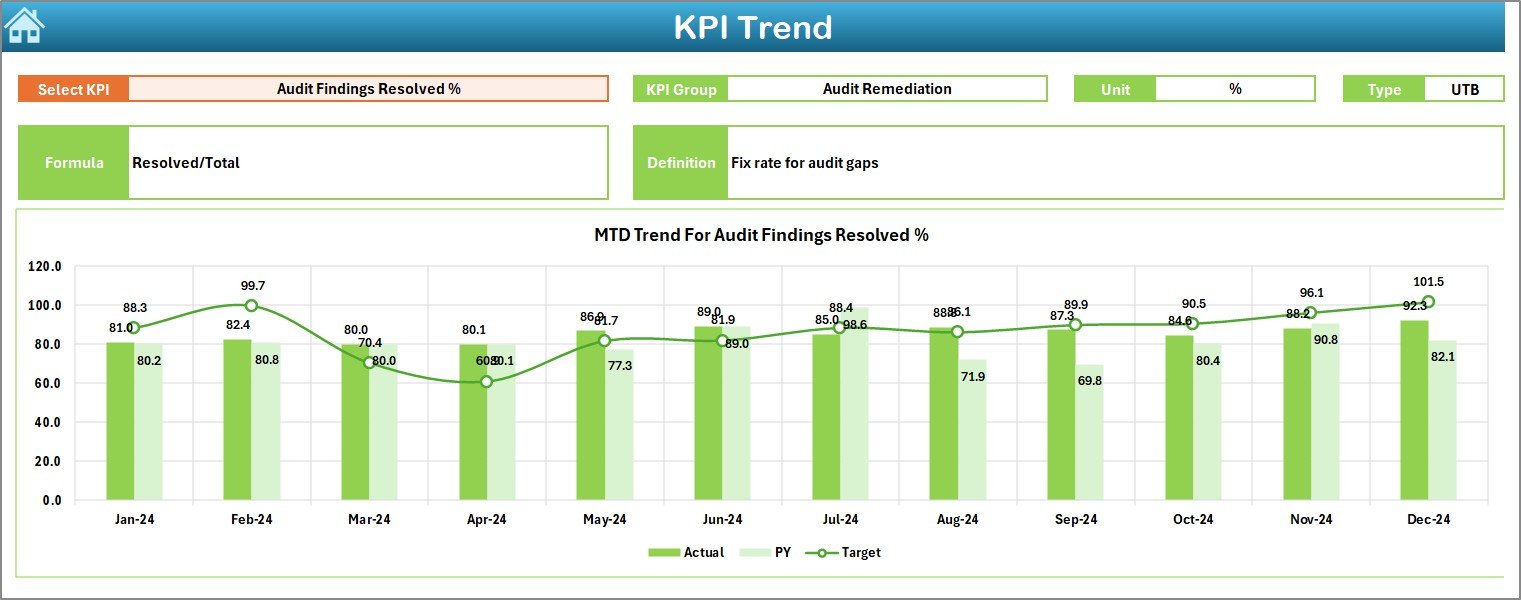
KPI Trend Sheet
-
Allows selection of a KPI from a drop-down at C3.
Displays:
- KPI details (Group, Unit, Formula, Type – LTB or UTB).
- Trend charts showing MTD and YTD movement across Actual, Target, and PY values.
-
Helps identify whether performance is improving, stable, or declining.
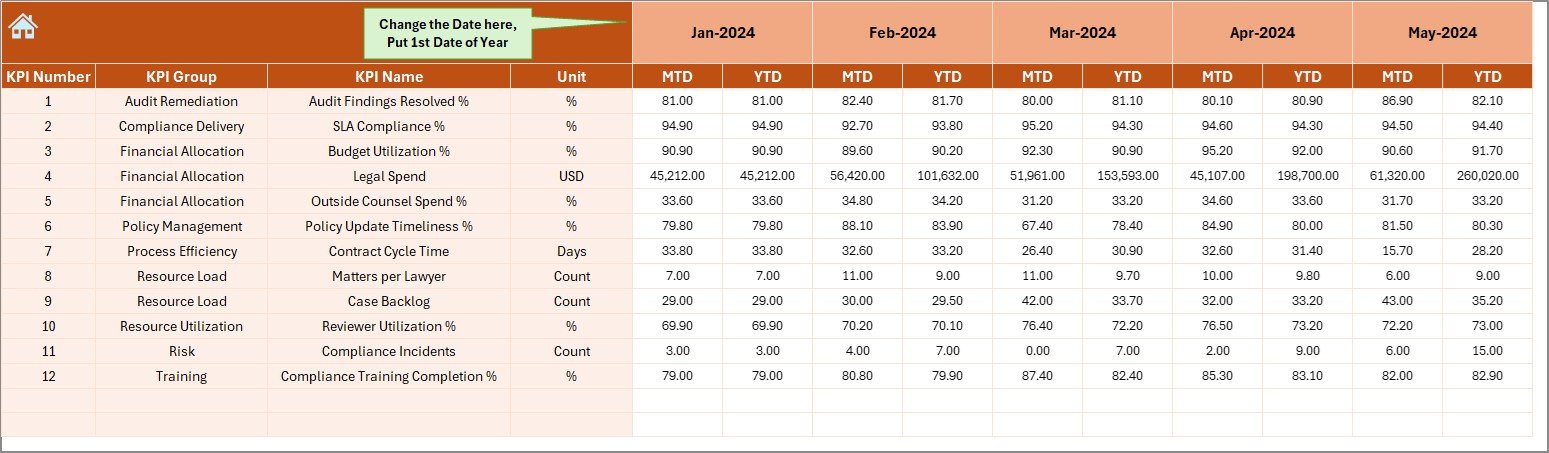
Actual Numbers Input Sheet
-
Designed for data entry of actual performance.
-
Users can set the start month at E1.
-
Input MTD and YTD data for every KPI.
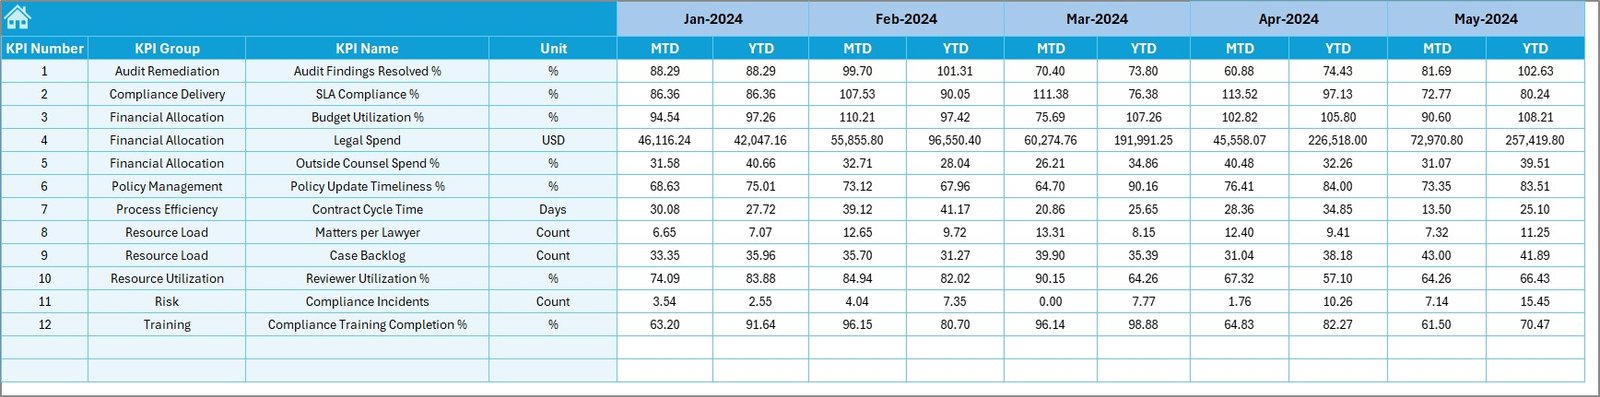
Target Sheet
-
Stores target numbers for all KPIs by month.
-
Captures both MTD and YTD targets for accurate monitoring.
Click to Purchases Legal and Compliance Resource Allocation KPI Dashboard in Excel
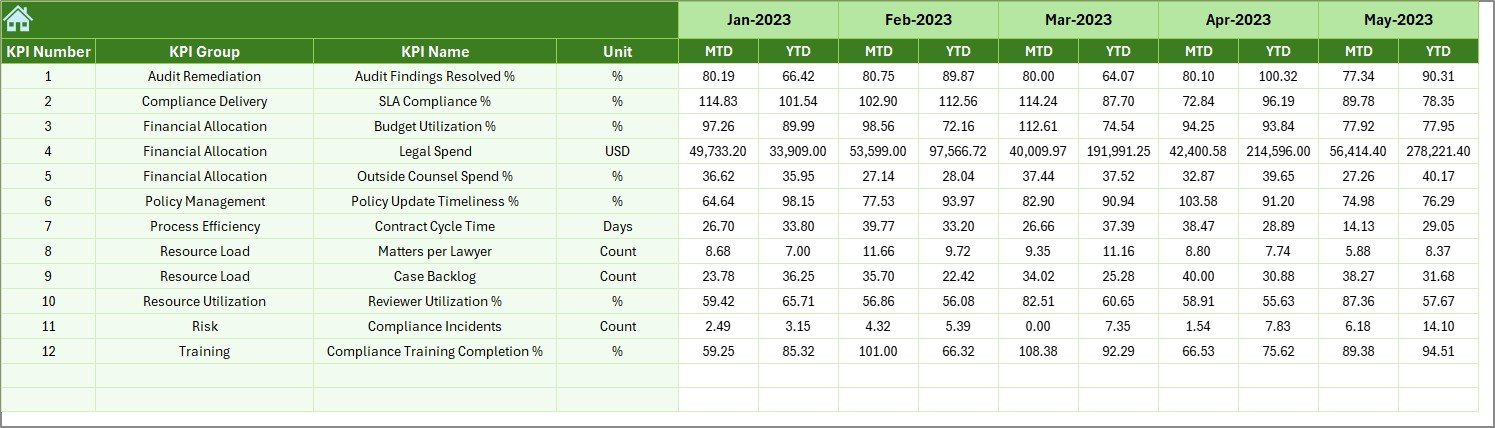
Previous Year Numbers Sheet
-
Keeps historical data from the prior year.
-
Ensures benchmarking and year-on-year analysis.
KPI Definition Sheet
-
Acts as the reference library.
-
Contains fields for KPI Name, KPI Group, Unit, Formula, and Definition.
-
Ensures clarity, standardization, and uniform interpretation of metrics.
Key Features of the Dashboard
-
Interactive navigation using buttons.
-
Dynamic month selection that updates entire dashboard.
-
Automated conditional formatting with arrows to track progress.
-
MTD and YTD analysis for better performance evaluation.
-
Side-by-side comparison of Actual, Target, and Previous Year.
-
Dedicated trend analysis for every KPI.
-
Customizable KPI library for different compliance needs.
-
Easy data entry through structured sheets for Actual, Target, and PY.
Why Does Legal and Compliance Resource Allocation Matter?
Legal and compliance functions are not only cost centers but also protect the business from regulatory penalties, lawsuits, and reputational damage. Poor resource allocation can result in:
-
Overburdened staff.
-
Delays in regulatory filings.
-
Missed deadlines for audits.
-
Higher compliance costs.
By implementing a dashboard like this, organizations can:
-
Balance workload across departments.
-
Reduce risks of non-compliance.
-
Improve transparency in legal operations.
-
Ensure accountability across stakeholders.
Advantages of Legal and Compliance Resource Allocation KPI Dashboard
✅ Centralized View: Combines all compliance KPIs in one place.
✅ Time Saving: Eliminates manual reporting.
✅ Better Decision-Making: Provides real-time insight into resource allocation.
✅ Risk Reduction: Identifies compliance gaps before they escalate.
✅ Improved Accountability: Assigns clear responsibility for each KPI.
✅ Year-on-Year Benchmarking: Compares performance with historical trends.
✅ Scalability: Can be tailored to specific legal or compliance needs.
How Does the Dashboard Help in Resource Allocation?
The dashboard ensures optimal use of manpower, time, and budget by:
-
Highlighting areas where resources are underutilized.
-
Pointing out KPIs that are consuming more time and cost than expected.
-
Enabling leaders to shift focus to critical compliance areas.
-
Supporting audit readiness by maintaining accurate, timely data.
Best Practices for Using the Dashboard
To maximize the benefits of the Legal and Compliance Resource Allocation KPI Dashboard, follow these practices:
-
Define clear KPIs: Use metrics that directly impact compliance health.
-
Update data regularly: Enter actuals monthly to maintain accuracy.
-
Set realistic targets: Ensure targets align with industry standards.
-
Use trend analysis: Focus not only on current results but also on direction.
-
Standardize KPI definitions: Keep a consistent formula and unit across periods.
-
Leverage conditional formatting: Use arrows, colors, and symbols to highlight performance.
-
Involve stakeholders: Ensure department heads review KPIs regularly.
-
Keep it simple: Avoid unnecessary complexity in formulas or charts.
Opportunities for Improvement
Although this dashboard is powerful, organizations can enhance it further by:
-
Integrating with automation tools to reduce manual input.
-
Adding real-time data feeds from compliance software.
-
Expanding KPI library to cover industry-specific regulations.
-
Incorporating predictive analytics for risk forecasting.
Conclusion
The Legal and Compliance Resource Allocation KPI Dashboard in Excel is more than just a reporting tool—it is a strategic enabler. By combining structured data entry, automated calculations, and visual dashboards, it gives compliance and legal teams the clarity they need to allocate resources wisely.
With this tool, organizations can save time, reduce risks, and improve efficiency, ensuring compliance remains a competitive strength rather than a burden.
Frequently Asked Questions (FAQs)
1. What is a Legal and Compliance Resource Allocation KPI Dashboard?
It is an Excel-based tool that helps monitor compliance KPIs, track trends, and manage resource allocation effectively.
2. Why should compliance teams use this dashboard?
It saves time, improves decision-making, ensures accountability, and helps avoid regulatory penalties by keeping performance on track.
3. Can I customize the KPIs in this dashboard?
Yes, the KPI Definition sheet allows you to add or modify KPIs based on your business needs.
4. How often should I update the dashboard?
Update it monthly to ensure accuracy for MTD and YTD analysis.
5. Is this dashboard suitable for small organizations?
Yes, it works for businesses of all sizes and can be scaled up as compliance requirements grow.
6. What skills are required to use this dashboard?
Basic Excel knowledge is enough, as the template comes pre-built with formulas and charts.
7. Can this dashboard replace compliance management software?
It cannot replace enterprise-level software but is an excellent cost-effective solution for small to medium organizations.
Visit our YouTube channel to learn step-by-step video tutorials
Click to Purchases Legal and Compliance Resource Allocation KPI Dashboard in Excel
Watch the step-by-step video tutorial:

