In today’s fast-changing business environment, legal and compliance training is no longer an option—it is a necessity. Every organization must track how effectively employees are trained on compliance standards, policies, and regulations. Without proper monitoring, risks such as fines, lawsuits, and reputation damage increase.
This is where a Legal and Compliance Training and Development KPI Dashboard in Excel becomes a powerful tool. It provides a structured way to monitor training performance, compliance levels, and policy awareness. With simple charts, slicers, and well-organized KPIs, managers can gain instant insights and make data-driven decisions.
This article will guide you through everything you need to know about this dashboard: its structure, features, advantages, best practices, and frequently asked questions.
Click to Purchases Legal and Compliance Training and Development KPI Dashboard in Excel
What Is a Legal and Compliance Training and Development KPI Dashboard?
A Legal and Compliance Training and Development KPI Dashboard in Excel is a ready-to-use template that helps organizations measure the effectiveness of their compliance programs. It consolidates multiple datasets into one interactive platform where managers can track Key Performance Indicators (KPIs), trends, and progress toward targets.
Instead of maintaining scattered spreadsheets or reports, this dashboard gives a single version of the truth. From completion rates to audit readiness, it brings clarity to compliance training performance.
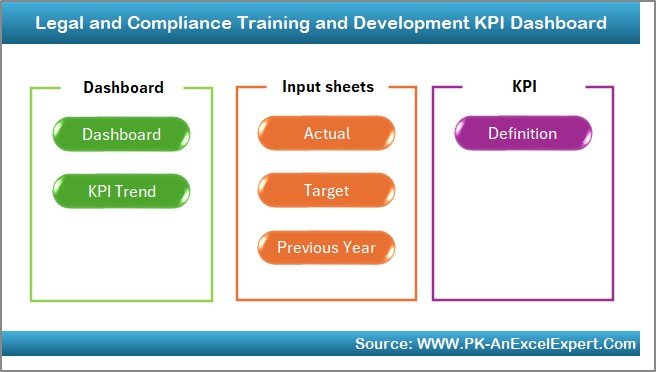
Key Features of the Dashboard
This Excel-based dashboard includes seven structured worksheets, each designed for a specific purpose. Let’s explore them in detail:
Home Sheet
-
Works as the index page.
-
Provides six navigation buttons that allow you to jump to different sections quickly.
-
Makes the dashboard user-friendly, even for those who are not Excel experts.
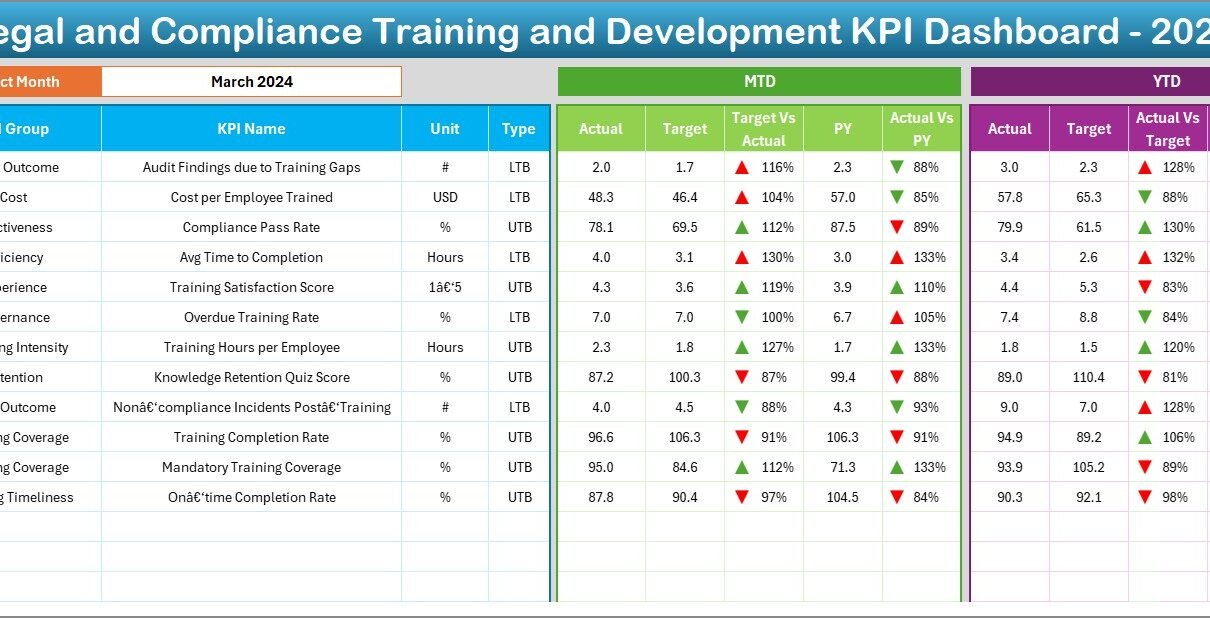
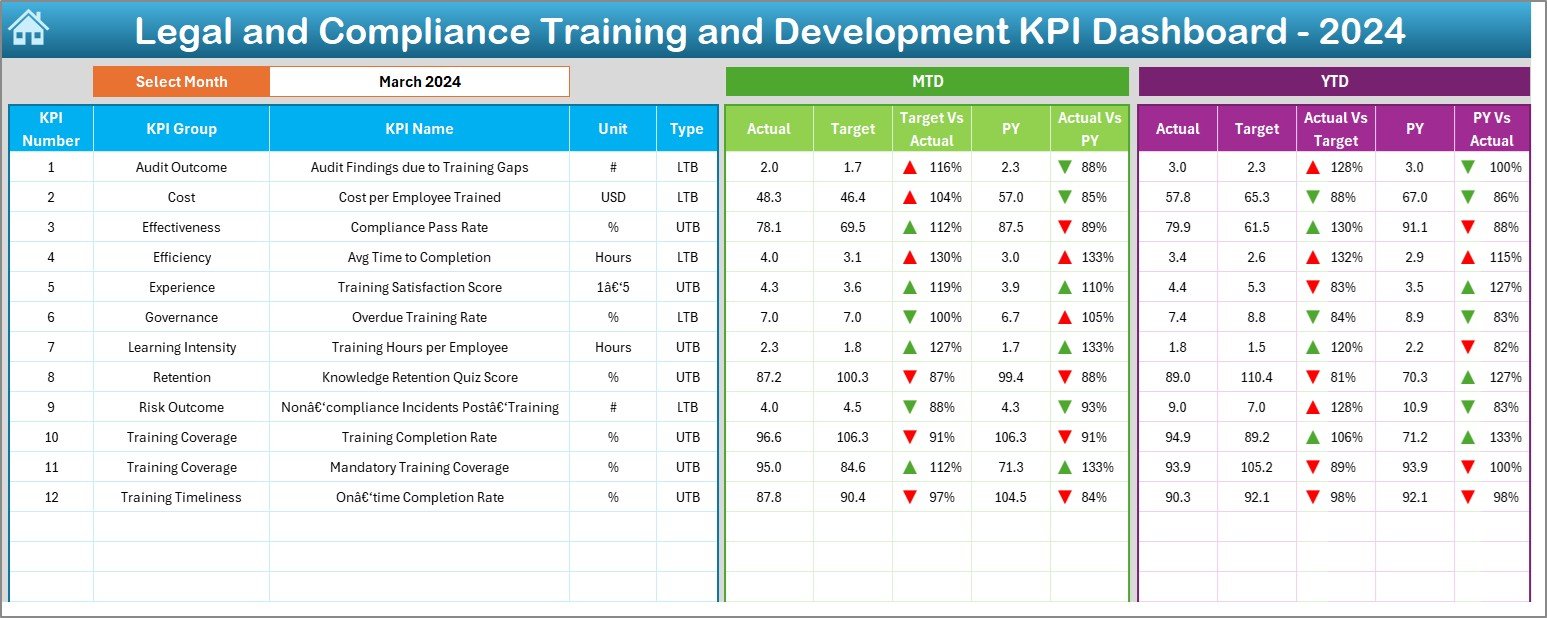
Dashboard Sheet
-
This is the main sheet and the heart of the dashboard.
-
It allows users to select a month from a drop-down in cell D3, making the dashboard fully dynamic.
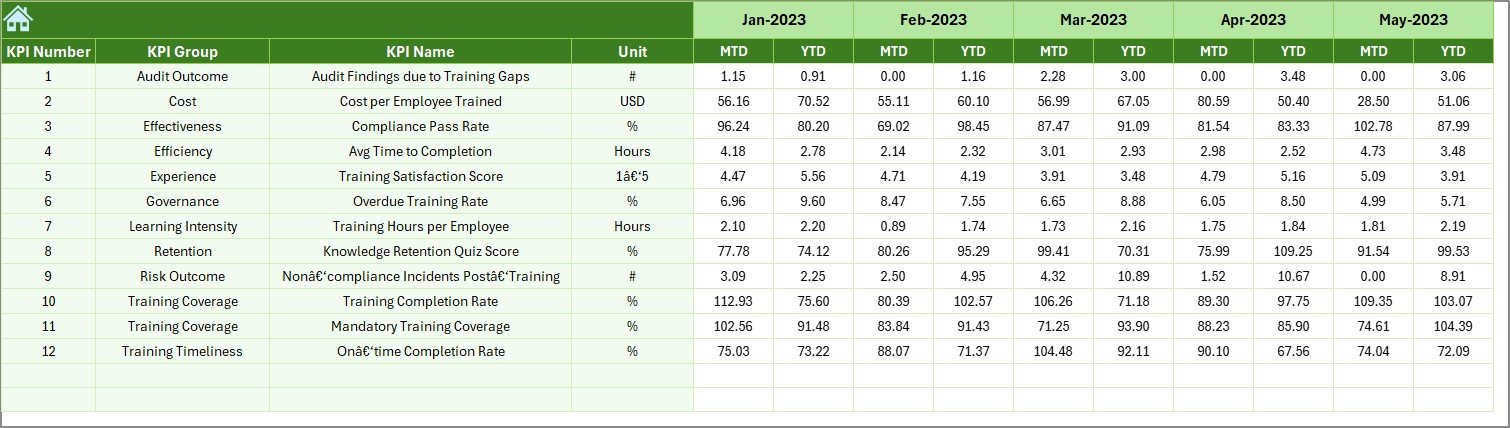
Displays:
- MTD (Month-to-Date) Actual vs Target vs Previous Year values.
- YTD (Year-to-Date) Actual vs Target vs Previous Year values.
- Variance indicators with conditional formatting arrows (green for improvement, red for decline).
-
Provides a quick executive summary of training and compliance KPIs.
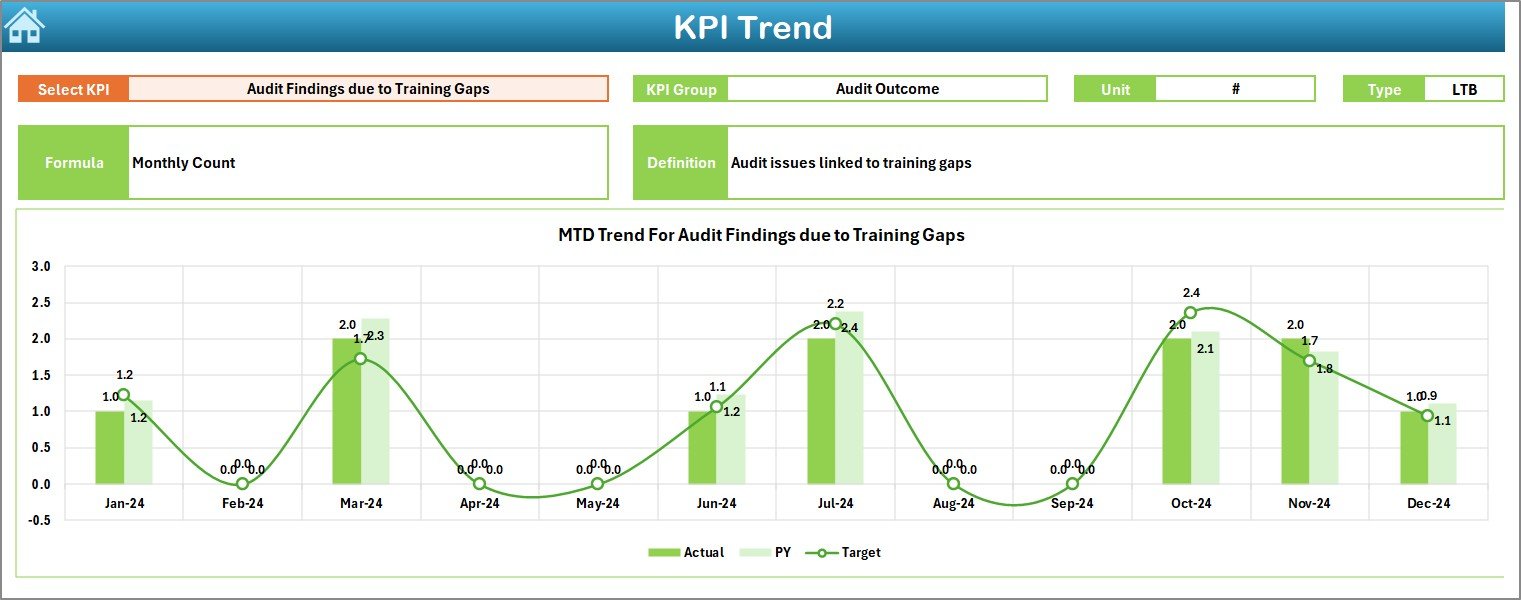
KPI Trend Sheet
-
Lets you choose a specific KPI using a drop-down filter in cell C3.
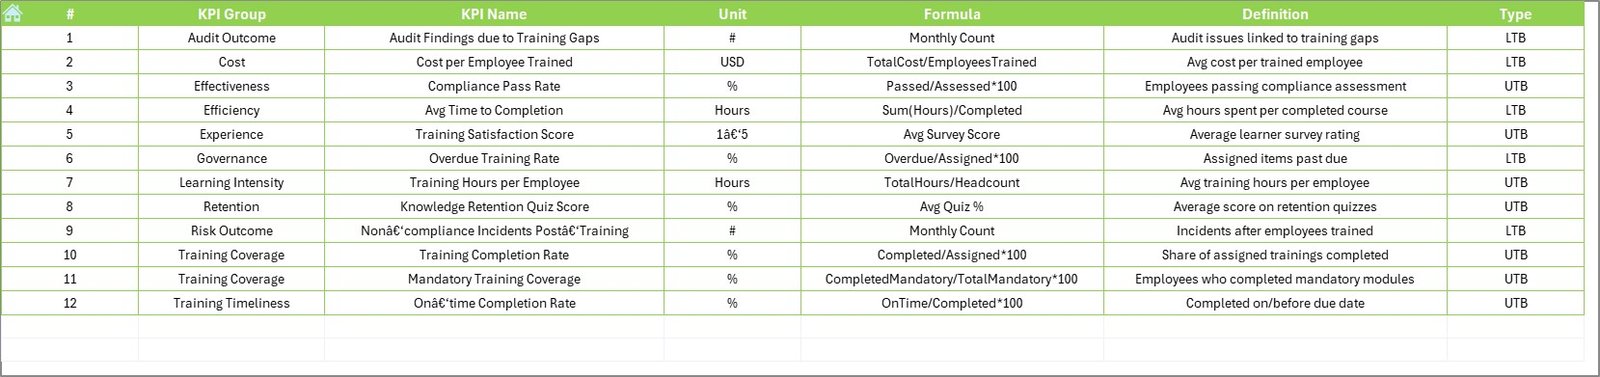
Shows KPI details such as:
- Group
- Unit
- Formula
- Definition
- Type (UTB: Upper the Better, or LTB: Lower the Better).
-
Displays MTD and YTD trend charts, making it easy to analyze performance over time.
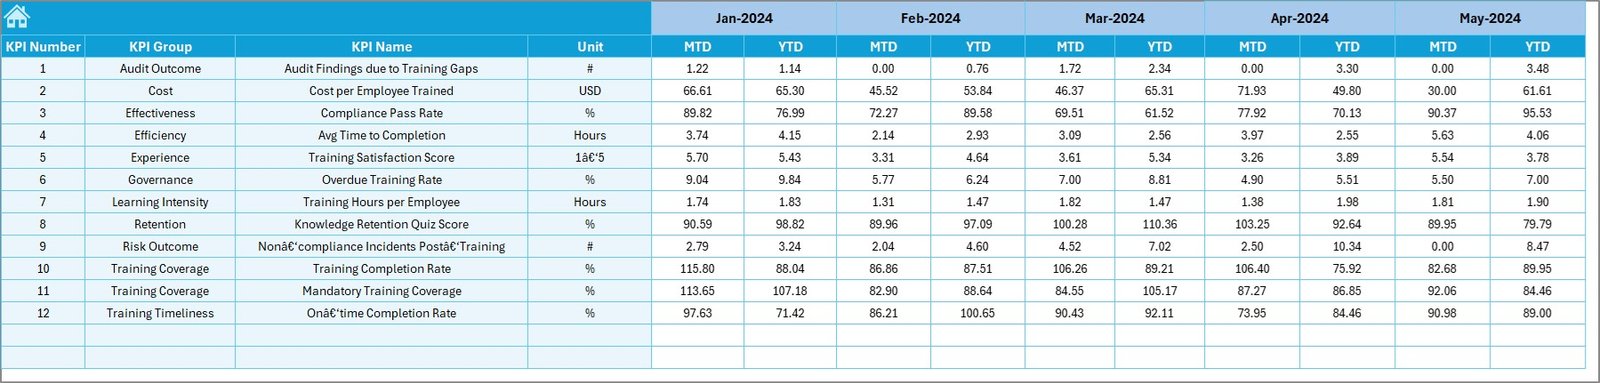
Actual Numbers Input Sheet

-
This is the data entry area for actual performance.
-
You can set the first month of the year in cell E1, and the sheet automatically aligns other months.
-
Supports both MTD and YTD inputs for training data.
Target Sheet
-
Designed for entering target values for each KPI.
-
Accepts both MTD and YTD targets.
-
Ensures clear goal-setting for compliance and training teams.
Previous Year Numbers Sheet
-
Stores historical data for benchmarking.
-
Helps compare current performance against previous year’s results.
-
Encourages year-over-year improvement in compliance metrics.
KPI Definition Sheet
-
Serves as the reference library of KPIs.
-
Includes: KPI Name, Group, Unit, Formula, and Definition.
-
Provides a transparent understanding of how each metric is measured.
Why Is This Dashboard Important?
Click to Purchases Legal and Compliance Training and Development KPI Dashboard in Excel
Monitoring compliance training is often challenging. With multiple employees, departments, and policies, it becomes difficult to maintain clarity. The dashboard solves this by:
-
Centralizing information in one place.
-
Automating reporting with formulas and charts.
-
Ensuring accountability by assigning clear KPI ownership.
-
Highlighting trends and risks before they escalate.
Advantages of Legal and Compliance Training and Development KPI Dashboard
Here are some of the most notable benefits of using this dashboard:
📊 Real-Time Insights – Provides up-to-date information with just one click.
✅ Improved Accountability – Ensures every department meets compliance standards.
🕒 Time-Saving – Reduces manual reporting efforts.
🔍 Enhanced Transparency – Makes KPI definitions and formulas visible to all.
⚖️ Risk Reduction – Helps identify areas where compliance gaps exist.
📈 Performance Tracking – Tracks completion rates, training hours, and audit readiness.
💡 Data-Driven Decisions – Empowers leaders to act based on facts, not assumptions.
Opportunities for Improvement
While this dashboard is powerful, organizations can enhance it further by:
🌐 Integrating with Learning Management Systems (LMS) to auto-pull training data.
🔔 Adding Alerts for overdue training or compliance failures.
📑 Including Department-Level Drilldowns for detailed analysis.
📲 Making It Mobile-Friendly so managers can track compliance anytime.
🧾 Expanding KPI Coverage to include legal dispute resolution time or external audit results.
Best Practices for Using the Legal and Compliance Training Dashboard
To get the most value, organizations should follow these best practices:
-
Keep Data Updated – Enter actuals and targets regularly.
-
Use Clear KPI Definitions – Avoid ambiguity in formulas and metrics.
-
Review Monthly Trends – Focus on both MTD and YTD insights.
-
Encourage Department Ownership – Assign KPIs to responsible teams.
-
Automate Where Possible – Use macros or formulas to reduce manual input.
-
Benchmark Performance – Compare against previous year’s results.
-
Focus on Actionable Metrics – Avoid too many KPIs; track only those that drive compliance.
Conclusion
The Legal and Compliance Training and Development KPI Dashboard in Excel is a game-changer for organizations that want to strengthen their compliance culture. With structured worksheets, interactive charts, and well-defined KPIs, it makes monitoring easy and effective.
By implementing this dashboard, organizations not only ensure regulatory adherence but also create a culture of accountability and transparency. Compliance training becomes measurable, actionable, and aligned with organizational goals.
Frequently Asked Questions (FAQs)
1. What is the purpose of this KPI dashboard?
The dashboard tracks legal and compliance training KPIs such as completion rates, audit readiness, and policy awareness to ensure compliance with regulations.
2. Who can use this dashboard?
It is designed for compliance officers, HR managers, training teams, and executives who need insights into compliance training performance.
3. Can I customize the KPIs?
Yes. The KPI Definition sheet allows you to add, edit, or modify KPIs to suit your organizational needs.
4. Does this dashboard require advanced Excel skills?
No. The dashboard is user-friendly and relies on drop-downs, charts, and formulas. Basic Excel knowledge is enough to use it.
5. How often should I update the data?
Ideally, you should update the actual numbers monthly to ensure accurate MTD and YTD reporting.
6. Can it be integrated with other systems?
Yes, with some modifications, it can integrate with Learning Management Systems or HR software to automate data input.
7. What makes this dashboard different from regular reports?
Unlike static reports, the dashboard is interactive, dynamic, and allows monthly trend analysis with instant visual insights.
Visit our YouTube channel to learn step-by-step video tutorials