Managing a loan portfolio becomes harder every year. Competition rises, credit risk changes fast, customers expect quick decisions, and leadership demands accurate performance insights. Because of these challenges, financial institutions need a simple way to monitor KPIs, track monthly trends, analyze risk, and identify opportunities for improvement.
A Loan Portfolio KPI Dashboard in Power BI solves all these problems. It collects raw data from Excel, transforms it into powerful visuals, and presents clear insights that everyone can understand. Banks, NBFCs, microfinance institutions, fintech lenders, and credit departments use these dashboards to improve decisions and strengthen portfolio health.
In this detailed guide, you will learn what a Loan Portfolio KPI Dashboard is, how it works, what each dashboard page includes, and why every lending team should use it right away. You will also explore advantages, best practices, and practical examples that help you build and maintain a high-performing loan portfolio.
Click to Purchases Loan Portfolio KPI Dashboard in Power BI
Let’s begin.
What Is a Loan Portfolio KPI Dashboard in Power BI?
A Loan Portfolio KPI Dashboard in Power BI is a ready-to-use reporting tool that shows loan performance, risk metrics, customer behavior, and operational efficiency in one place. It uses data from an Excel file and converts it into dynamic visuals, KPIs, charts, and comparisons.
You only refresh the data file and select the month you want to analyze. The dashboard updates instantly and shows insights like:
-
Total loans
-
Portfolio outstanding
-
Collection efficiency
-
NPA/NPL ratios
-
Write-offs
-
Segment-wise performance
-
Branch/regional comparisons
-
Monthly and yearly trends
Because of this automated workflow, credit managers, risk analysts, and business heads make faster and smarter decisions.
Why Do Lending Teams Need a Loan Portfolio Dashboard?
Loan portfolios grow fast, and so do the challenges. Teams face issues like incomplete data, scattered reports, delayed insights, and manual spreadsheets. These problems increase credit risk and slow down performance tracking.
A Power BI dashboard removes these problems because it:
-
Shows real-time KPIs
-
Highlights variances immediately
-
Helps compare Actual vs Target
-
Identifies risky trends early
-
Saves hours of manual reporting
-
Supports accurate forecasting
-
Helps leadership make decisions faster
When everyone sees the same numbers in one dashboard, teamwork improves and decisions become consistent.
Key Features of the Loan Portfolio KPI Dashboard in Power BI
This dashboard includes three important pages in the Power BI file. Each page shows different types of information that help users analyze performance from every angle.
Let’s explore each page in detail.
1. Summary Page – The Main Performance Snapshot
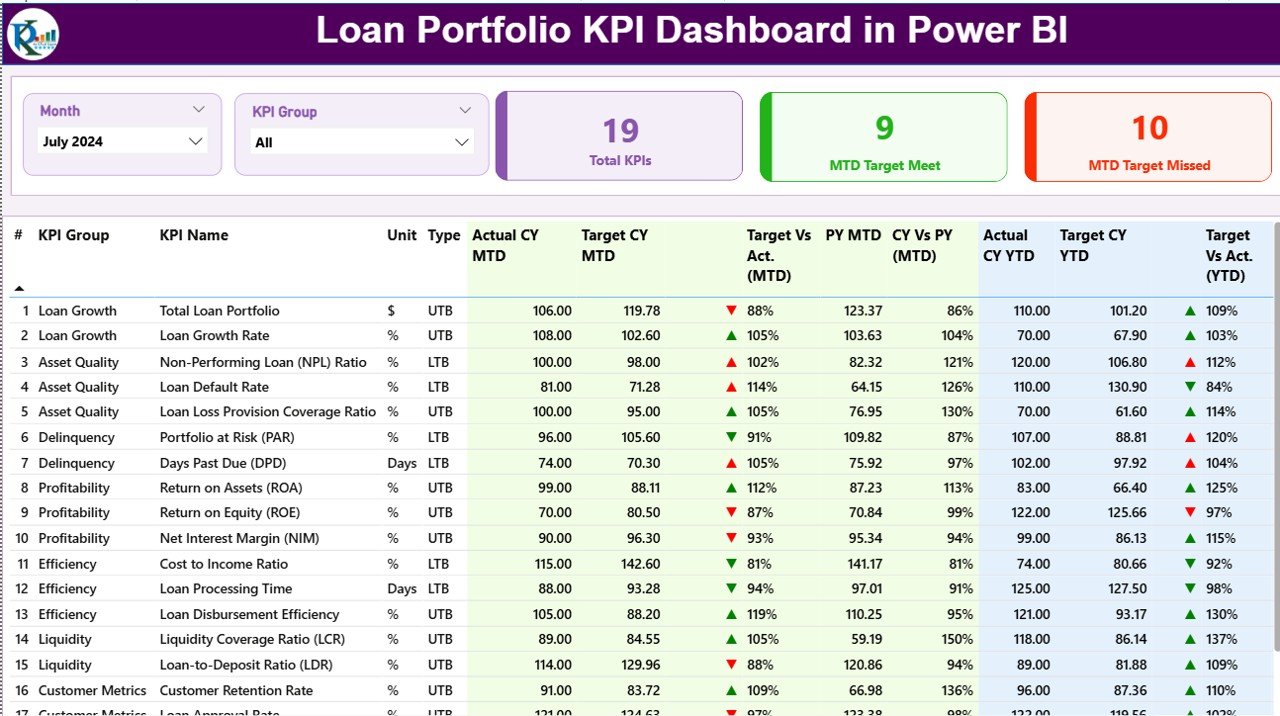
The Summary Page acts as the first view for users. It gives a high-level overview of every KPI and helps you understand the overall loan portfolio health.
What You See on the Summary Page
✔ Month Slicer – You select any month to update all visuals instantly.
✔ KPI Group Slicer – You choose specific categories such as Risk KPIs, Operations KPIs, or Portfolio KPIs.
✔ Three High-Level Cards
-
Total KPIs count
-
MTD Target Met
-
MTD Target Missed
These cards help you understand immediate performance in less than five seconds.
Detailed KPI Table
Below the cards, the dashboard displays a dynamic table. It includes:
-
KPI Number – Sequence number
-
KPI Group – Category (Risk, Collection, Portfolio Quality, etc.)
-
KPI Name – KPI description
-
Unit – % , Amount, Count, Ratio
-
Type (LTB/UTB) – Lower the Better or Upper the Better
The table also contains the following fields for MTD and YTD:
Month-to-Date (MTD) Metrics
-
Actual CY MTD – Current Month Actual Value
-
Target CY MTD – Monthly Target Value
-
MTD Icon – ▲ or ▼ with green or red color depending on performance
-
Target vs Actual (MTD) – Actual ÷ Target
-
Previous Year (PY MTD) – Same period last year
-
CY vs PY (MTD) – Current MTD ÷ Previous Year MTD
Year-to-Date (YTD) Metrics
-
Actual CY YTD – Current Year Actual
-
Target CY YTD – Yearly Target
-
YTD Icon – ▲ or ▼ based on performance
-
Target vs Actual (YTD) – Actual ÷ Target
-
Previous Year (PY YTD) – YTD last year
-
CY vs PY (YTD) – Current YTD ÷ Previous Year YTD
These fields help the user understand performance at an extremely detailed level. You see where the team meets targets, misses targets, improves over last year, or faces challenges.
2. KPI Trend Page – Understand the Movement Behind the Numbers
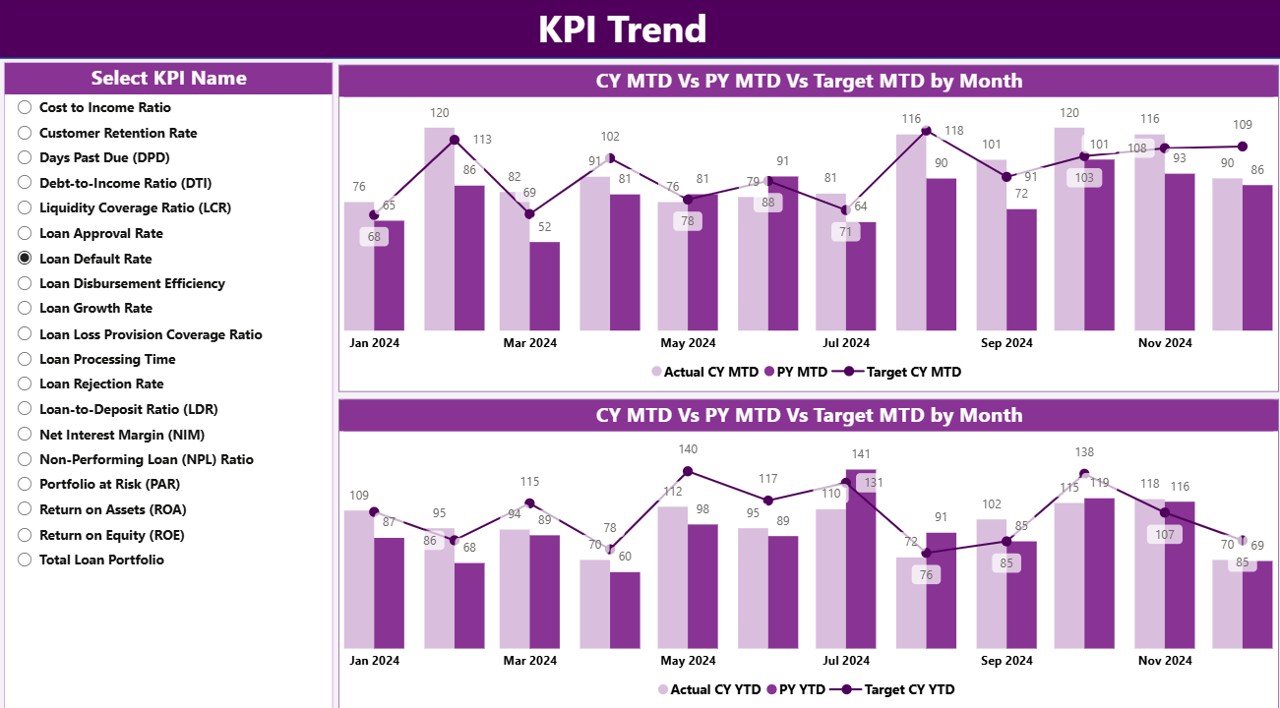
The KPI Trend Page helps you track patterns and understand what drives changes. Users view trends for both MTD and YTD metrics.
Key elements of the Trend Page
✔ Two Combo Charts
Each chart displays:
-
Actual Current Year
-
Actual Previous Year
-
Monthly or Yearly Target
✔ KPI Name Slicer
You select any KPI from the slicer on the left to see its full trend.
These visuals show performance direction, growth patterns, risk movement, and improvement opportunities. Trend analysis helps leadership make better forecasting and strategy decisions.
Click to Purchases Loan Portfolio KPI Dashboard in Power BI
3. KPI Definition Page – Clear Understanding of Each KPI
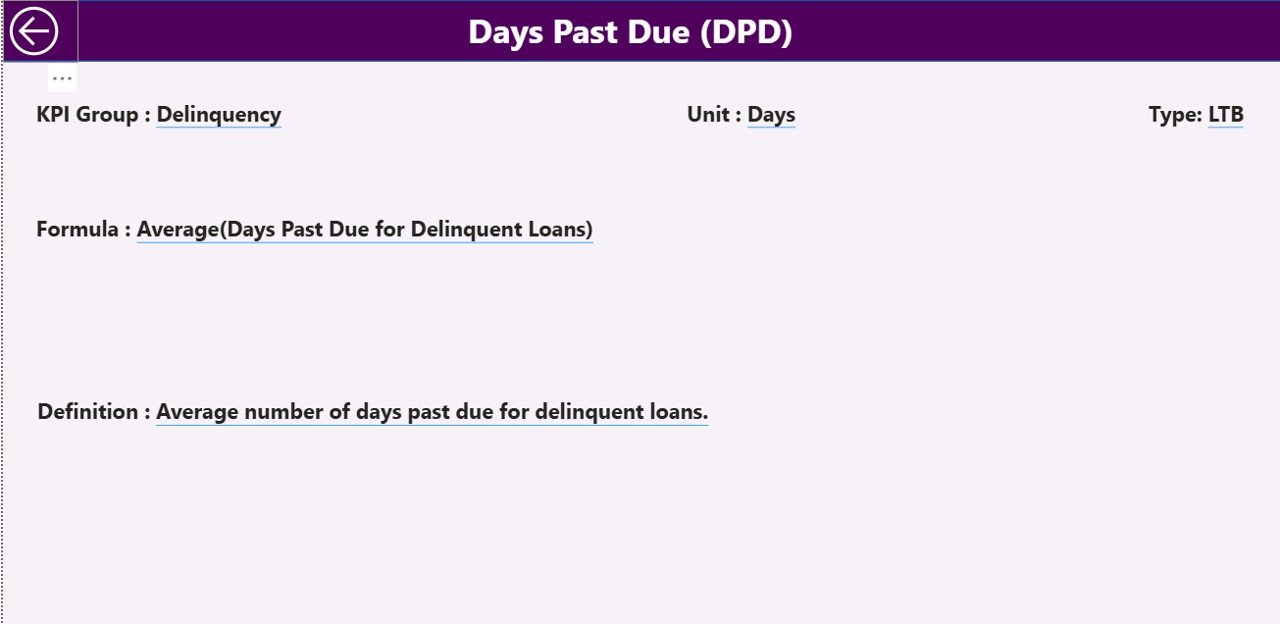
This page stays hidden because it works as a drill-through page. When you click any KPI on the Summary Page, you open this drill-through window.
This page includes information like:
-
KPI Name
-
KPI Formula
-
KPI Definition
-
Unit
-
Type (LTB/UTB)
Every user understands exactly how a KPI works, which reduces confusion during review meetings.
A back button on the top-left corner sends you back to the main page instantly.
Excel Data Structure for the Dashboard
The dashboard uses three Excel worksheets as the data source. You only update the Excel file, and Power BI refreshes the dashboard automatically.
1. Input_Actual Sheet
You record:
-
KPI Name
-
Month (use the first day of each month, e.g., 01-Jan-2024)
-
MTD Actual Numbers
-
YTD Actual Numbers
This sheet contains the real performance values.
2. Input_Target Sheet
You record:
-
KPI Name
-
Month
-
MTD Target Numbers
-
YTD Target Numbers
These numbers help the dashboard calculate performance gaps.
3. KPI Definition Sheet
This sheet contains:
-
KPI Number
-
KPI Group
-
KPI Name
-
Unit
-
Formula
-
Definition
-
Type (Lower the Better or Upper the Better)
This structured format brings clarity to every KPI you track.
What KPIs Can You Track in a Loan Portfolio Dashboard?
You can track hundreds of KPIs depending on your organization. Here are some common and important ones.
Portfolio Quality
-
NPA/NPL %
-
Write-off %
-
Overdue Amount
-
Portfolio at Risk (PAR)
-
Recovery %
Collection Performance
-
Collection Efficiency Ratio
-
Bounce Rate
-
Delinquency Rate
-
Roll-forward Analysis
Disbursement Performance
-
New Loan Disbursement
-
Loan Count by Product
-
Average Loan Size
Customer Metrics
-
Active Borrowers
-
Repeat Borrowers
-
Customer Retention Rate
Operational KPIs
-
Turnaround Time (TAT)
-
Loan Approval Rate
-
Productivity per Employee
These KPIs help credit and risk teams understand performance from every angle.
Advantages of a Loan Portfolio KPI Dashboard in Power BI
Click to Purchases Loan Portfolio KPI Dashboard in Power BI
A dashboard offers many benefits that transform the way financial institutions monitor loan performance.
1. Faster and Better Decisions
You see all KPIs in one place, so you understand the situation instantly. This improves decision quality and reduces response time.
2. Clear Visibility of Portfolio Health
The dashboard shows early warning signals such as rising NPAs or falling collection efficiency. Teams act quickly before problems grow.
3. Automated Reporting Saves Time
Manual reporting takes hours. Power BI refreshes numbers automatically, saving time for analysis and decision-making.
4. Transparent Performance Monitoring
Management, teams, and departments see the same KPIs, targets, and comparisons. This transparency increases accountability.
5. Strong Forecasting Capability
MTD and YTD views along with historical trends help you predict future performance and plan strategies confidently.
Best Practices for Using a Loan Portfolio KPI Dashboard
To get the highest value from your dashboard, follow these best practices.
1. Maintain Clean and Structured Data
Correct month entries, accurate numbers, and consistent KPI names help the dashboard run smoothly.
2. Update Actuals and Targets Regularly
Refresh your Excel file every month and review targets according to business priorities.
3. Review Both MTD and YTD Numbers
MTD helps you understand monthly performance.
YTD helps you track annual progress.
Both are important for complete analysis.
4. Use the KPI Definition Page Before Reviews
Share KPI meaning and formulas with your team to avoid confusion during meetings.
5. Analyze Trends, Not Just Numbers
Monthly variations help you understand what drives success or creates challenges.
6. Encourage Every Unit to Use the Dashboard
Operations, credit, risk, and finance teams should use the same dashboard for clarity and consistency.
Conclusion
A Loan Portfolio KPI Dashboard in Power BI brings everything you need into a single, user-friendly system. It eliminates manual reporting, improves accuracy, and offers real-time insights for better decisions. When your loan portfolio grows, you need consistent performance monitoring—and this dashboard gives you a complete view of portfolio health, KPIs, targets, and trends.
When you use the dashboard regularly, you increase efficiency, strengthen credit quality, and guide your organization toward sustainable growth.
Frequently Asked Questions (FAQs)
1. What is a Loan Portfolio KPI Dashboard?
It is a Power BI dashboard that tracks loan performance, credit risk, collections, disbursements, and operational metrics using automated visuals.
2. Who should use this dashboard?
Credit managers, risk analysts, branch managers, finance teams, NBFC leaders, and banks use this dashboard to monitor and improve portfolio performance.
3. Can I add more KPIs to this dashboard?
Yes. You can update the KPI Definition sheet and add new Actual and Target numbers in the Excel file.
4. Does the dashboard refresh automatically?
Yes. Once you connect Power BI to your Excel file, it refreshes with one click.
5. Why do we track both MTD and YTD metrics?
MTD shows short-term performance.
YTD shows long-term progress.
Both help you understand the full picture.
6. Can beginners use this dashboard?
Yes. The dashboard uses simple visuals and slicers, so even non-technical users understand the insights easily.
7. Does this dashboard support drill-through?
Yes. You can drill through from the Summary Page to the KPI Definition Page for deeper understanding.
Visit our YouTube channel to learn step-by-step video tutorials