Running a machine learning lab means managing data experiments, models, infrastructure, costs, timelines, and research outcomes—all at the same time. However, when KPIs remain scattered across spreadsheets, tracking performance becomes slow and confusing. That is exactly where a Machine Learning Labs KPI Dashboard in Excel becomes a powerful solution.
In this in-depth guide, you will learn what a Machine Learning Labs KPI Dashboard in Excel is, how it works, its worksheet structure, advantages, best practices, and frequently asked questions. Moreover, you will clearly understand why Excel remains one of the most reliable tools for KPI tracking in machine learning environments.
What Is a Machine Learning Labs KPI Dashboard in Excel?
Click to Purchases Machine Learning Labs KPI Dashboard in Excel
A Machine Learning Labs KPI Dashboard in Excel is a centralized performance-tracking tool designed to monitor, analyze, and visualize key metrics related to machine learning research, development, and experimentation.
Instead of checking multiple files, notebooks, and reports, this dashboard brings all KPIs into one structured, interactive Excel file. As a result, lab managers, data scientists, and leadership teams gain instant visibility into performance.
Why Excel for Machine Learning KPI Tracking?
Although advanced BI tools exist, Excel remains popular because:
-
It offers flexibility and customization
-
It supports MTD (Month-to-Date) and YTD (Year-to-Date) analysis
-
It works without coding or technical dependency
-
It integrates easily with lab data sources
Therefore, Excel becomes a practical choice for both technical and non-technical stakeholders.
Why Do Machine Learning Labs Need KPI Dashboards?
Machine learning labs operate in a data-intensive and result-driven environment. Without KPIs, teams struggle to measure progress and efficiency.
Common Challenges Without a KPI Dashboard
-
Scattered data across files
-
No clear view of targets vs actuals
-
Manual reporting errors
-
Limited historical comparisons
-
Delayed decision-making
However, a KPI dashboard solves these problems by providing real-time insights, trend analysis, and clear performance benchmarks.
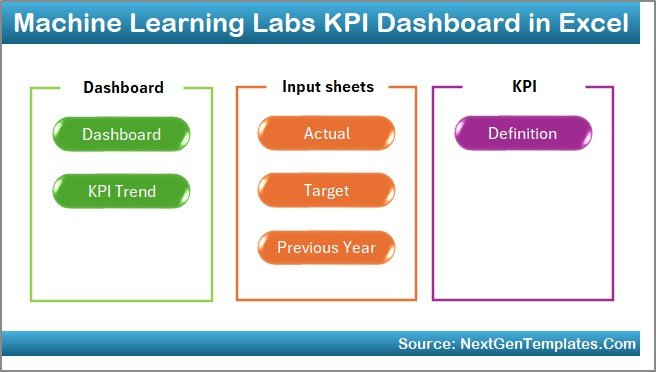
Overview of the Machine Learning Labs KPI Dashboard in Excel
This ready-to-use Excel template has been designed specifically for machine learning labs. It follows a structured worksheet-based approach that separates data input, definitions, and visualization.
Total Worksheets: 7
Each worksheet plays a specific role, ensuring clarity, scalability, and ease of use.
1. Home Sheet: The Navigation Center
The Home sheet works as an index page for the entire dashboard.
Key Features of the Home Sheet
-
Acts as a central navigation hub
-
Contains 6 clickable buttons
-
Allows instant movement to specific sheets
-
Eliminates manual scrolling and confusion
Because of this structure, users move between sheets smoothly and save time.
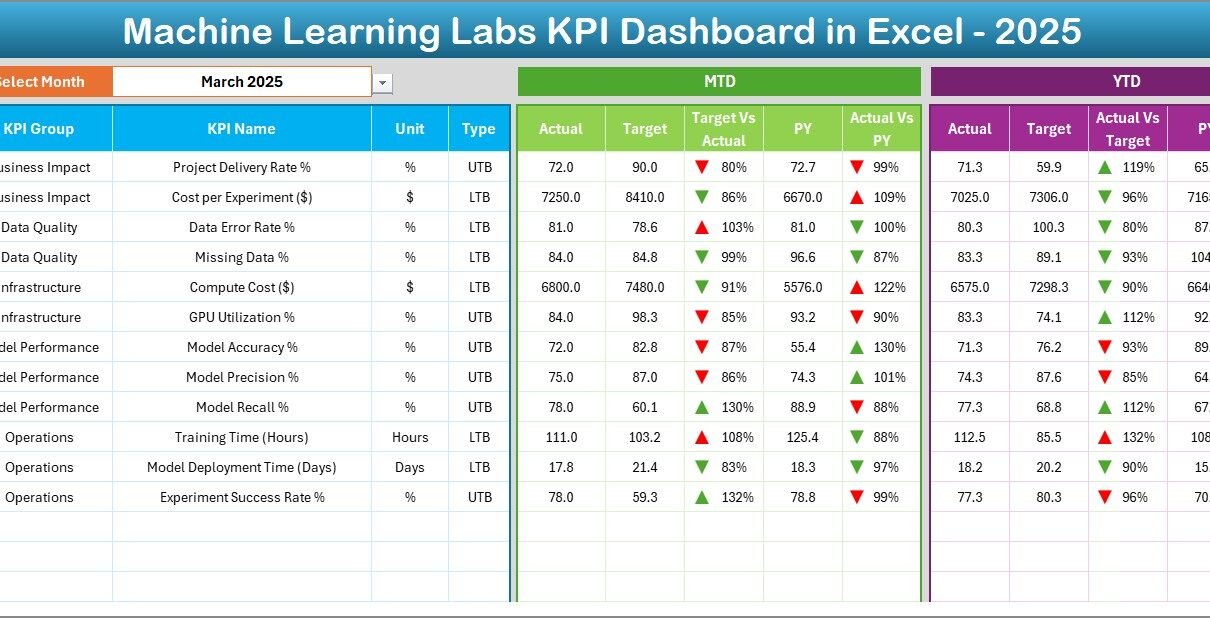
2. Dashboard Sheet: The Main KPI Overview
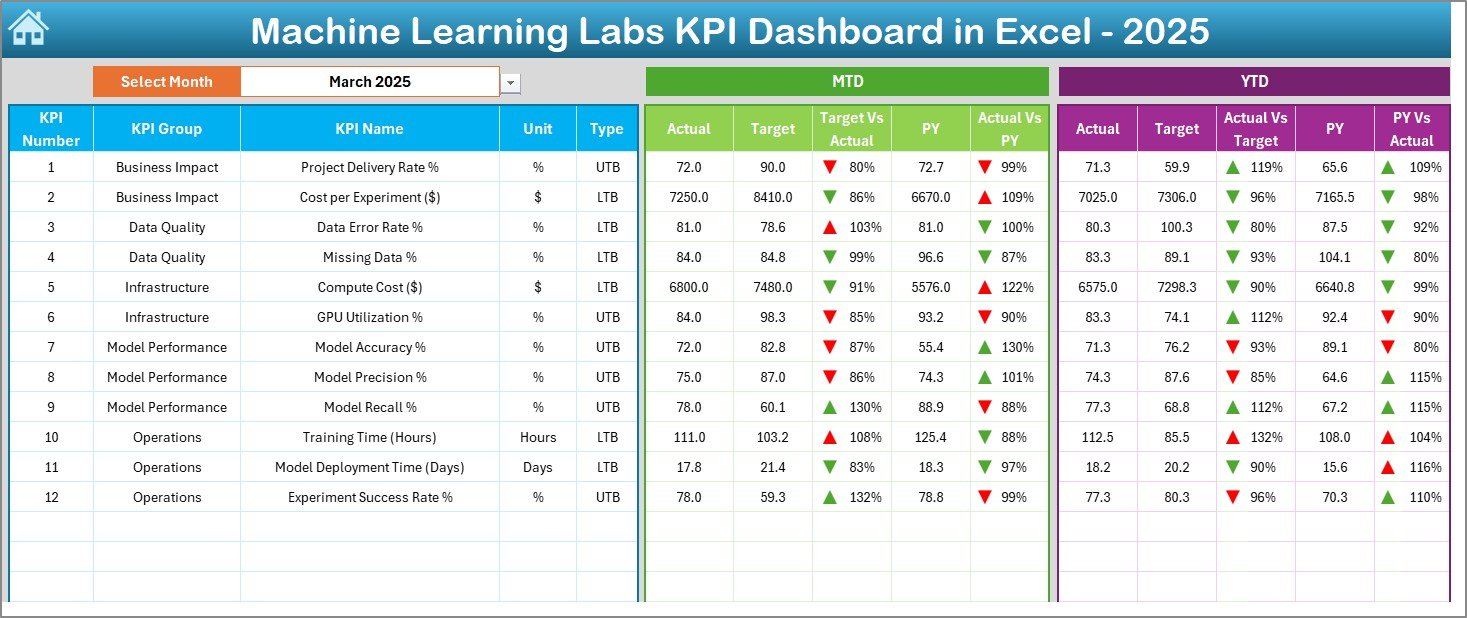
The Dashboard sheet is the heart of the Machine Learning Labs KPI Dashboard in Excel.
How Does the Dashboard Sheet Work?
On cell D3, users select the Month from a drop-down list. Once selected:
-
All KPI values update automatically
-
Charts and indicators refresh instantly
-
MTD and YTD values adjust dynamically
KPIs Displayed on the Dashboard
The dashboard displays:
-
MTD Actual
-
MTD Target
-
MTD Previous Year
-
Target vs Actual comparison
-
Previous Year vs Actual comparison
Additionally, it shows:
-
YTD Actual
-
YTD Target
-
YTD Previous Year
-
Variance indicators for YTD metrics
Conditional Formatting for Better Insights
To make performance tracking intuitive, the dashboard uses:
-
🔼 Up arrows for positive trends
-
🔽 Down arrows for negative trends
Because of this visual approach, users instantly identify areas that need attention.
3. KPI Trend Sheet: Deep Performance Analysis
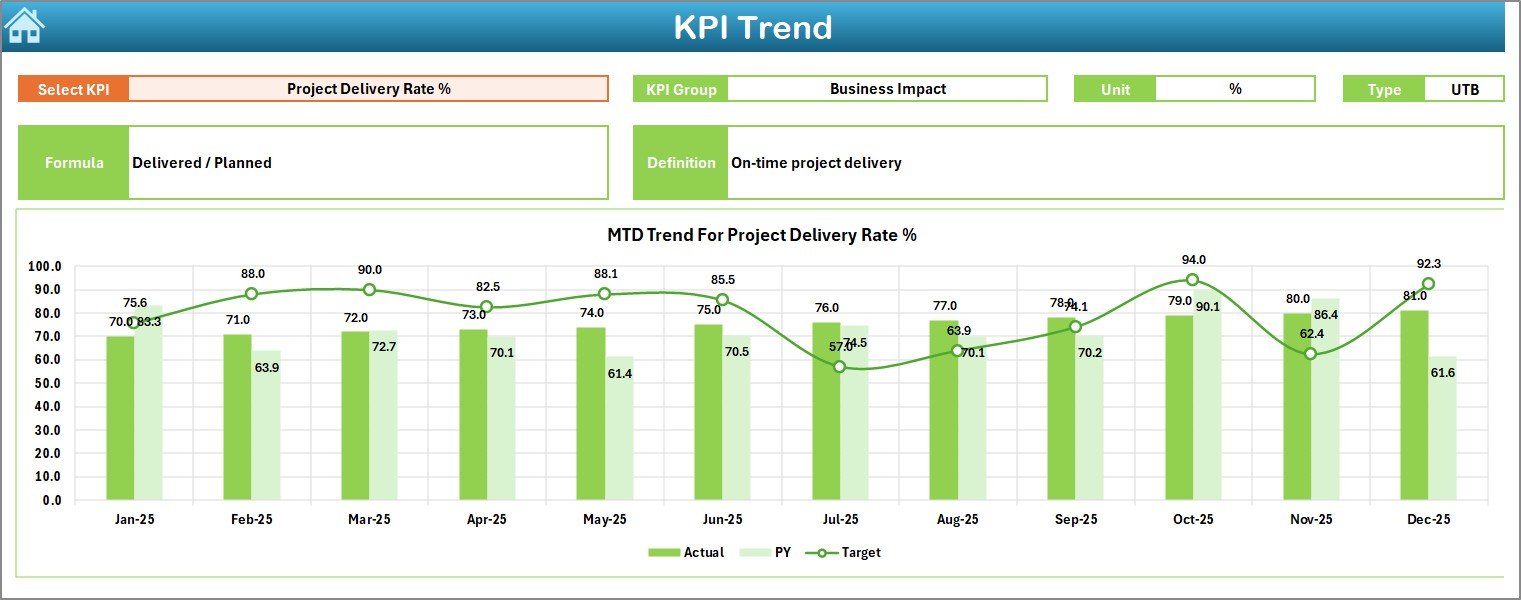
The KPI Trend sheet allows detailed KPI-level analysis.
How to Use the KPI Trend Sheet?
On cell C3, users select a KPI Name from a drop-down. Once selected, the sheet displays:
-
KPI Group
-
Unit of KPI
-
KPI Type (Upper the Better / Lower the Better)
-
KPI Formula
-
KPI Definition
Trend Charts Included
The sheet also shows:
-
MTD Trend Chart (Actual vs Target vs Previous Year)
-
YTD Trend Chart (Actual vs Target vs Previous Year)
Because trends reveal patterns over time, this sheet becomes essential for strategic planning.
Click to Purchases Machine Learning Labs KPI Dashboard in Excel
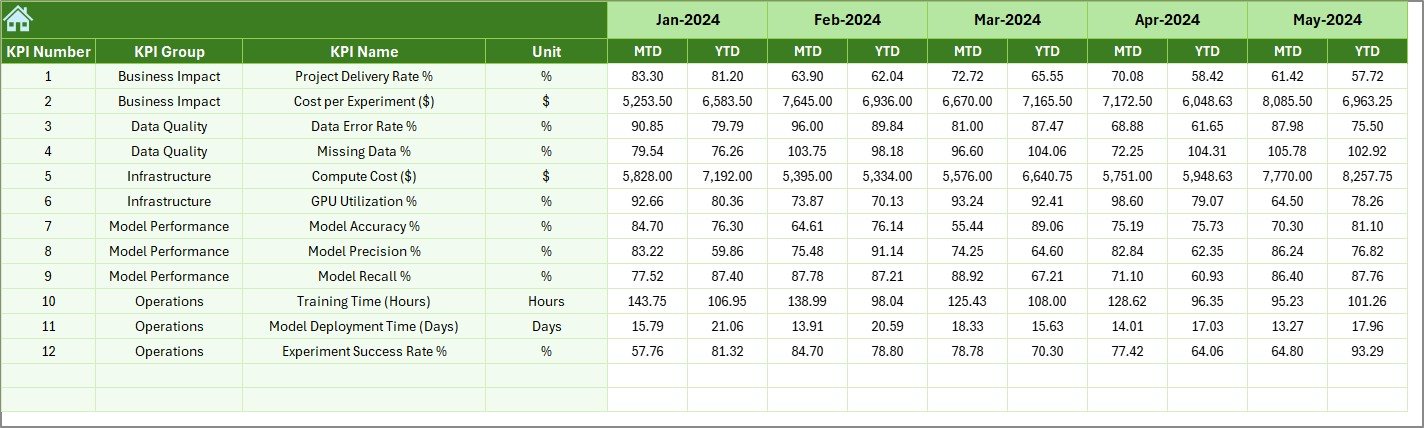
4. Actual Numbers Input Sheet: Data Entry Area
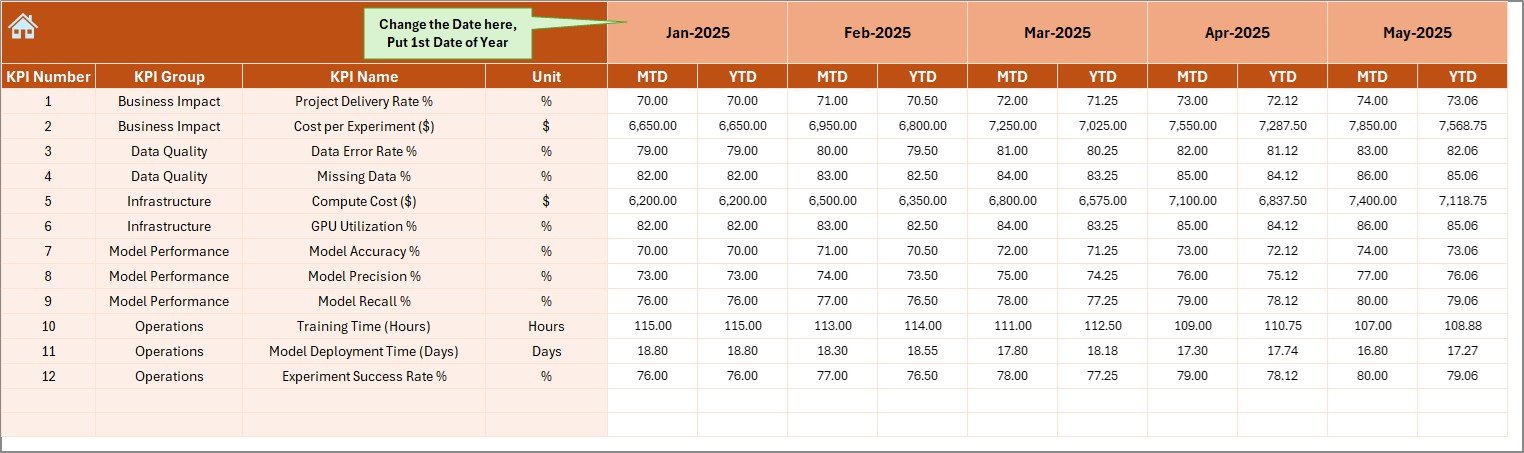
The Actual Numbers Input sheet is where users enter real performance data.
How This Sheet Works
-
Enter the first month of the year in cell E1
-
Input MTD and YTD actual values
-
Change months easily without altering formulas
This structure ensures data consistency and error-free calculations.
5. Target Sheet: Goal Setting and Benchmarks
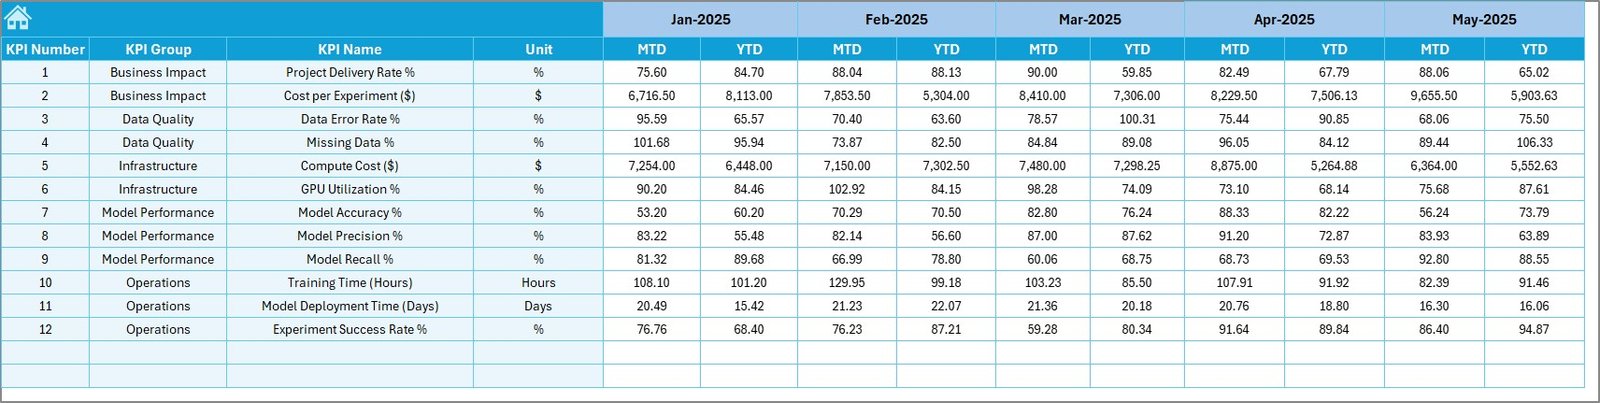
The Target sheet defines performance expectations.
What Users Enter Here
-
Monthly MTD targets
-
Monthly YTD targets
-
KPI-wise performance goals
Because targets remain separate from actuals, comparisons stay accurate and transparent.
6. Previous Year Number Sheet: Historical Comparison
The Previous Year Number sheet stores last year’s KPI values.
Why This Sheet Matters
-
Enables year-over-year analysis
-
Helps identify long-term trends
-
Supports strategic forecasting
Moreover, comparing current performance with historical data strengthens decision-making.
7. KPI Definition Sheet: Standardization and Clarity
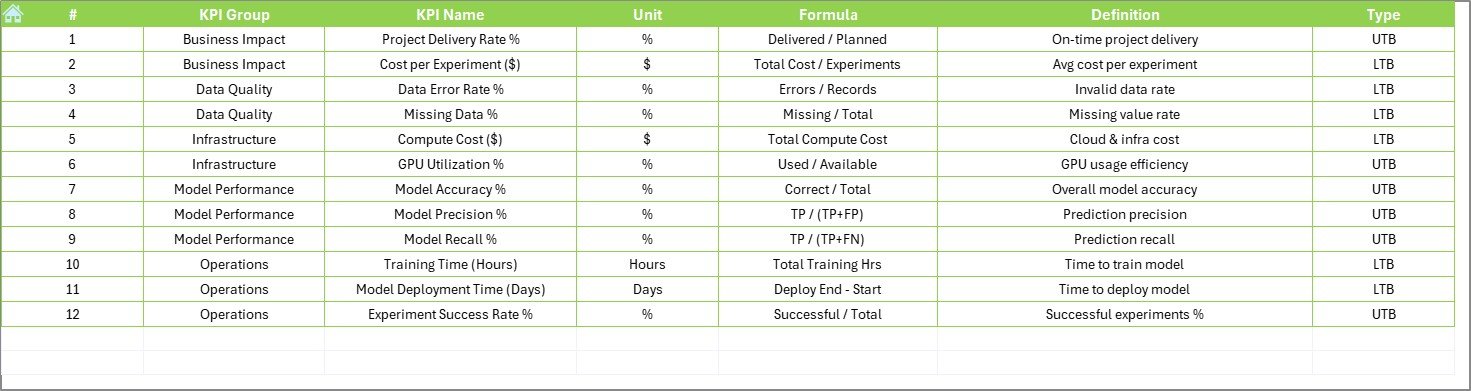
The KPI Definition sheet acts as a reference guide.
Information Stored in This Sheet
-
KPI Name
-
KPI Group
-
KPI Unit
-
KPI Formula
-
KPI Definition
Because of this sheet, every user understands what each KPI means and how it is calculated.
What KPIs Can Machine Learning Labs Track Using This Dashboard?
This dashboard supports a wide range of KPIs, including:
-
Model accuracy improvement rate
-
Experiment success ratio
-
Training time efficiency
-
Infrastructure utilization
-
Dataset processing time
-
Cost per experiment
-
Model deployment frequency
-
Bug resolution cycle time
Therefore, the dashboard adapts to both research-focused and operational KPIs.
Advantages of Machine Learning Labs KPI Dashboard in Excel
1. Centralized Performance Tracking
Instead of juggling multiple reports, teams access all KPIs in one file.
2. Real-Time MTD and YTD Insights
Month-to-date and year-to-date calculations update instantly, ensuring timely decisions.
3. Clear Target vs Actual Comparison
Visual indicators highlight performance gaps clearly and quickly.
4. User-Friendly and No Coding Required
Anyone familiar with Excel can use this dashboard without technical training.
5. Fully Customizable Template
Labs can add KPIs, modify targets, or expand analysis without restrictions.
6. Cost-Effective Analytics Solution
Unlike BI tools, Excel requires no additional licensing or infrastructure.
Click to Purchases Machine Learning Labs KPI Dashboard in Excel
Who Should Use a Machine Learning Labs KPI Dashboard in Excel?
This dashboard works perfectly for:
-
Machine learning lab managers
-
Data science team leads
-
Research and development heads
-
AI project managers
-
Innovation labs
-
Academic research labs
Because of its flexibility, it suits both small labs and large enterprise AI teams.
How Does This Dashboard Improve Decision-Making?
The dashboard improves decisions by:
-
Showing performance gaps early
-
Highlighting trend patterns
-
Supporting resource optimization
-
Reducing manual reporting delays
-
Encouraging data-driven planning
As a result, leadership teams respond faster and smarter.
Best Practices for the Machine Learning Labs KPI Dashboard in Excel
1. Define KPIs Clearly Before Data Entry
Always finalize KPI definitions before entering data. This practice avoids confusion later.
2. Update Actual Data Regularly
Ensure teams update MTD and YTD values consistently to maintain accuracy.
3. Set Realistic and Measurable Targets
Targets should reflect lab capacity and growth plans, not assumptions.
4. Review Trends Monthly
Do not rely only on snapshot metrics. Instead, analyze trend charts every month.
5. Limit KPI Overload
Track meaningful KPIs only. Too many metrics reduce clarity.
6. Maintain Data Validation Rules
Use drop-downs and validations to prevent incorrect entries.
How Does This Dashboard Support Scaling Machine Learning Labs?
As machine learning labs grow, complexity increases. This dashboard scales easily because:
-
New KPIs can be added without redesign
-
Historical data remains intact
-
Multiple teams can use the same framework
-
Monthly and yearly expansions stay simple
Therefore, it supports long-term lab growth.
Common Mistakes to Avoid While Using KPI Dashboards
-
Entering inconsistent data formats
-
Skipping KPI definitions
-
Ignoring previous year comparisons
-
Updating data without validation
-
Overcomplicating KPI formulas
Avoiding these mistakes ensures reliable insights.
Conclusion
A Machine Learning Labs KPI Dashboard in Excel transforms scattered performance data into structured, actionable insights. With its 7-worksheet architecture, dynamic MTD and YTD tracking, trend analysis, and visual indicators, this dashboard empowers machine learning teams to measure progress confidently.
Because Excel remains flexible, affordable, and widely used, this dashboard becomes an ideal solution for labs that want clarity without complexity. When teams track KPIs correctly, they improve efficiency, optimize resources, and accelerate innovation.
Frequently Asked Questions (FAQs)
1. What is the main purpose of a Machine Learning Labs KPI Dashboard in Excel?
The main purpose is to track, analyze, and visualize machine learning performance metrics in one centralized Excel file.
2. Can non-technical users operate this dashboard?
Yes, the dashboard uses drop-downs, buttons, and automated formulas, making it easy for non-technical users.
3. Does this dashboard support MTD and YTD analysis?
Yes, it automatically calculates and displays both MTD and YTD values.
4. Can I customize KPIs in this dashboard?
Absolutely. Users can add, modify, or remove KPIs using the KPI Definition sheet.
5. How does the dashboard compare current data with the previous year?
It uses a dedicated Previous Year sheet to show year-over-year performance comparisons.
6. Is this dashboard suitable for academic research labs?
Yes, academic and commercial labs can both use this dashboard effectively.
7. How often should data be updated?
Ideally, update data monthly to maintain accurate MTD and YTD insights.
Visit our YouTube channel to learn step-by-step video tutorials