Shopping malls operate as complex ecosystems. They handle multiple retail brands, food courts, entertainment units, customer services, parking systems, digital promotions, and operational teams. Because of this complexity, mall managers need accurate insights to run everything smoothly. They must monitor occupancy, footfall, revenue, expenses, marketing impact, tenant performance, and operational efficiency. However, scattered reports and manual spreadsheets often create confusion, delays, and errors.
A Mall Management KPI Dashboard in Excel solves this problem. It turns raw data into a simple visual dashboard that helps managers track performance in real time. With one click, users view monthly KPIs, targets, trends, and previous year comparisons. This dashboard offers clarity, speed, and decision-making power—without any coding or complicated tools.
In this article, you will learn everything about this dashboard: how it works, what insights it provides, why it matters, and how you can use it effectively. You will also explore advantages, best practices, and FAQs—so you understand the dashboard from every angle.
Let’s begin.
Click to Purchases Mall Management KPI Dashboard in Excel
What Is a Mall Management KPI Dashboard in Excel?
A Mall Management KPI Dashboard in Excel is a ready-to-use template designed to help mall managers measure performance accurately. It collects KPIs from different sheets, applies formulas, and changes visuals according to the selected month. Because the dashboard uses Excel, teams don’t need technical skills. They only update actual numbers, targets, and previous year data.
The dashboard includes seven smartly designed worksheets:
1️⃣ Home Page
2️⃣ Dashboard Page
3️⃣ KPI Trend Page
4️⃣ Actual Numbers Input Page
5️⃣ Target Sheet
6️⃣ Previous Year Sheet
7️⃣ KPI Definition Page
Together, these worksheets create a powerful reporting system for mall operations.
Why Do Malls Need a KPI Dashboard?
Malls run many operations every day:
-
Leasing and tenant management
-
Marketing and events
-
Customer experience
-
Utility usage
-
Revenue generation
-
Parking operations
-
Facility maintenance
-
Security and housekeeping
Because so many activities happen simultaneously, mall managers need a structured reporting system. A KPI dashboard brings clarity and control. It helps track performance, identify gaps, improve revenue, and enhance customer experience.
Most importantly, it helps leaders make decisions faster.
Overview of the 7 Worksheets in the Mall Management KPI Dashboard
Now let’s understand each worksheet in detail.
1. Home Sheet: Why Is It Important?

The Home sheet works as the index page. It holds navigation buttons that jump to other sheets. This helps users move around the dashboard easily without searching through tabs.
Buttons include:
-
Dashboard
-
KPI Trend
-
Actual Numbers
-
Targets
-
Previous Year
-
KPI Definitions
This layout saves time and creates a smooth user experience.
2. Dashboard Sheet: What Insights Does It Provide?
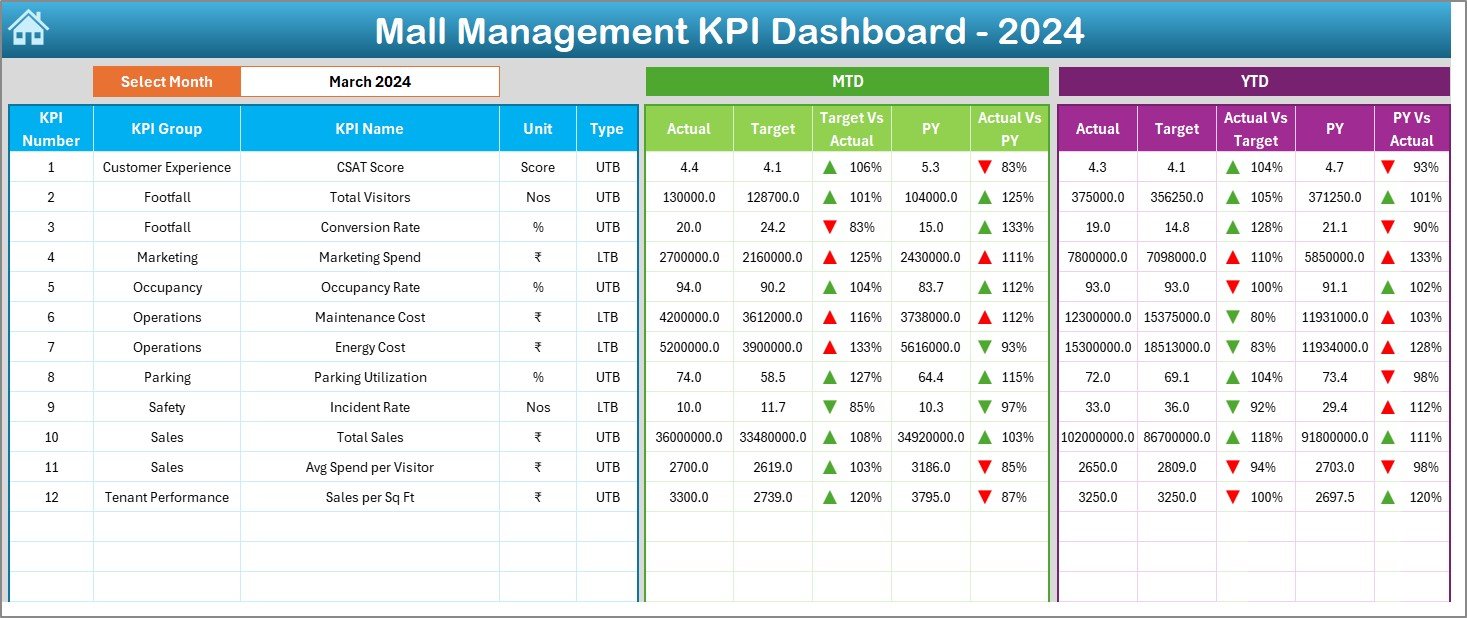
The Dashboard sheet is the heart of this template. It displays all KPIs for the selected month. Users select any month from the dropdown in cell D3. The entire dashboard updates instantly.
✔ MTD Insights
The dashboard shows for each KPI:
-
MTD Actual
-
MTD Target
-
Previous Year MTD
-
Target vs Actual (MTD)
-
Current vs Previous Year (MTD)
-
Performance indicator arrow (green ▲ or red ▼)
This helps managers monitor short-term performance.
✔ YTD Insights
For long-term analysis, the dashboard shows:
-
YTD Actual
-
YTD Target
-
Previous Year YTD
-
Target vs Actual (YTD)
-
Current vs Previous Year (YTD)
-
YTD arrow indicator
MTD helps managers track performance in the current month. YTD helps them understand progress since the beginning of the year.
✔ Conditional Formatting
The dashboard uses:
-
Green ▲ for good performance
-
Red ▼ for poor performance
This makes KPI performance easy to understand in seconds.
Click to Purchases Mall Management KPI Dashboard in Excel
3. KPI Trend Sheet: How Does It Help?

The KPI Trend sheet gives detailed trend insights for every KPI.
Users select a KPI from the dropdown (cell C3). The sheet displays the following:
✔ KPI Information
-
KPI Group
-
Unit
-
Type (LTB or UTB)
-
Formula
-
KPI Definition
This helps users understand what the KPI measures and how to calculate it.
✔ Trend Charts
The page includes two charts:
-
MTD Trend Chart – Actual, Target, PY
-
YTD Trend Chart – Actual, Target, PY
Trend charts help identify:
-
Improvement
-
Decline
-
Seasonality
-
Performance gaps
-
Progress patterns
Because trends give direction, managers understand issues faster.
4. Actual Numbers Input Sheet: What Do You Enter Here?
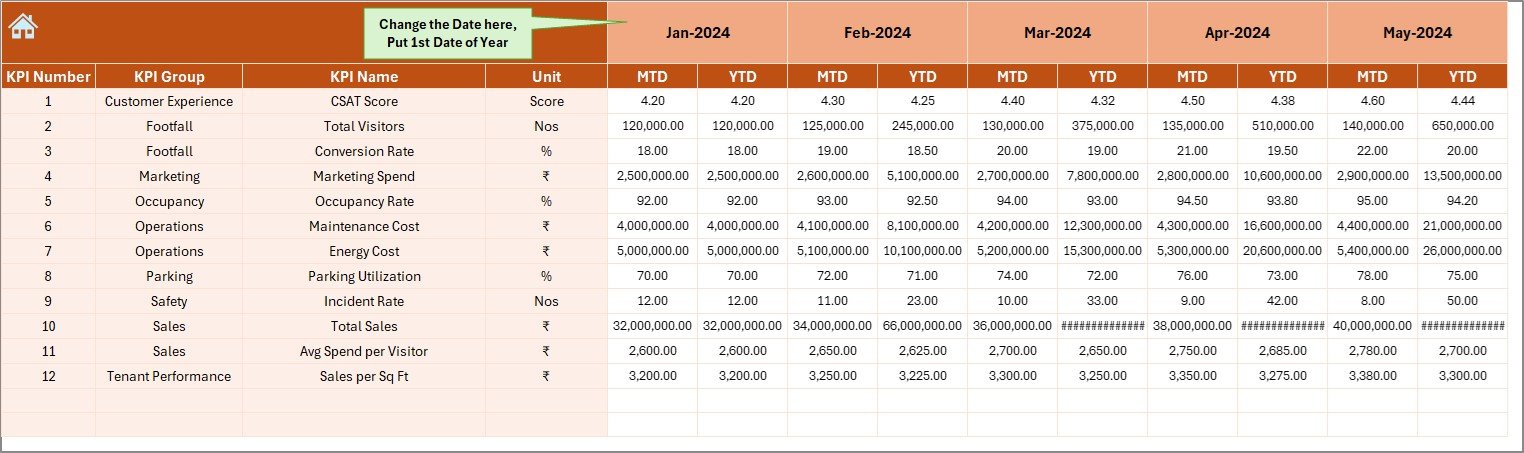
This sheet collects actual MTD and YTD values for each month. Users change the first month of the year in cell E1. The sheet automatically updates the period framework.
You enter:
-
KPI Name
-
Month
-
Actual MTD
-
Actual YTD
These values feed the main Dashboard.
5. Target Sheet: How Does It Work?
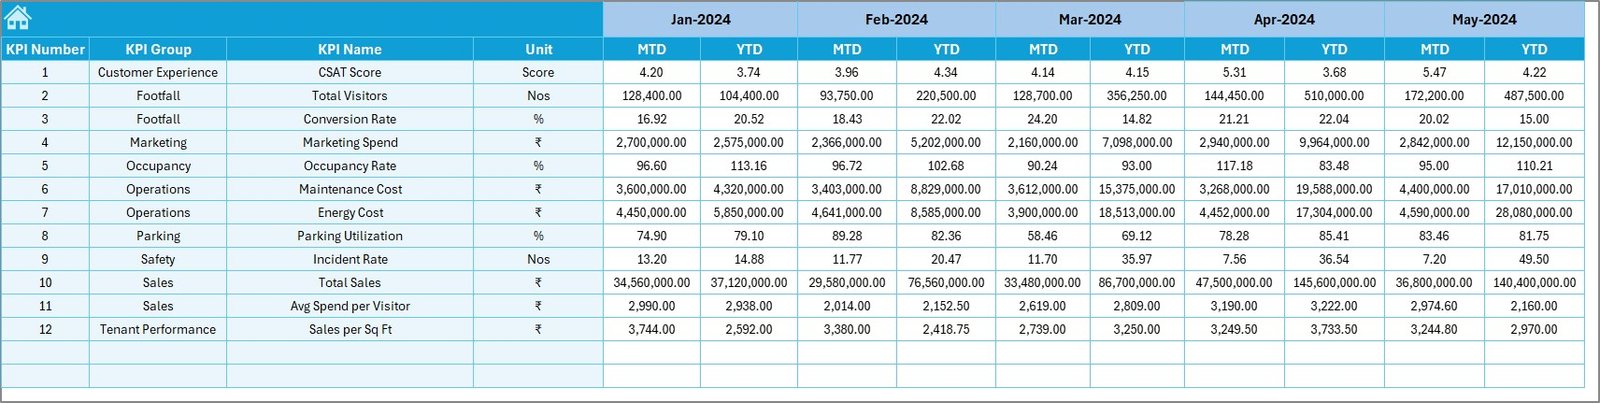
This sheet stores the target values for each KPI. Users enter:
-
KPI Name
-
Month
-
MTD Target
-
YTD Target
Targets help managers compare expectations vs performance.
Click to Purchases Mall Management KPI Dashboard in Excel
6. Previous Year Numbers Sheet: Why Is It Needed?
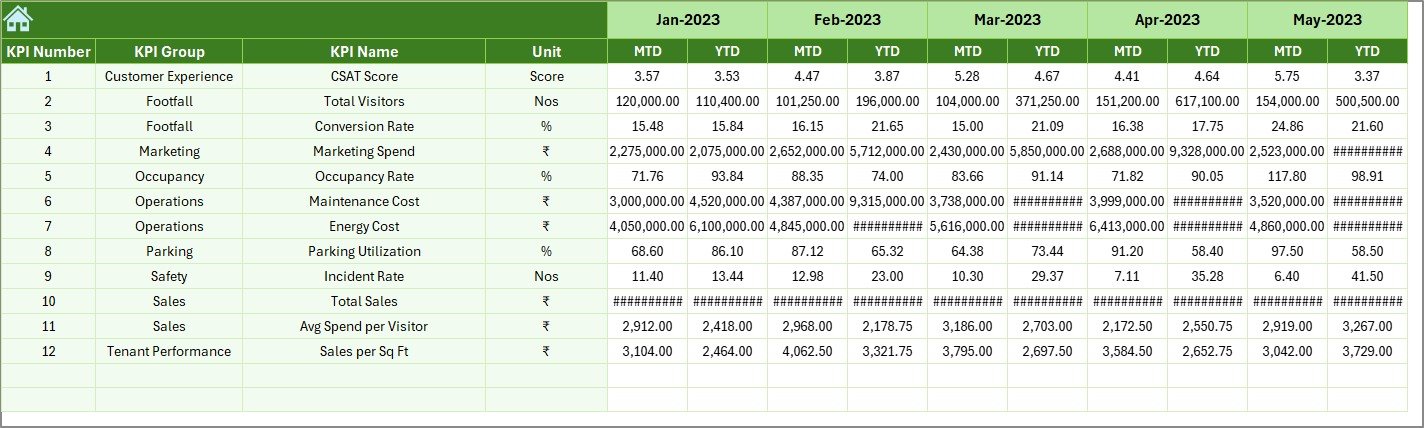
This sheet stores the previous year’s KPI values. It matches the format of the Actual sheet and helps calculate:
-
CY vs PY (MTD)
-
CY vs PY (YTD)
Mall managers use these comparisons to measure growth or decline.
7. KPI Definition Sheet: What Does It Contain?
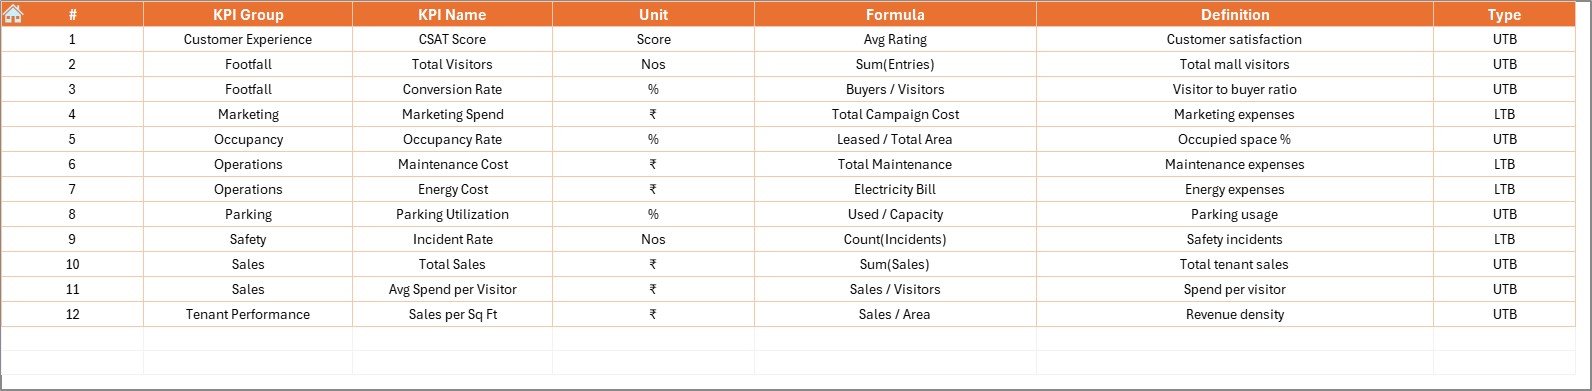
This sheet acts as the master reference list for all KPIs. It includes:
-
KPI Name
-
KPI Group
-
Unit
-
Formula
-
Definition
This sheet makes KPI interpretation easy for all team members.
Click to Purchases Mall Management KPI Dashboard in Excel
Advantages of Mall Management KPI Dashboard in Excel
A dashboard becomes valuable when it helps leaders make smarter decisions. Here are the top advantages of this template:
⭐ 1. Instant Visibility of Performance
Managers view MTD and YTD status instantly without manual calculations.
⭐ 2. Better Tenant and Revenue Planning
Clear KPIs help identify high-performing stores and low-performing ones.
⭐ 3. Faster Decision-Making
Real-time updates enable quick action on operations and promotions.
⭐ 4. Complete Trend Analysis
Trend charts help teams track growth patterns and performance direction.
⭐ 5. Accurate Year-over-Year Comparison
PY insights help managers understand growth, stagnation, or decline.
⭐ 6. Centralized Reporting
All information stays in one Excel file with structured sheets.
⭐ 7. Easy to Use—No Technical Skills Needed
Anyone with basic Excel knowledge can update the dashboard.
⭐ 8. Supports Every Department
Useful for:
-
Operations
-
Leasing
-
Finance
-
Marketing
-
Security
-
Facility Management
This improves cross-team alignment.
How Does This Dashboard Improve Mall Operations?
This dashboard supports smarter mall management by offering:
-
Clear occupancy insights
-
Monthly performance tracking
-
Facility operation visibility
-
Revenue and expense monitoring
-
Marketing and events performance analysis
-
Better housekeeping and security planning
-
Tenant performance evaluation
Because all departments rely on KPIs, this dashboard becomes a central decision-making tool.
Click to Purchases Mall Management KPI Dashboard in Excel
Best Practices for Using a Mall Management KPI Dashboard
To gain the maximum benefit, follow these best practices:
✔ 1. Update Actuals and Targets Every Month
This ensures accurate and timely reporting.
✔ 2. Review Trend Charts Weekly
Trends show early warning signs.
✔ 3. Keep KPI Definitions Clear
All departments must understand KPIs in the same way.
✔ 4. Use Color Indicators Wisely
Red and green arrows give quick insights—use them consistently.
✔ 5. Compare with Previous Year
This helps identify long-term improvements.
✔ 6. Create Balanced KPIs
Track KPIs across leasing, marketing, operations, and finance.
✔ 7. Keep the Dashboard Clean
Avoid clutter. Clear visuals help better decision-making.
Conclusion
A Mall Management KPI Dashboard in Excel helps mall leaders run operations efficiently. It tracks KPIs clearly, compares targets with actuals, shows trends, and highlights previous year performance. With structured sheets for actuals, targets, and definitions, this dashboard becomes easy to maintain and extremely powerful for analysis.
Mall teams use this template to stay informed, disciplined, and aligned. When decision-makers view accurate information, they act faster and improve mall performance with confidence.
This dashboard simplifies reporting and boosts productivity across every department in the mall ecosystem.
Click to Purchases Mall Management KPI Dashboard in Excel
Frequently Asked Questions (FAQs)
1. Who can use this dashboard?
Operations teams, mall managers, finance teams, marketing heads, and leasing managers.
2. Do I need Excel expertise?
No. Basic Excel knowledge is enough.
3. Can I add more KPIs?
Yes. You can expand KPI definitions and link them to actuals and targets.
4. How often should I update the KPIs?
You should update data monthly for accurate insights.
5. Does this dashboard compare with previous year?
Yes. It shows CY vs PY for both MTD and YTD.
6. Can I customize the dashboard layout?
Yes. You can modify visuals, colors, and formats easily.
7. Does this dashboard support decision-making?
Yes. It gives a complete view of performance, helping managers make smarter choices.
Click to Purchases Mall Management KPI Dashboard in Excel
Visit our YouTube channel to learn step-by-step video tutorials