Manufacturing companies always try to optimize their production process. They want to control labor costs, reduce material waste, and improve the overall efficiency of each line, shift, and plant. However, when companies rely on scattered spreadsheets or manual reports, they struggle to track real-time performance. This is why a Manufacturing Production Variance Analysis Dashboard in Excel becomes a powerful and ready-to-use solution.
In this detailed guide, you will learn everything about this dashboard. I will explain its structure, benefits, key features, and best practices. You will also learn how Production Variance Analysis helps teams improve productivity and reduce costs without using complex tools.
Click to Purchases Manufacturing Production Variance Analysis Dashboard in Excel
What Is a Manufacturing Production Variance Analysis Dashboard in Excel?
A Manufacturing Production Variance Analysis Dashboard in Excel is a smart reporting tool that helps teams monitor the difference between standard and actual production performance. It shows labor variance, material variance, production cost variance, and efficiency levels through interactive charts and clean visuals.
Manufacturers use this dashboard to measure how well the production process performs. The dashboard highlights where costs increase, where waste occurs, and which departments, lines, or plants need improvement.
Why Do Manufacturing Teams Need a Variance Analysis Dashboard?
Manufacturing companies deal with many variables—labor hours, material usage, production standards, overhead costs, and machine performance. Without a structured analysis tool, understanding these differences becomes difficult.
A good variance dashboard helps teams:
-
Track performance across shifts, lines, plants, and departments
-
Identify cost leakage
-
Improve productivity
-
Control labor and material usage
-
Make data-based decisions
Therefore, this dashboard is not just a reporting tool—it is a complete analytical system that drives efficiency and cost control.
Key Features of the Manufacturing Production Variance Analysis Dashboard in Excel
This ready-to-use Excel dashboard includes multiple pages, interactive charts, automated calculations, and a clean page navigator on the left side for smooth movement across pages.
Below is a detailed explanation of each page.
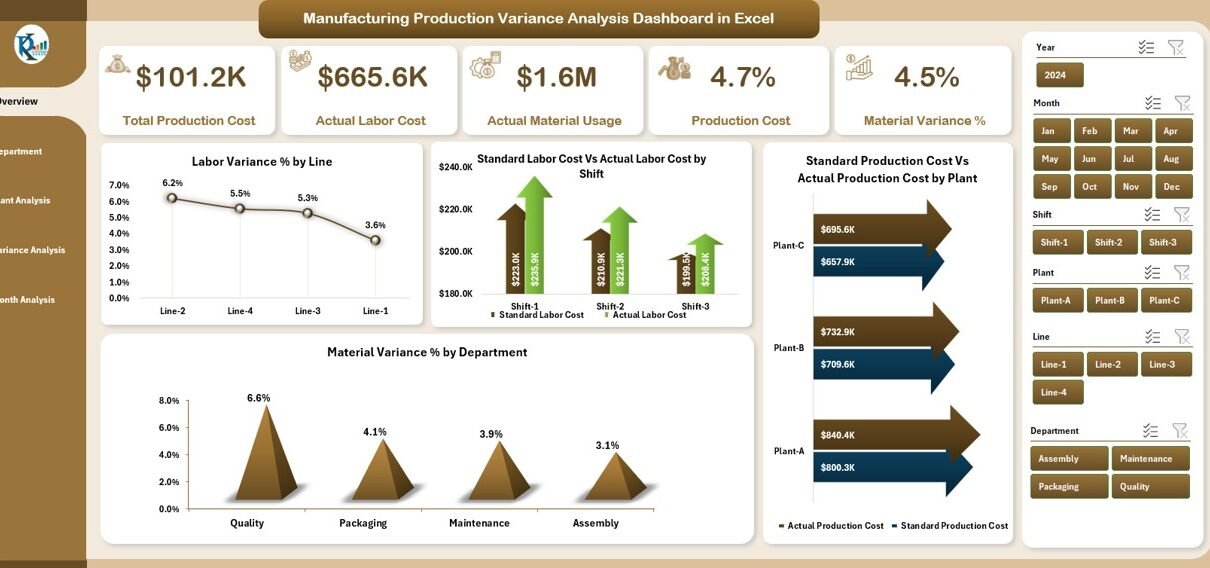
1. Overview Page – What Does It Show?
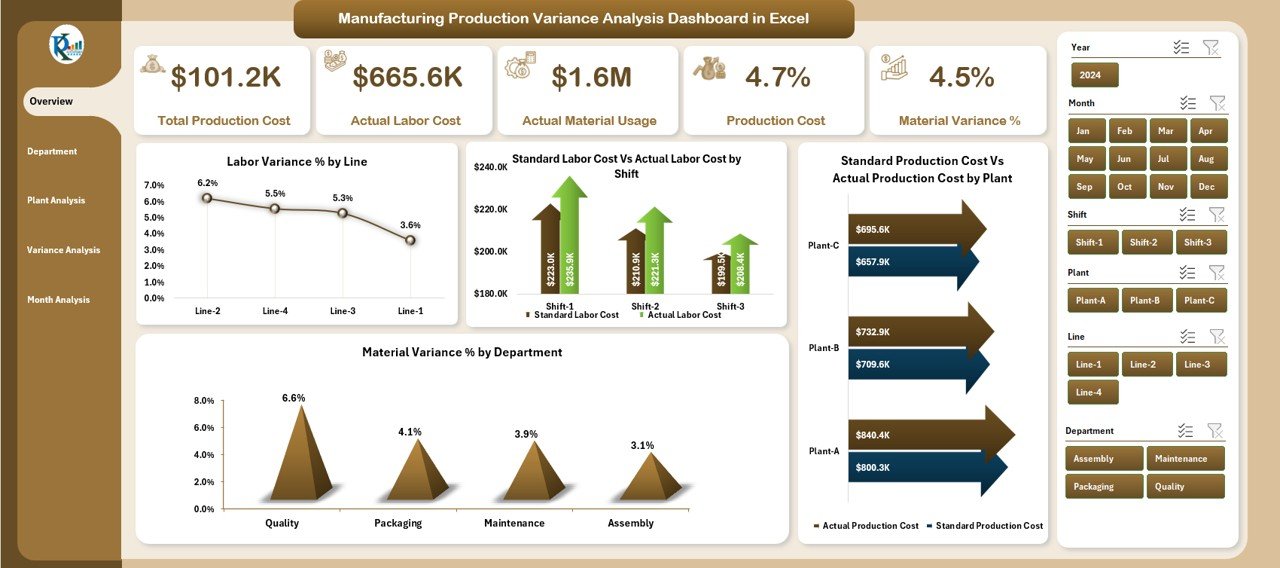
The Overview Page gives a quick summary of the entire production performance. Since it is the main page, users get a snapshot of all major variances in one place.
Key Elements on this Page
✔ A right-side slicer panel for filtering
✔ Five KPI cards to show top-level metrics
✔ Four important charts:
-
Labor Variance % by Line
Shows how each production line performs compared to standard labor expectations. -
Standard Labor Cost vs Actual Labor Cost by Shift
Helps identify shifts with high labor deviation. -
Standard Production Cost vs Actual Production Cost by Plant
Reveals which plants maintain consistent performance. -
Material Variance % by Department
Highlights departments with material wastage or high deviation.
Because of these visuals, managers can instantly see where issues exist and take quick action.
Click to Purchases Manufacturing Production Variance Analysis Dashboard in Excel
2. Department Analysis Page – What Insights Does It Provide?
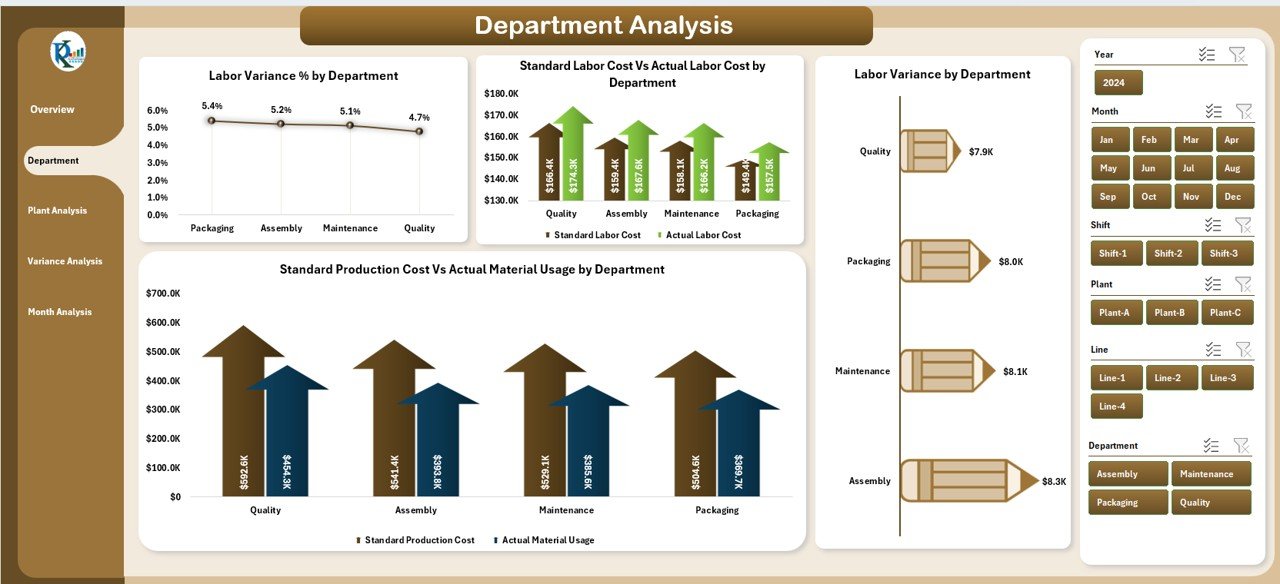
The Department Analysis Page allows users to study the variance performance at the department level.
Key Visuals on this Page
✔ Right-side slicer pane
✔ Four interactive charts:
-
Labor Variance % by Department
-
Standard Labor Cost vs Actual Labor Cost by Department
-
Standard Production Cost vs Actual Production Cost by Department
-
Labor Variance by Department
This page helps the user compare various departments such as HR, Production, Quality, Engineering, or Maintenance.
3. Plant Analysis Page – Why Is It Important?
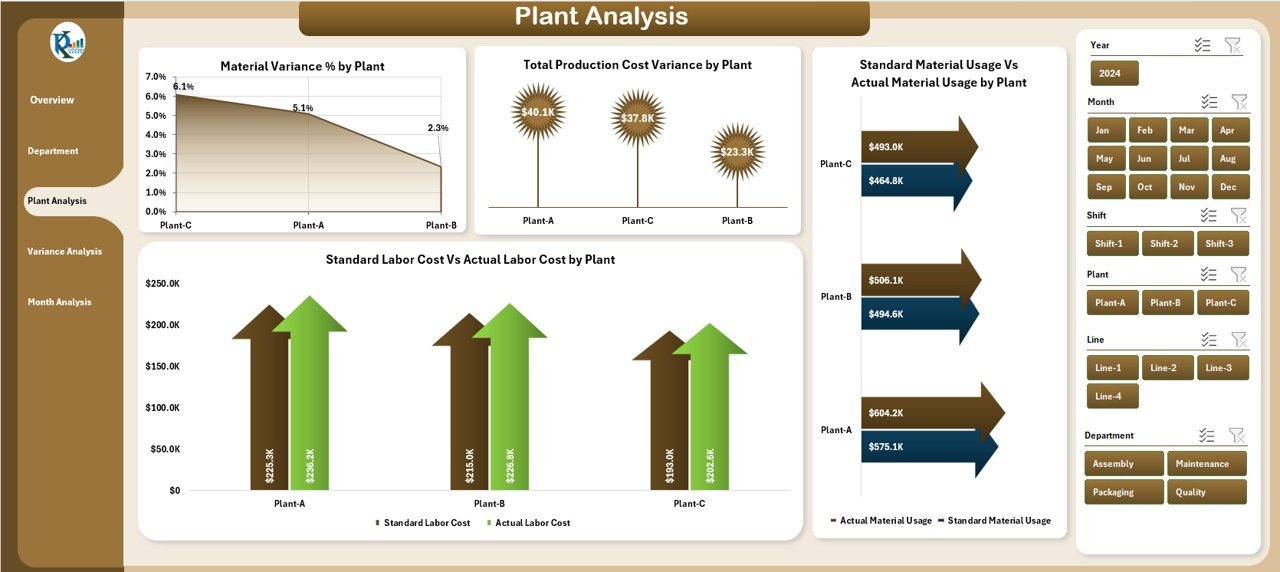
Every plant performs differently because of workforce structure, machinery, scheduling, and resource availability. The Plant Analysis Page helps teams find these differences.
Important Charts
-
Material Variance % by Plant
-
Total Production Cost Variance by Plant
-
Standard Labor Cost vs Actual Labor Cost by Plant Type
-
Standard Production Cost vs Actual Production Cost by Plant Type
This page shows which plants consistently outperform and which ones need improvement.
4. Variance Analysis Page – Understanding Deep Variance Behavior
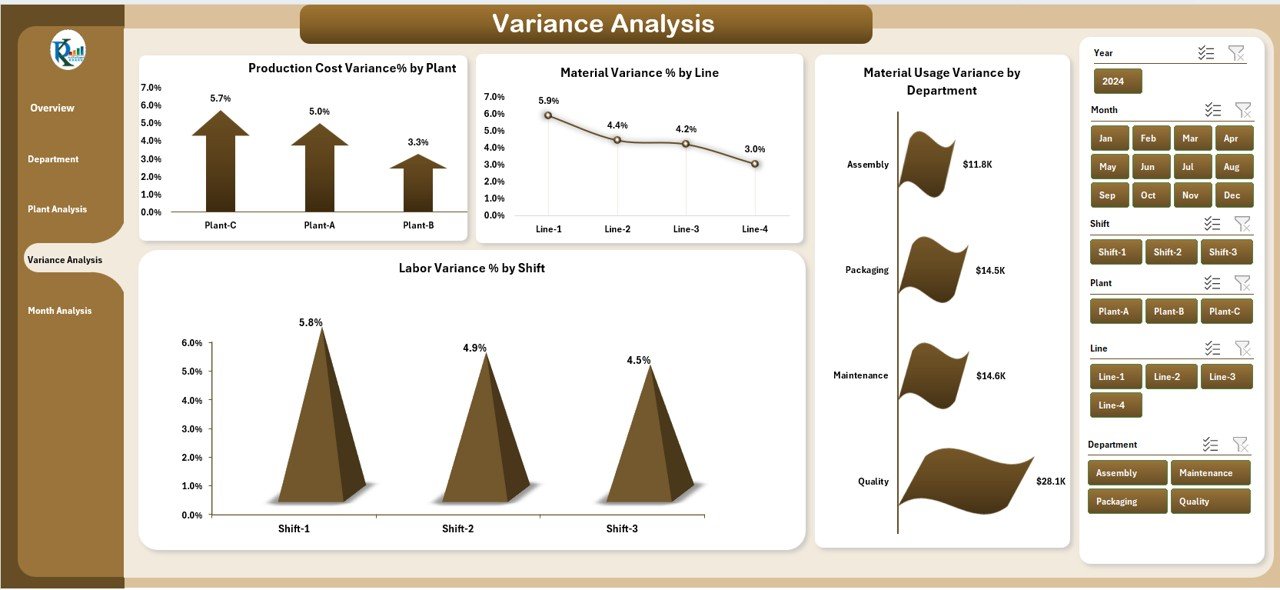
This page focuses only on performance variation. It breaks down the variance by category, department, line, shift, and plant.
Click to Purchases Manufacturing Production Variance Analysis Dashboard in Excel
Charts on this Page
-
Production Cost Variance % by Plant
-
Material Variance % by Line
-
Material Usage Variance by Department
-
Labor Variance % by Shift
These insights give clarity about why certain operations show lower productivity or higher cost.
5. Month Analysis Page – Tracking Trends Month by Month
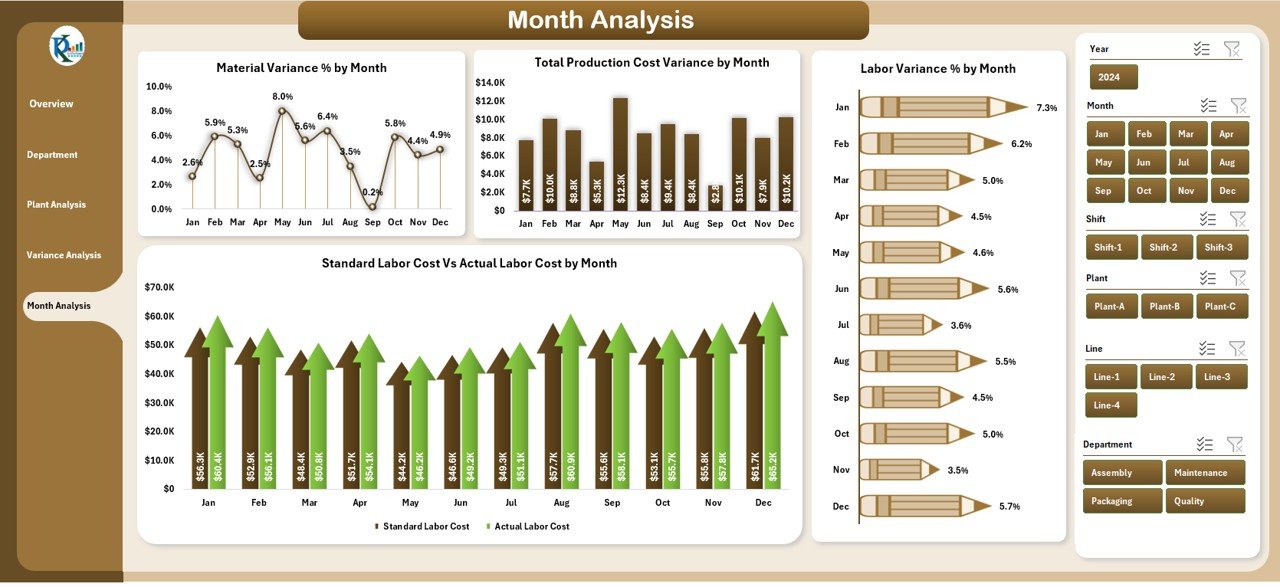
Manufacturers always want to see the trend of performance. That is why this page becomes extremely useful.
Key Charts
-
Material Variance % by Month
-
Total Production Cost Variance by Month
-
Standard Labor Cost vs Actual Labor Cost by Month
-
Standard Production Cost vs Actual Production Cost by Month
This monthly trend view helps production managers create better planning and forecasting strategies.
Support Sheet – What’s Inside?
Every dashboard needs a backend source of data. The Support Sheet or Data Sheet contains:
-
Standard cost values
-
Actual cost values
-
Labor hours
-
Material quantities
-
Line, plant, and department details
-
Monthly performance data
All calculations, variance formulas, and lookups run from this sheet.
What Is Production Variance and Why Does It Matter?
Production variance is the difference between what should happen (standard) and what actually happens.
There are three major types:
1. Labor Variance
Compares standard labor hours or cost with actual labor spent.
2. Material Variance
Shows the difference between standard material usage and actual usage.
3. Production Cost Variance
Tracks if the total production cost stays within the standard limit.
Good variance analysis helps companies reduce waste, improve performance, and increase profitability.
Advantages of Using a Manufacturing Production Variance Analysis Dashboard
1. Clear cost control
The dashboard highlights where extra labor or materials increase cost.
2. Better decision-making
Managers understand exactly which areas need immediate action.
3. Higher operational efficiency
Teams improve processes when they know what slows them down.
4. Real-time visibility
All variances appear instantly in the dashboard.
5. Improved planning
Trend analysis helps in forecasting and resource planning.
6. Reduced waste
Material variance charts help control wastage and improve yield.
How to Use the Dashboard Effectively?
You can use the dashboard in four simple steps:
-
Import or paste your production data into the data sheet
-
Use the slicers to select month, shift, plant, or department
-
Review variance metrics and analyze root causes
-
Take corrective actions based on insights
Because Excel automates the entire calculation, you get accurate results without manual work.
Best Practices for Using a Production Variance Analysis Dashboard
1. Keep your data clean
Always remove errors, empty rows, or duplicates.
2. Update standard cost values regularly
Because production standards change, update them every quarter.
3. Use slicers for detailed comparison
Filter results by plant, department, shift, month, or line.
4. Review variances weekly
Small issues become big losses when ignored.
5. Train teams on variance interpretation
Everyone should understand the meaning of labor and material variance.
6. Add new KPIs when needed
Examples: downtime %, rework %, machine utilization.
Conclusion
A Manufacturing Production Variance Analysis Dashboard in Excel gives manufacturing teams a strong and simple way to track their performance. It helps reduce labor cost, control material usage, and improve production efficiency. The dashboard provides department-wise, plant-wise, and month-wise views, which help managers take quick actions.
Since the dashboard is fully automated and easy to use, anyone can monitor variances even without advanced technical skills. When companies use this dashboard regularly, they improve productivity, reduce waste, and increase overall profitability.
Frequently Asked Questions (FAQs)
1. What is a production variance analysis dashboard?
It is a reporting tool that tracks labor variance, material variance, and cost variance in manufacturing.
2. Why do manufacturers need variance analysis?
They need it to reduce waste, control cost, and improve productivity.
3. Can this dashboard be used for multiple plants?
Yes, you can analyze plant-wise data using slicers and charts.
4. Is Excel enough for deep manufacturing analysis?
Yes, Excel supports formulas, pivot tables, dynamic charts, and automation.
5. What data do I need to run this dashboard?
You need standard costs, actual costs, labor hours, material usage, and department details.
Visit our YouTube channel to learn step-by-step video tutorials