In today’s data-driven world, staying on top of key performance indicators (KPIs) is crucial for understanding market trends and making informed decisions. The Market Research KPI Dashboard in Power BI offers a powerful and visually appealing way to track, analyze, and manage KPIs, ensuring businesses are well-equipped to evaluate their performance over time.
This dashboard integrates seamlessly with an Excel data file and uses Power BI’s dynamic visualization features to provide actionable insights. From tracking actual vs. target performance to analyzing year-over-year trends, this tool provides everything you need to keep your market research on track.
Click to Purchases Market Research KPI Dashboard in Power BI
Key Features of the Market Research KPI Dashboard in Power BI
The Market Research KPI Dashboard in Power BI is a ready-to-use tool designed to track critical metrics for effective market analysis. Here are its core features:
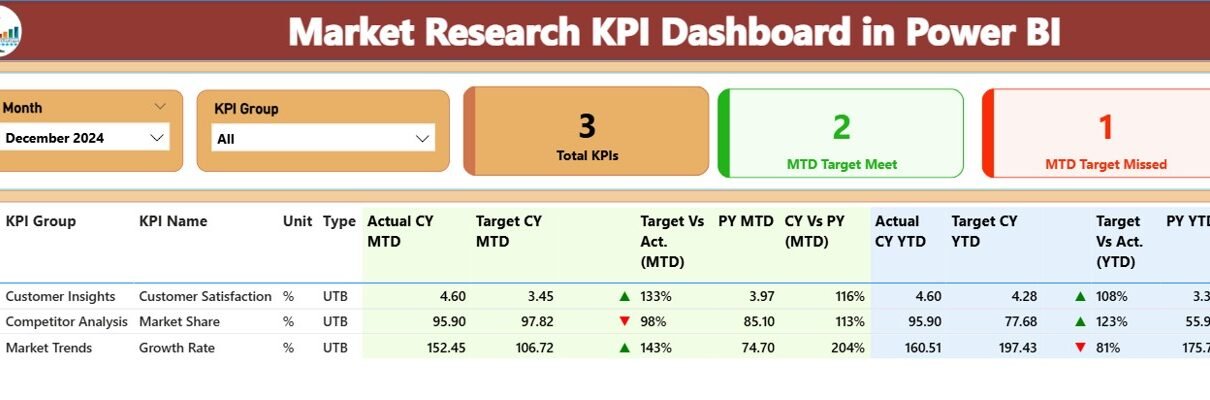
Summary Page
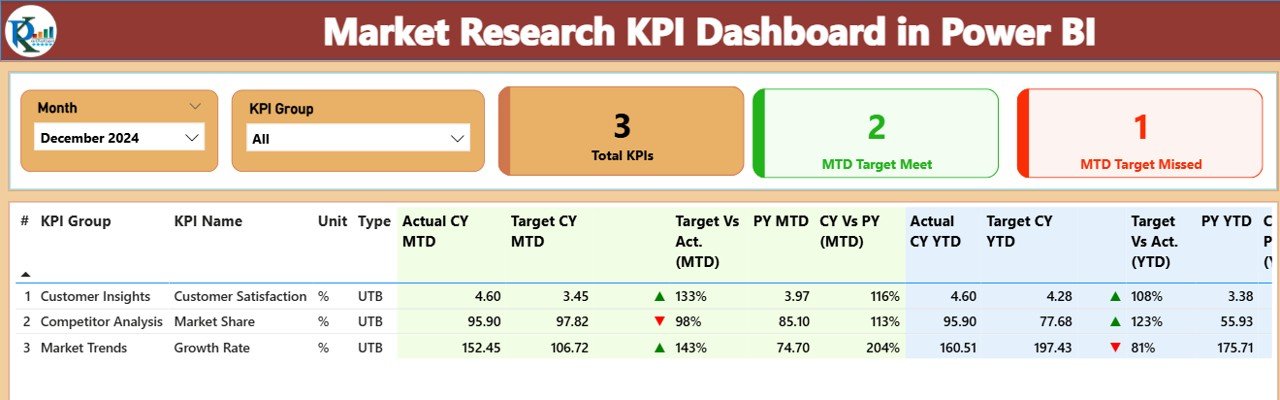
This is the main page of the dashboard, serving as a central hub for KPI analysis. Key elements include:
- Month and KPI Group Slicers: These allow you to filter KPIs by month and category.
- KPIs Overview Cards: Displays the total KPIs count, target met count, and target missed count for the month.
- Detailed KPI Table: A comprehensive table showing key KPI information like:
-
-
-
KPI Number: Sequence number.
-
KPI Group: Category of the KPI (e.g., Sales, Marketing).
-
KPI Name: The name of the KPI.
-
Unit: Unit of measurement (e.g., Percentage, Dollar).
-
Type: KPI type—LTB (Lower the Better) or UTB (Upper the Better).
-
MTD (Month to Date) and YTD (Year to Date): Actual, Target, and previous year (PY) data, with icons indicating whether the KPI is on track (▲) or off track (▼).
-
Percentage Calculation: The dashboard calculates performance percentages for each KPI using formulas like Actual / Target for both MTD and YTD.
-
-
KPI Trend Page
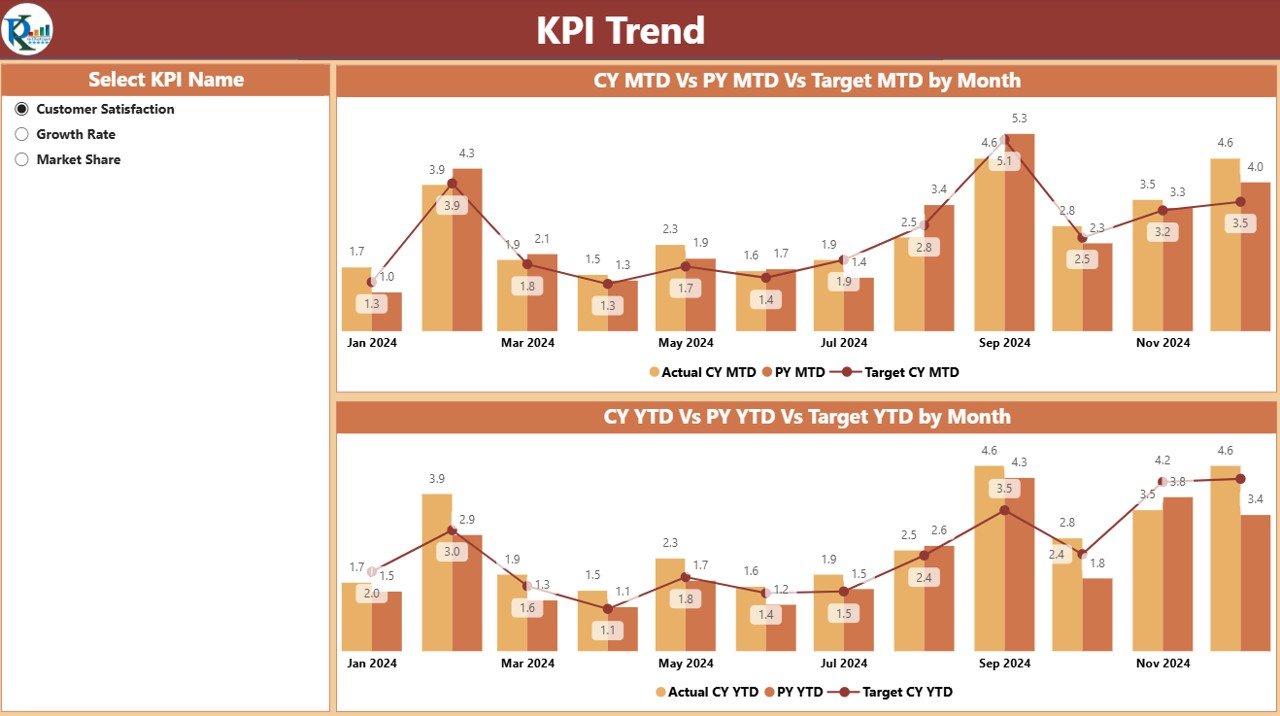
This page helps track KPIs over time with:
- Combo Charts: Visual representation of current year, previous year, and target data for both MTD and YTD.
- KPI Slicer: Allows selection of specific KPIs to analyze their trends across different periods.
KPI Definition Page
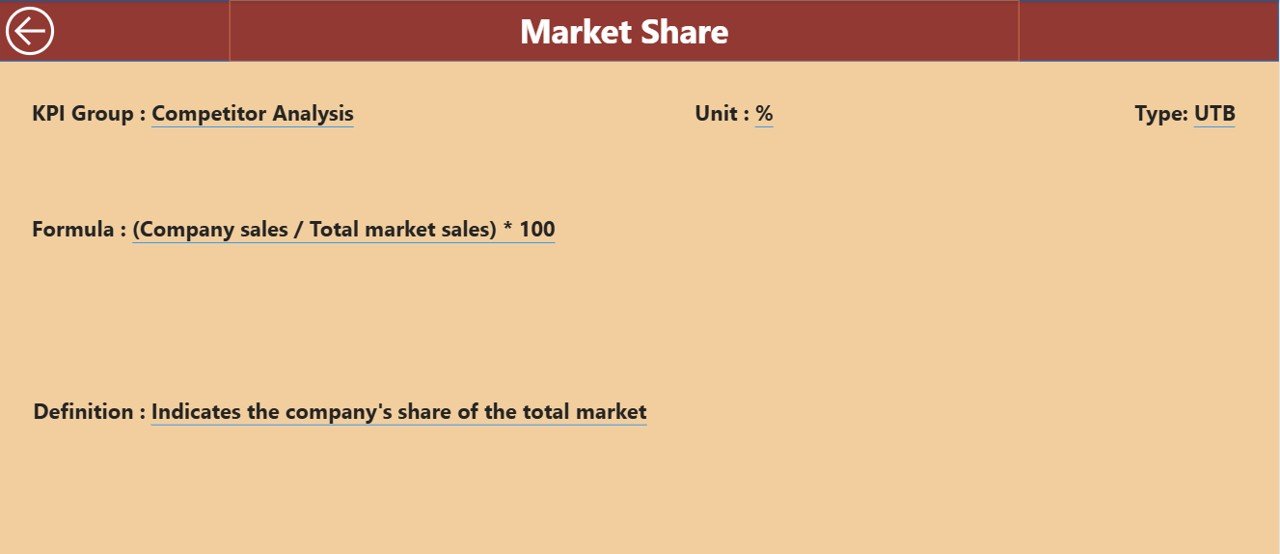
A hidden drill-through page that reveals the formula and definition of each KPI. You can easily access it by clicking on the back button on the Summary page.
How the Data is Structured in Excel
The Market Research KPI Dashboard relies on a well-organized Excel file to feed Power BI with the necessary data. The Excel file consists of three sheets:
Input_Actual:
Here, you input the actual data for each KPI, including:
- KPI Name
- Month (first date of the month)
- MTD numbers
- YTD numbers
Input_Target:
This sheet is used to input target numbers for each KPI, structured similarly to the Input_Actual sheet.
KPI_Definition:
The definition of each KPI is stored here, including:
- KPI Number
- KPI Group
- KPI Name
- Unit
- Formula
- Definition
- Type (LTB or UTB)
This data is then dynamically linked with Power BI to display the KPIs in the dashboard.
Advantages of Using a Market Research KPI Dashboard in Power BI
A Market Research KPI Dashboard in Power BI provides a wide range of benefits that can help businesses make data-driven decisions:
-
Visual Insights:
The dashboard transforms complex data into easy-to-understand visuals, making it easier to track trends and performance. -
Real-Time Data Tracking:
By connecting Power BI with an Excel file, you can update the dashboard in real time. This helps businesses stay agile and respond to changes quickly. -
Comprehensive Data Analysis:
With multiple pages and detailed tables, the dashboard offers an in-depth view of your KPIs, allowing for both high-level and granular analysis. -
Customizable Reports:
The slicers and filters give users the flexibility to focus on specific KPIs, months, or target groups. This makes the dashboard adaptable to a wide range of market research needs. -
Year-Over-Year Comparison:
The inclusion of previous year data allows for easy comparison of current performance against historical data, giving businesses valuable context for decision-making.
Click to Purchases Market Research KPI Dashboard in Power BI
Best Practices for Using a Market Research KPI Dashboard in Power BI
To get the most out of your Market Research KPI Dashboard in Power BI, follow these best practices:
-
Regularly Update Your Data:
Keep your Excel file up to date to ensure the dashboard reflects the most current data. Regular updates help maintain the accuracy and relevance of the insights. -
Use Slicers Wisely:
Leverage the KPI group and month slicers to filter and focus on specific performance metrics. This will help avoid information overload and make your analysis more efficient. -
Set Clear Targets:
Always set clear, measurable targets for each KPI. This will help you evaluate performance more accurately and identify areas for improvement. -
Monitor Key Trends:
Use the KPI Trend Page to identify patterns over time. Look for KPIs that consistently miss targets or show significant improvement. -
Train Your Team:
Make sure everyone involved in market research understands how to use the dashboard. Proper training ensures that the tool is used effectively across your organization.
Frequently Asked Questions (FAQs)
1. What is the Market Research KPI Dashboard in Power BI?
The Market Research KPI Dashboard in Power BI is a tool designed to track, analyze, and manage key performance indicators related to market research. It integrates with Excel data and provides visual insights into actual vs. target performance.
2. How does the Market Research KPI Dashboard help businesses?
This dashboard helps businesses monitor market performance, identify trends, and compare current results with past performance. It enables data-driven decision-making and improves overall market analysis efficiency.
3. Can I customize the dashboard to suit my needs?
Yes, the dashboard is fully customizable. You can filter KPIs by month, target group, and more. Additionally, you can add or modify KPIs and their targets based on your specific business goals.
4. How is the data updated in the dashboard?
The data in the dashboard is updated by modifying the Excel file, which is linked to Power BI. Simply input the latest data into the Excel sheets, and the dashboard will automatically refresh.
5. What are the key advantages of using this Power BI dashboard?
Key advantages include real-time data tracking, comprehensive analysis, customizable reports, and the ability to compare performance across different periods.
Conclusion
The Market Research KPI Dashboard in Power BI is a comprehensive solution for tracking and analyzing market performance. With its user-friendly interface, detailed insights, and customizable features, this tool is indispensable for businesses looking to make informed decisions based on accurate data. By following best practices and regularly updating the data, you can ensure that your market research remains on track and that your business stays ahead of the competition.
Visit our YouTube channel to learn step-by-step video tutorials