In today’s data-driven world, marketing teams must make decisions based on insights rather than assumptions. A Marketing Analytics Dashboard in Power BI provides a clear view of campaign performance, channel effectiveness, lead generation, and overall ROI. Instead of juggling multiple reports and spreadsheets, marketers can monitor everything in one centralized place.
This article will guide you through the concept of a Marketing Analytics Dashboard in Power BI, its key features, advantages, best practices, and how it helps businesses improve decision-making.
What Is a Marketing Analytics Dashboard in Power BI?
Click to Purchases Marketing Analytics Dashboard in Power BI
A Marketing Analytics Dashboard in Power BI is a business intelligence solution designed to track, visualize, and analyze marketing data. It consolidates campaign costs, leads, conversions, and revenue into interactive visuals, making it easier for marketing teams to measure performance and optimize strategies.
Power BI, a tool from Microsoft, offers flexibility and real-time analytics. By connecting it with Excel files, CRM systems, and other marketing platforms, businesses gain a unified view of their marketing operations.
Key Features of the Marketing Analytics Dashboard
The dashboard includes five interactive pages, each designed to serve a unique analytical purpose.
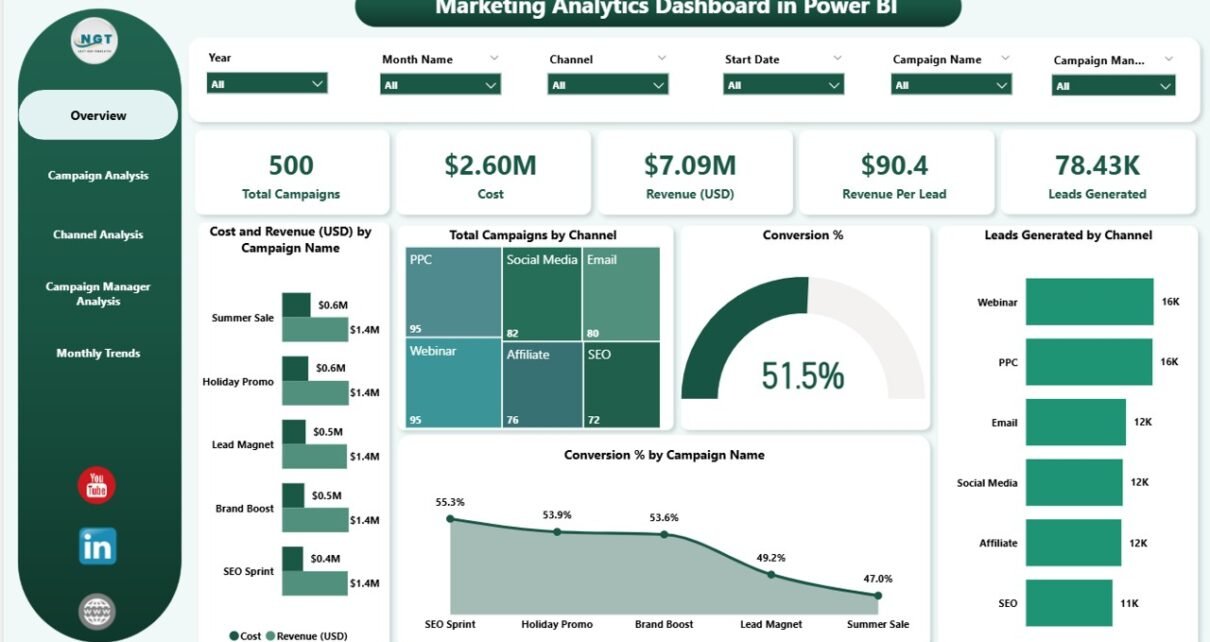
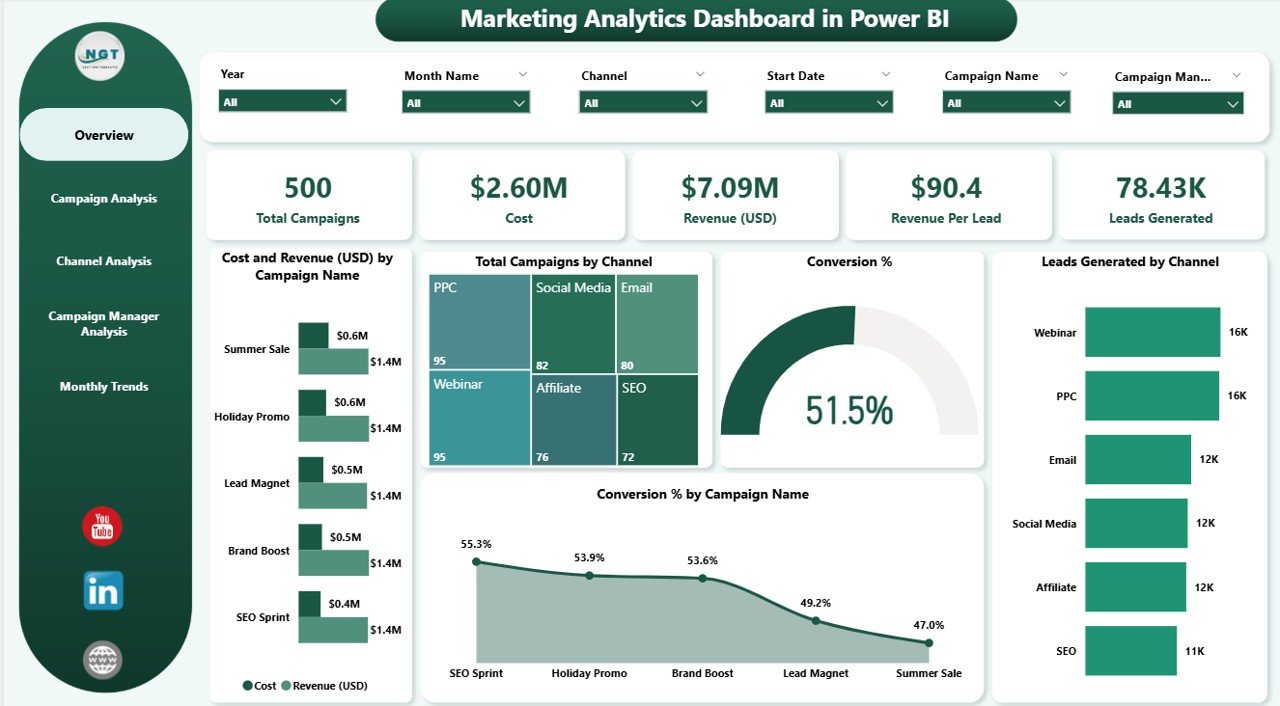
Overview Page
-
This is the main page of the dashboard.
-
It contains slicers (filters) to customize the view based on time, channel, or campaign.
Key visuals include:
- Cost and Revenue (USD) by Campaign Name
- Total Campaigns by Channel
- Conversion %
- Leads Generated by Channel
- Conversion % by Campaign Name
This page provides a bird’s-eye view of overall marketing performance, helping decision-makers quickly identify winning campaigns.
Click to Purchases Marketing Analytics Dashboard in Power BI
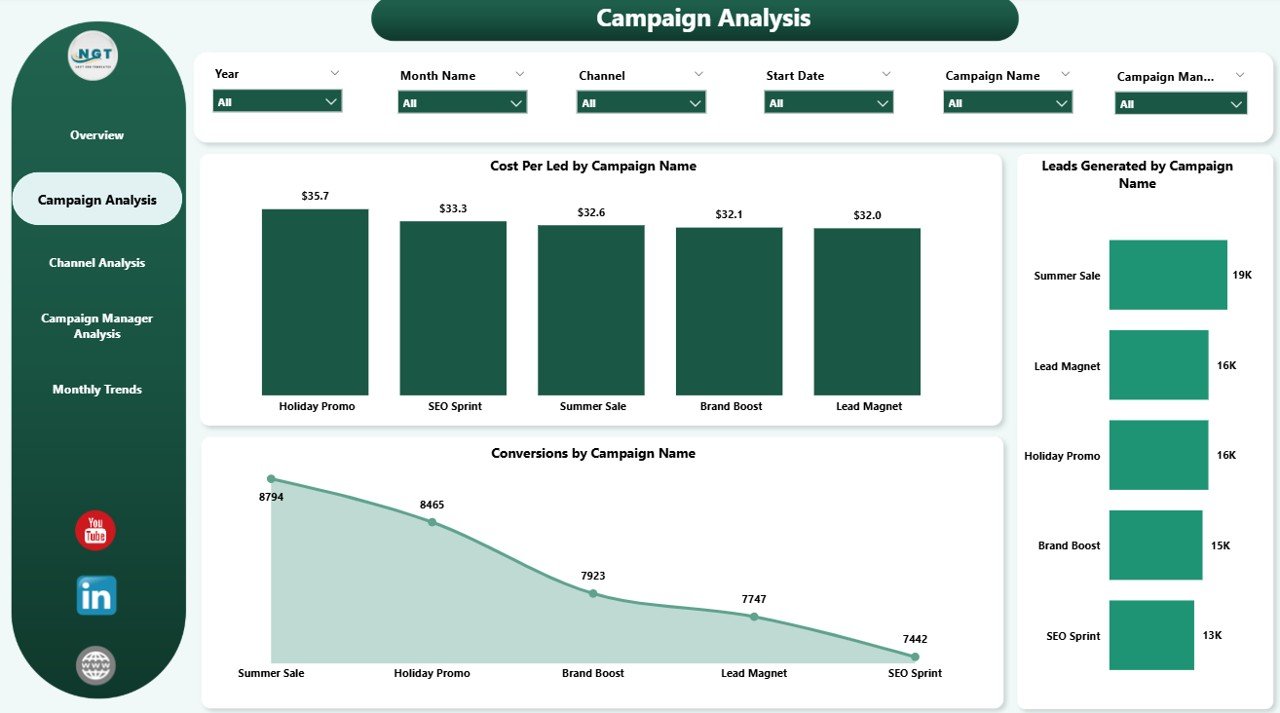
Campaign Analysis Page
-
Focuses on individual campaign performance.
-
Includes slicers to filter by campaign type or timeframe.
Key visuals include:
- Cost per Lead by Campaign Name
- Conversion Rate by Campaign Name
- Leads Generated by Campaign Name
This page allows marketers to compare campaigns side by side and identify which ones drive the best return on investment.
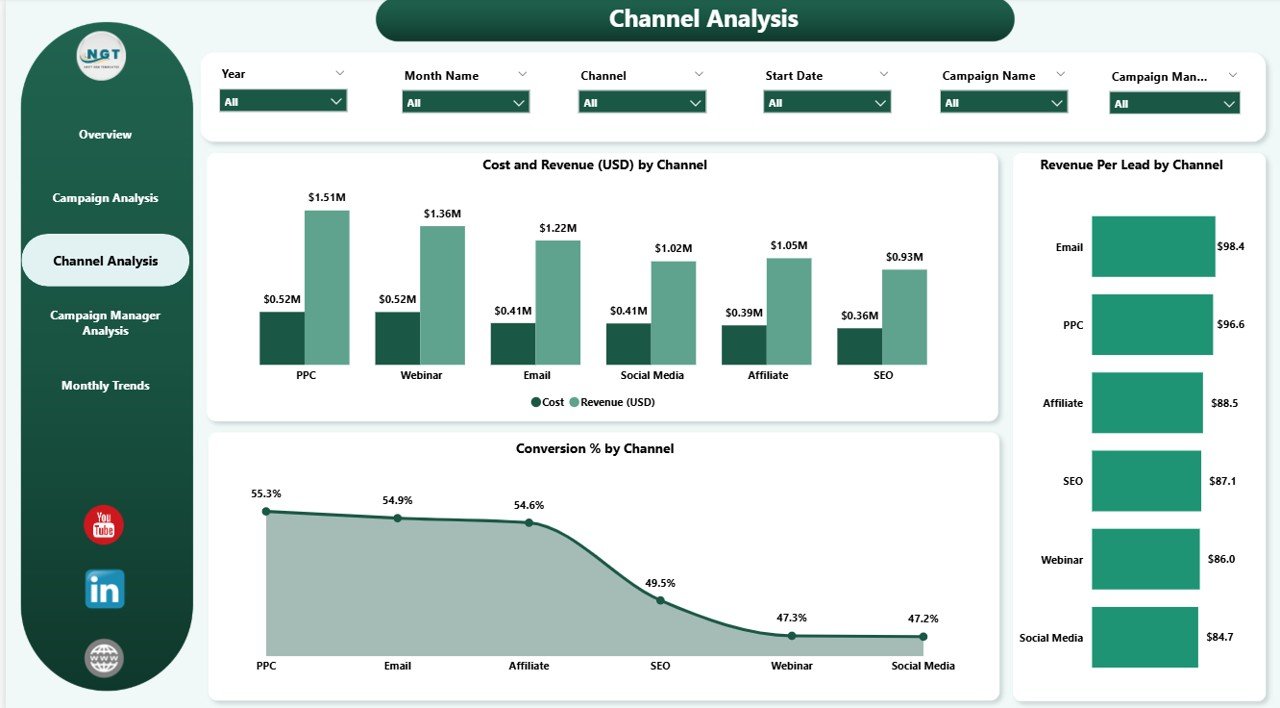
Channel Analysis Page
-
Analyzes performance by channel such as social media, email, paid ads, or events.
Key visuals include:
- Cost and Revenue (USD) by Channel
- Conversion % by Channel
- Revenue per Lead by Channel
This page highlights which marketing channels deliver the highest ROI and which ones need budget adjustments.
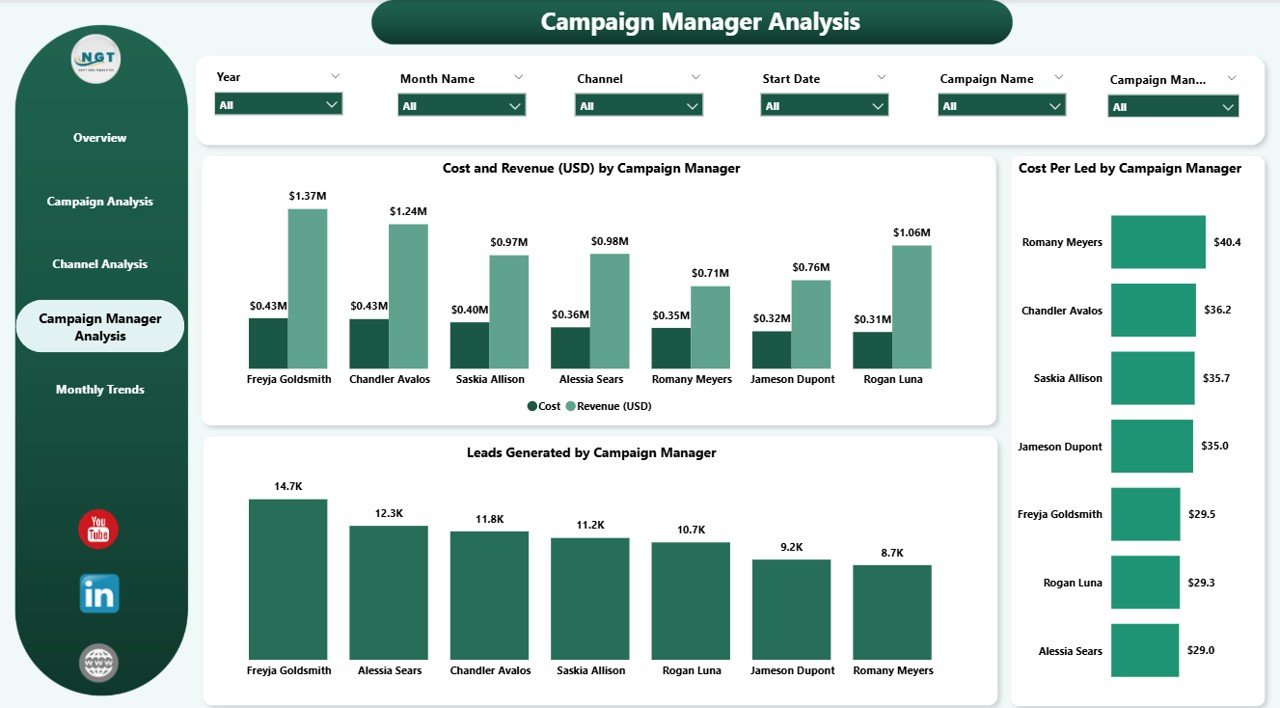
Campaign Manager Analysis Page
-
Provides insights into the performance of different campaign managers.
Key visuals include:
- Cost and Revenue (USD) by Campaign Manager
- Cost per Lead by Campaign Manager
- Leads Generated by Campaign Manager
This page helps managers evaluate team performance and ensures accountability in campaign execution.
Monthly Trends Page
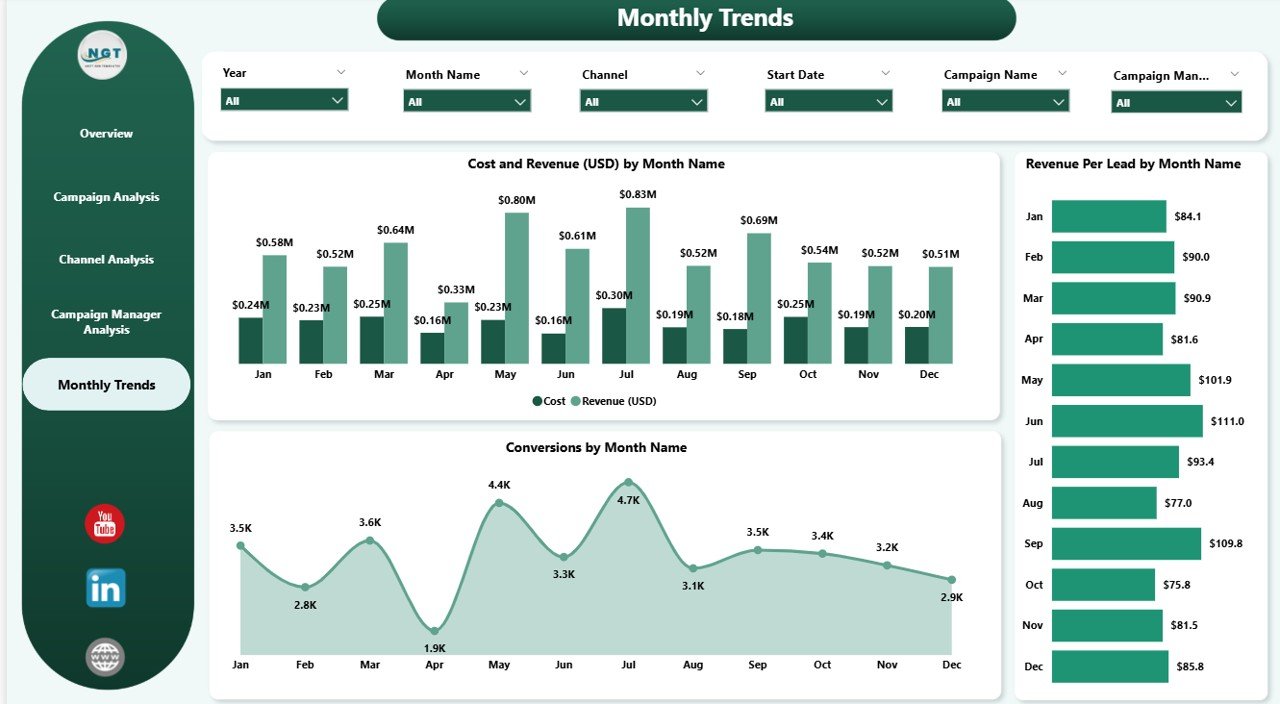
-
Tracks campaign performance over time.
Key visuals include:
- Cost and Revenue (USD) by Month
- Revenue per Lead by Month
- Conversion % by Month
This page highlights seasonal trends and helps forecast future campaign performance.
Why Use a Marketing Analytics Dashboard in Power BI?
A Marketing Analytics Dashboard offers multiple benefits beyond traditional reports:
-
Centralized data – all marketing data in one place.
-
Real-time insights – updates automatically when new data is added.
-
Improved decisions – helps managers see what’s working and what’s not.
-
Data-driven culture – promotes accountability and transparency in marketing.
Advantages of Marketing Analytics Dashboard in Power BI
-
Better Campaign Tracking
-
Monitor cost, leads, and revenue in real time.
-
-
Improved Budget Allocation
-
Shift funds to channels and campaigns with higher ROI.
-
-
Enhanced Team Performance
-
Evaluate campaign managers and team contributions.
-
-
Time-Saving Reports
-
Replace manual Excel reports with automated Power BI dashboards.
-
-
Scalability
-
Works for small businesses and large enterprises alike.
-
Best Practices for the Marketing Analytics Dashboard
To make the most of your dashboard:
✅ Keep visuals simple and clear – avoid clutter and highlight important KPIs.
✅ Use filters wisely – slicers should help users drill down into data quickly.
✅ Align with business goals – ensure KPIs match overall marketing objectives.
✅ Update data sources regularly – keep the dashboard refreshed with accurate information.
✅ Encourage adoption – train marketing teams to use the dashboard effectively.
Click to Purchases Marketing Analytics Dashboard in Power BI
How to Build a Marketing Analytics Dashboard in Power BI
-
Collect Data
-
Export campaign data from Excel, CRM, Google Analytics, or ad platforms.
-
-
Prepare Data
-
Clean and format data to ensure consistency.
-
-
Load Data into Power BI
-
Import Excel sheets or connect live sources.
-
-
Design the Dashboard
-
Create pages for overview, campaigns, channels, managers, and trends.
-
-
Add Interactivity
-
Use slicers, drill-throughs, and filters.
-
-
Validate KPIs
-
Ensure metrics like conversion % and cost per lead are calculated correctly.
-
Opportunities for Improvement
Even a great dashboard can evolve. Some opportunities include:
🔹 Integration with CRM systems like Salesforce or HubSpot for deeper insights.
🔹 Inclusion of customer journey data to link marketing with sales.
🔹 Adding predictive analytics to forecast campaign results.
🔹 Automated alerts when KPIs cross thresholds.
🔹 Mobile optimization so managers can check results on the go.
Conclusion
A Marketing Analytics Dashboard in Power BI transforms how businesses measure marketing performance. With its five pages—Overview, Campaign Analysis, Channel Analysis, Campaign Manager Analysis, and Monthly Trends—it provides clarity, accountability, and actionable insights.
By following best practices and continuously improving the dashboard, businesses can boost ROI, strengthen marketing strategies, and achieve long-term growth.
Frequently Asked Questions (FAQs)
1. What is the purpose of a Marketing Analytics Dashboard in Power BI?
It consolidates campaign, channel, and revenue data into one interactive dashboard, making it easier for businesses to measure ROI and optimize strategies.
2. Can small businesses use Power BI for marketing analytics?
Yes. Power BI is affordable and scalable, making it ideal for both startups and large enterprises.
3. What data sources can connect to a Marketing Analytics Dashboard?
You can connect Excel, Google Analytics, Facebook Ads, CRM tools, and other marketing platforms.
4. How often should the dashboard be updated?
Ideally, it should refresh daily or in real-time to provide the most accurate insights.
5. Can I customize the dashboard to fit my business needs?
Absolutely. Power BI dashboards are flexible and can be tailored with specific KPIs, visuals, and filters.
Visit our YouTube channel to learn step-by-step video tutorials