Healthcare organizations must track performance carefully to provide high-quality patient care. This requirement becomes even more important in maternity hospitals because they handle sensitive cases such as pregnancy care, childbirth, newborn health, and maternal recovery. Therefore, hospital administrators need clear insights into operational efficiency, patient outcomes, and clinical performance.
However, many maternity hospitals still rely on scattered spreadsheets and manual reports. As a result, managers often struggle to track important performance indicators like delivery success rate, patient satisfaction, maternal complications, or bed utilization. Without a structured monitoring system, decision-making becomes slow and less accurate.
Therefore, hospitals increasingly use Key Performance Indicator (KPI) dashboards to monitor and analyze performance. One of the most effective tools for this purpose is the Maternity Hospitals KPI Dashboard in Excel.
The Maternity Hospitals KPI Dashboard in Excel is a ready-to-use analytics template designed to track critical maternity healthcare metrics. This dashboard helps hospital administrators, doctors, and management teams monitor hospital performance using structured visual reports.
Because Excel is widely used and easy to customize, hospitals can quickly implement this dashboard without investing in expensive software systems. Moreover, the dashboard organizes data into clear charts, KPI cards, and trend reports that allow management to identify performance gaps and improve patient care.
In this article, you will learn everything about the Maternity Hospitals KPI Dashboard in Excel, including what it is, how it works, its key features, advantages, best practices, and frequently asked questions.
Click to buy Maternity Hospitals KPI Dashboard in Excel
What is a Maternity Hospitals KPI Dashboard in Excel?
A Maternity Hospitals KPI Dashboard in Excel is a performance monitoring tool designed specifically for maternity healthcare facilities. It helps hospitals track important performance indicators related to maternal health services, operational efficiency, and patient satisfaction.
Instead of reviewing multiple reports, hospital administrators can monitor all important KPIs in one centralized dashboard. This approach allows decision-makers to evaluate hospital performance quickly and accurately.
Moreover, the dashboard automatically calculates monthly and yearly performance metrics, which makes performance tracking easier for management teams.
Some examples of maternity hospital KPIs include:
- Total Deliveries
- Cesarean Section Rate
- Normal Delivery Rate
- Maternal Mortality Rate
- Neonatal Mortality Rate
- Average Length of Stay
- Patient Satisfaction Score
- Bed Occupancy Rate
- Complication Rate
Because the dashboard consolidates these KPIs in a visual format, hospital managers can quickly identify trends and take corrective actions.
Why Do Maternity Hospitals Need KPI Dashboards?
Maternity hospitals handle complex medical procedures and large volumes of patient data. Therefore, they must track performance carefully to ensure patient safety and operational efficiency.
However, manual monitoring methods often create several problems.
For example:
- Data remains scattered across different spreadsheets
- Performance reports take too long to prepare
- Management cannot identify trends quickly
- Decision-making becomes slower
Therefore, maternity hospitals benefit greatly from KPI dashboards.
A well-designed dashboard helps healthcare organizations:
- Monitor hospital performance in real time
- Identify operational inefficiencies
- Improve maternal and neonatal outcomes
- Track financial and operational metrics
- Make faster data-driven decisions
As a result, hospital administrators can improve both healthcare quality and operational performance.
Key Features of the Maternity Hospitals KPI Dashboard in Excel
This Maternity Hospitals KPI Dashboard in Excel includes several powerful features that simplify performance monitoring.
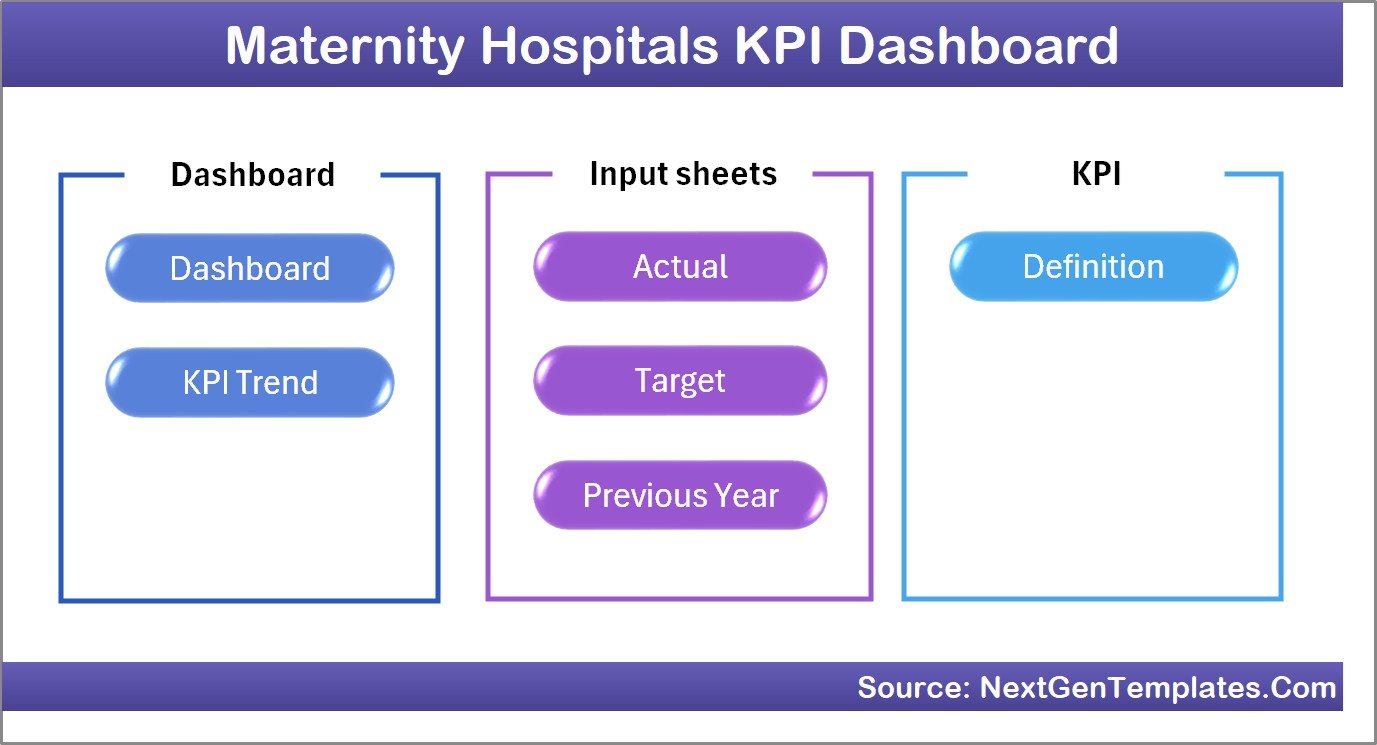
The template contains 7 worksheets, each designed to manage a specific part of the KPI system.
Summary Page
The Summary Page works as the navigation hub of the dashboard.
This sheet includes six interactive buttons that allow users to quickly move to other sections of the dashboard.
Therefore, users can easily navigate between sheets without searching manually.
Typical navigation buttons include:
- Dashboard
- Trend Analysis
- Data Input
- Target Data
- Previous Year Data
- KPI Definitions
Because of this structure, users can manage the entire dashboard from one central location.
Click to buy Maternity Hospitals KPI Dashboard in Excel
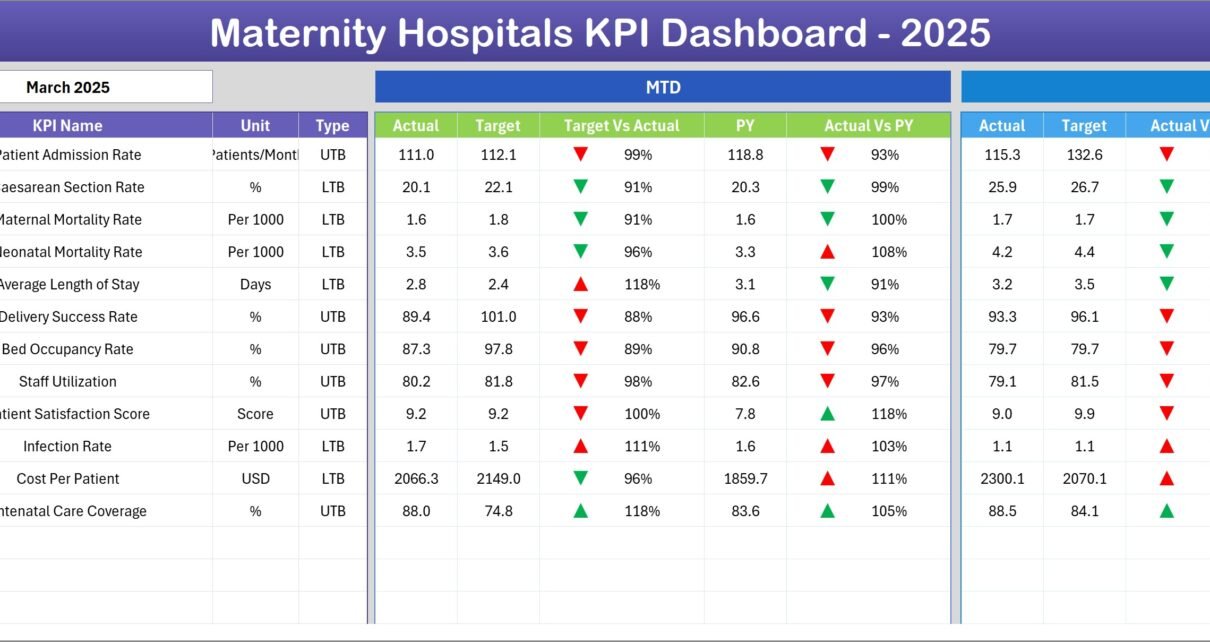
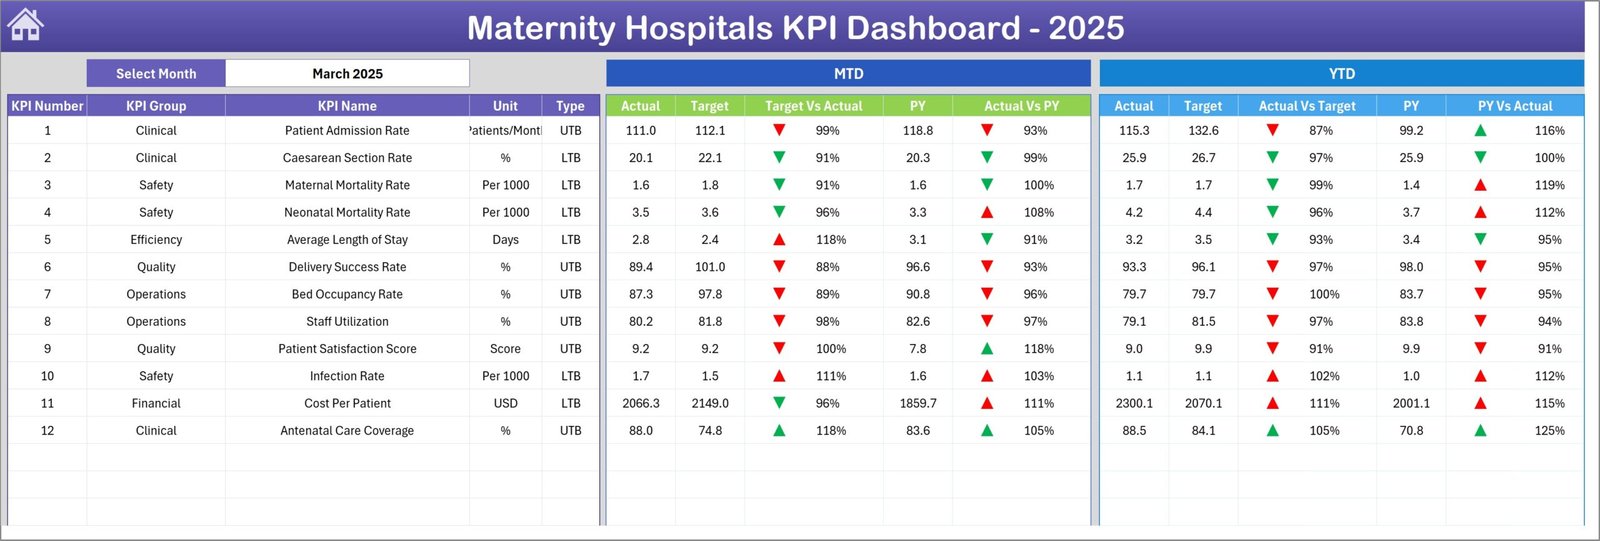
Dashboard Sheet
The Dashboard Sheet serves as the main analysis page of the template.
This sheet displays all key performance indicators in a visual format.
Users can select the Month from the dropdown located in cell D3. Once the month changes, the entire dashboard updates automatically.
The dashboard displays the following metrics:
Monthly Performance Metrics
- MTD Actual
- MTD Target
- MTD Previous Year
- Target vs Actual
- Previous Year vs Actual
Conditional formatting arrows show whether performance increased or decreased.
Year-to-Date Performance Metrics
The dashboard also shows YTD performance data, including:
- YTD Actual
- YTD Target
- YTD Previous Year
- Target vs Actual
- Previous Year vs Actual
Because of these comparisons, hospital administrators can easily evaluate whether KPIs meet performance goals.
Click to buy Maternity Hospitals KPI Dashboard in Excel
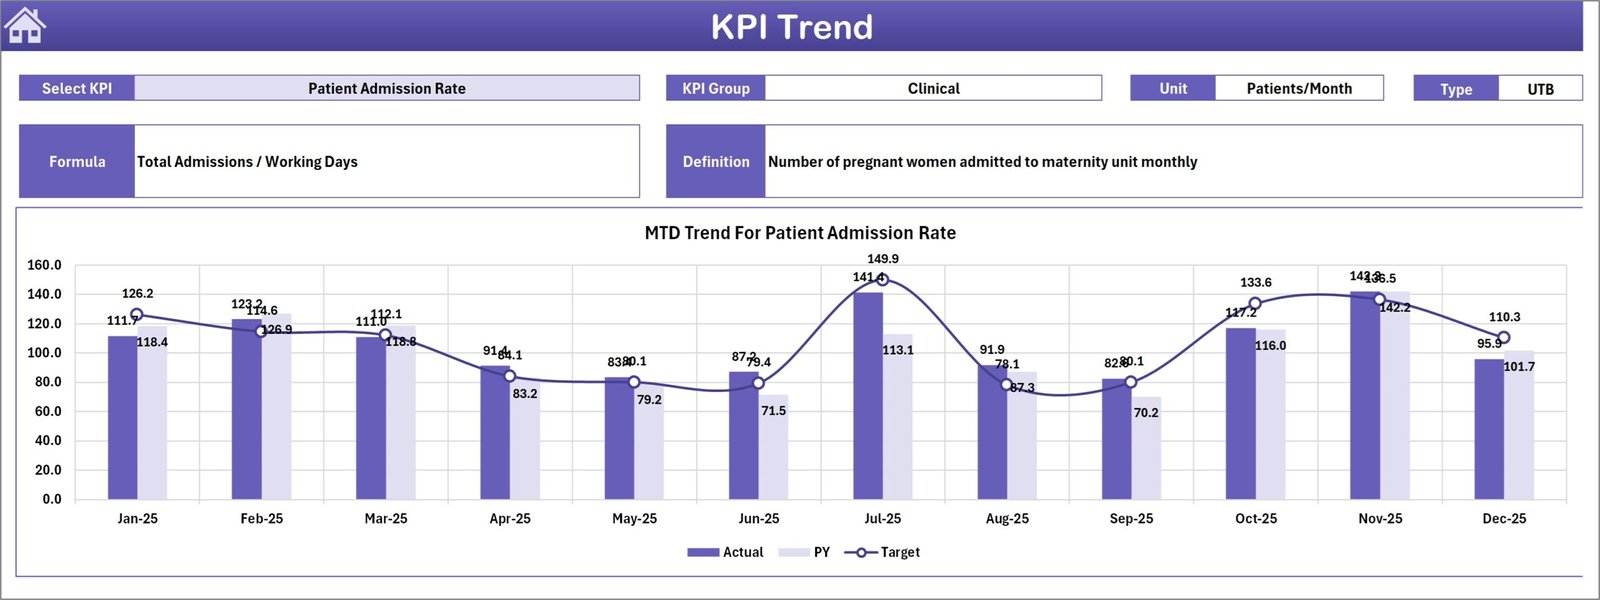
Trend Sheet
The Trend Sheet provides detailed KPI trend analysis.
Users can select the KPI name from a dropdown list located in cell C3.
Once a KPI is selected, the sheet displays important details such as:
- KPI Group
- KPI Unit
- KPI Type (Lower the Better or Upper the Better)
- KPI Formula
- KPI Definition
In addition, the sheet displays trend charts for both:
- MTD Performance Trends
- YTD Performance Trends
These charts compare:
- Actual Values
- Target Values
- Previous Year Values
As a result, hospital administrators can clearly identify performance trends over time.
Click to buy Maternity Hospitals KPI Dashboard in Excel
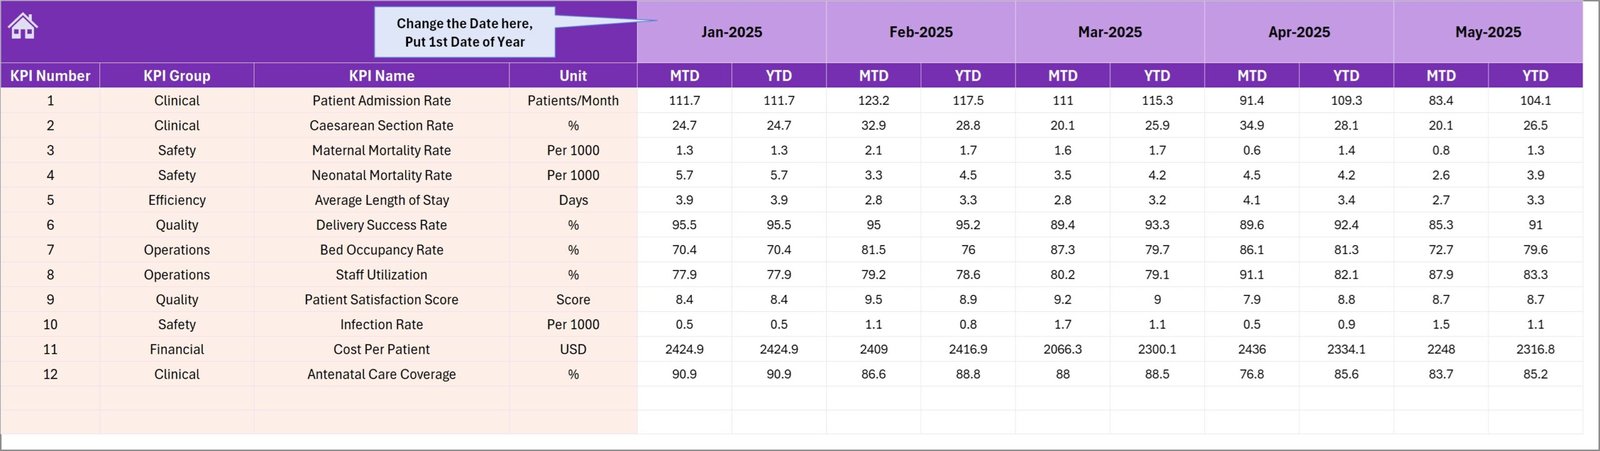
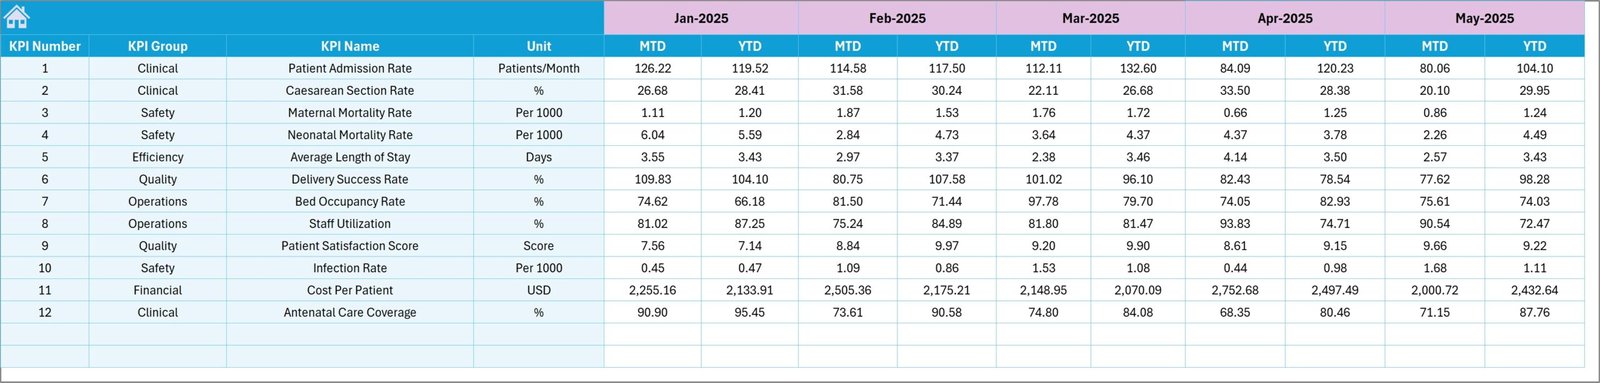
Actual Numbers Input Sheet
The Actual Numbers Input Sheet allows users to enter real hospital performance data.
Users can update the starting month of the year in cell E1. After that, they can enter actual values for each KPI.
This sheet records:
- Monthly KPI data
- Year-to-date KPI data
Because the dashboard automatically pulls data from this sheet, all reports update instantly.
Click to buy Maternity Hospitals KPI Dashboard in Excel
Target Sheet
The Target Sheet stores monthly and yearly KPI targets.
Hospital administrators can define the expected performance levels for each KPI.
Targets include:
- Monthly targets
- Year-to-date targets
Once targets are entered, the dashboard compares them with actual performance.
This comparison helps hospitals evaluate whether they meet operational goals.
Click to buy Maternity Hospitals KPI Dashboard in Excel
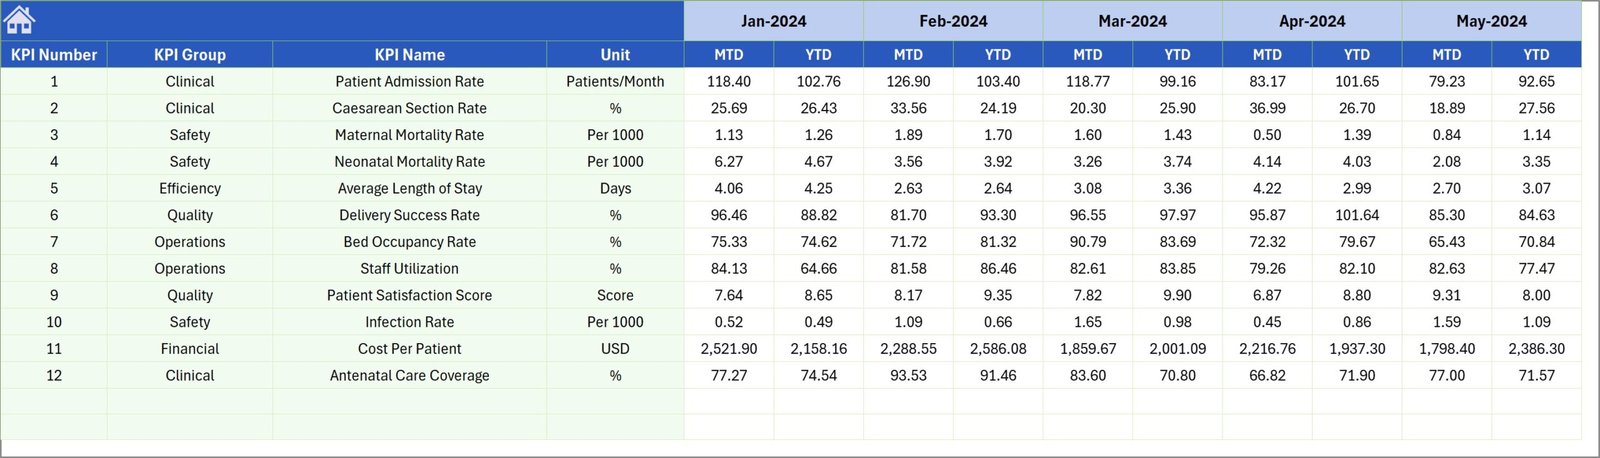
Previous Year Number Sheet
This sheet stores historical data from the previous year.
Hospital administrators can enter KPI values from the same period last year.
The dashboard then compares:
- Current year performance
- Previous year performance
This comparison helps identify long-term trends and improvement areas.
Click to buy Maternity Hospitals KPI Dashboard in Excel
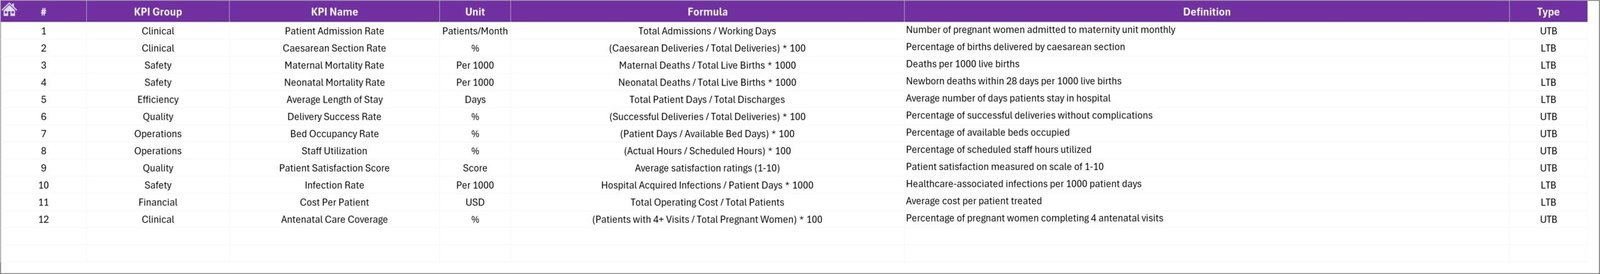
KPI Definition Sheet
The KPI Definition Sheet stores detailed KPI information.
Users must enter the following information:
- KPI Name
- KPI Group
- KPI Unit
- KPI Formula
- KPI Definition
Because this information appears in the trend sheet, users can clearly understand how each KPI works.
Click to buy Maternity Hospitals KPI Dashboard in Excel
How Does the Maternity Hospitals KPI Dashboard Work?
The dashboard follows a simple workflow that makes it easy to use.
Step 1: Define KPIs
First, administrators define KPIs in the KPI Definition Sheet.
Step 2: Enter Target Data
Next, managers enter KPI targets in the Target Sheet.
Step 3: Enter Actual Data
Hospital staff input monthly KPI values in the Actual Numbers Input Sheet.
Step 4: Enter Historical Data
Users enter previous year data in the Previous Year Sheet.
Step 5: Analyze Dashboard
Finally, users open the Dashboard Sheet and select the desired month.
The dashboard automatically displays KPI performance insights.
Advantages of the Maternity Hospitals KPI Dashboard in Excel
Hospitals gain many benefits from implementing KPI dashboards.
- Centralized Performance Monitoring
The dashboard collects all hospital KPIs in one place.
Therefore, administrators do not need to review multiple reports.
- Faster Decision-Making
Because managers can see performance data instantly, they can make faster decisions.
As a result, hospitals improve operational efficiency.
- Better Patient Care
Tracking healthcare KPIs helps hospitals identify issues quickly.
Consequently, doctors and staff can improve patient outcomes.
- Easy Data Management
Excel allows hospitals to manage data easily without complicated systems.
Therefore, even small hospitals can implement this dashboard.
- Historical Performance Comparison
The dashboard compares current data with previous year performance.
This comparison helps hospitals identify improvement trends.
- Customizable Dashboard
Excel dashboards allow easy customization.
Hospitals can add new KPIs, charts, and metrics whenever needed.
Best Practices for the Maternity Hospitals KPI Dashboard in Excel
Hospitals should follow several best practices to maximize the value of this dashboard.
- Select the Right KPIs
Choose KPIs that truly reflect hospital performance.
For example:
- Maternal mortality rate
- Delivery success rate
- Patient satisfaction
- Neonatal survival rate
- Update Data Regularly
Always update dashboard data consistently.
Regular updates ensure accurate reporting.
- Set Realistic Targets
Define achievable performance targets.
Unrealistic targets may lead to misleading performance evaluations.
- Train Staff
Hospital staff should understand how to update the dashboard.
Proper training ensures accurate data entry.
- Review Performance Monthly
Hospital management should review KPIs every month.
Regular reviews help identify problems early.
Who Can Use This KPI Dashboard?
Many healthcare professionals can benefit from this dashboard.
Examples include:
- Hospital Administrators
- Healthcare Managers
- Medical Directors
- Quality Control Teams
- Data Analysts
- Government Health Departments
Because the dashboard simplifies performance monitoring, it becomes valuable for both small clinics and large hospitals.
Conclusion
Healthcare organizations must continuously monitor performance to deliver safe and effective patient care. This requirement becomes even more critical in maternity hospitals, where the health of both mothers and newborns depends on high-quality medical services.
The Maternity Hospitals KPI Dashboard in Excel provides a powerful yet simple solution for tracking hospital performance. By organizing KPIs into interactive charts and reports, the dashboard enables administrators to monitor operations, evaluate outcomes, and improve decision-making.
Moreover, the dashboard allows hospitals to compare actual results with targets and historical data. This comparison helps management teams identify performance gaps and implement improvements.
Because the dashboard uses Excel, hospitals can easily customize it according to their needs. As a result, this tool becomes an affordable and effective performance monitoring solution for maternity healthcare facilities.
Frequently Asked Questions (FAQs)
What is a KPI in maternity hospitals?
A KPI (Key Performance Indicator) measures hospital performance related to maternal and newborn healthcare services.
Examples include delivery success rate, maternal mortality rate, and patient satisfaction.
Why do maternity hospitals use KPI dashboards?
Hospitals use KPI dashboards to monitor performance, track healthcare outcomes, and improve decision-making.
Can small hospitals use this Excel dashboard?
Yes. Because the dashboard runs in Excel, even small hospitals can use it without expensive software.
How often should hospitals update KPI data?
Hospitals should update KPI data monthly to maintain accurate performance tracking.
Can hospitals customize the dashboard?
Yes. Hospitals can add new KPIs, modify charts, and adjust calculations according to their requirements.
Visit our YouTube channel to learn step-by-step video tutorials
Watch the step-by-step video tutorial: