The media and entertainment industry moves at lightning speed. New content launches every week. Streaming platforms compete aggressively. Audiences switch preferences quickly. Meanwhile, production and marketing costs continue to rise.Therefore, media companies must track revenue, cost, profit, and viewer engagement in real time. However, many production houses and streaming businesses still rely on scattered spreadsheets. As a result, decision-makers waste time consolidating reports. Moreover, they often miss critical trends.So, how can media companies track performance across content types, platforms, and regions in one powerful system?You need a Media and Entertainment Dashboard in Power BI.In this complete guide, you will learn:
- What the Media and Entertainment Dashboard in Power BI is
- Why media companies need it
- Detailed explanation of all 5 dashboard pages
- Advantages of using this dashboard
- Best practices for implementation
- Frequently Asked Questions with answers
Click to buy Media and Entertainment Dashboard in Power BI
What Is a Media and Entertainment Dashboard in Power BI?
A Media and Entertainment Dashboard in Power BI is an interactive analytics solution designed for film studios, streaming platforms, TV networks, and digital media companies.
It transforms raw financial and performance data into clear visual insights. Instead of juggling multiple Excel files, managers get everything in one centralized dashboard.
This dashboard helps you:
- Track revenue in USD
- Monitor production and marketing costs
- Measure profit and profit margin %
- Analyze average viewer rating
- Compare performance by content type, platform, and region
- Identify monthly trends
Therefore, leadership teams can take faster and smarter decisions.
Why Do Media and Entertainment Companies Need This Dashboard?
The entertainment business runs on numbers. However, creativity alone does not guarantee success.
Here is the challenge:
- Production budgets often exceed projections.
- Marketing campaigns increase costs.
- Some genres perform better in certain regions.
- Platforms generate different profit margins.
- Viewer ratings influence renewal decisions.
Without a structured dashboard, companies struggle to connect these insights.
On the other hand, Power BI allows you to visualize complex data instantly. Consequently, you reduce reporting time and improve strategy.
Detailed Explanation of All 5 Dashboard Pages
Now, let us explore each page of the Media and Entertainment Dashboard in Power BI.
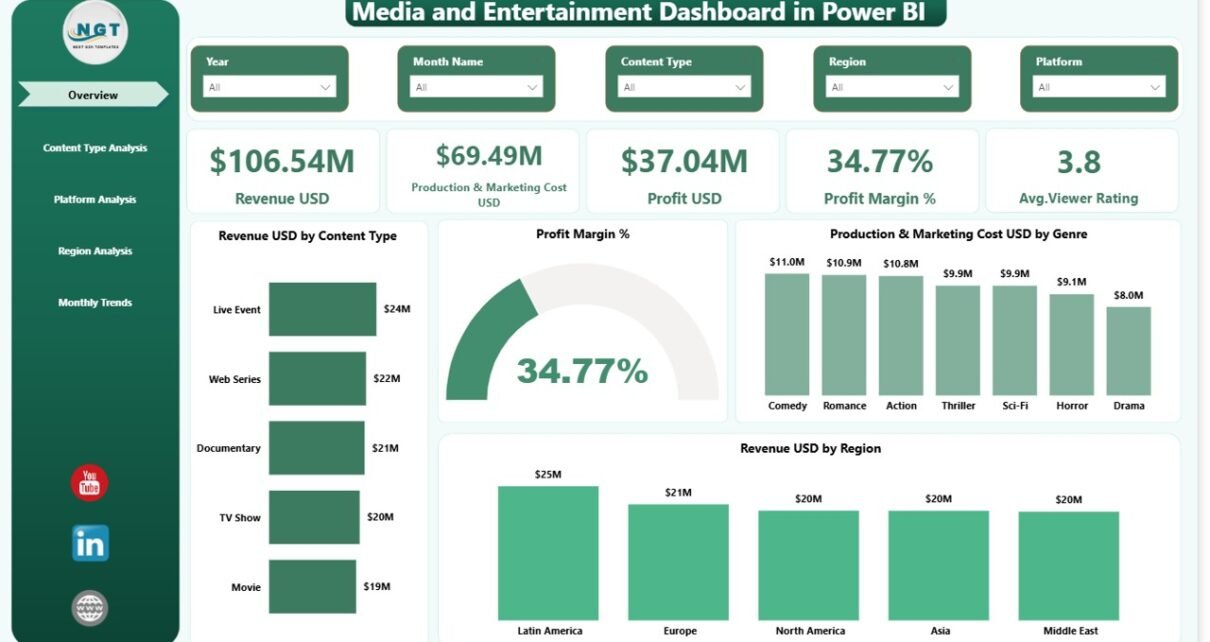
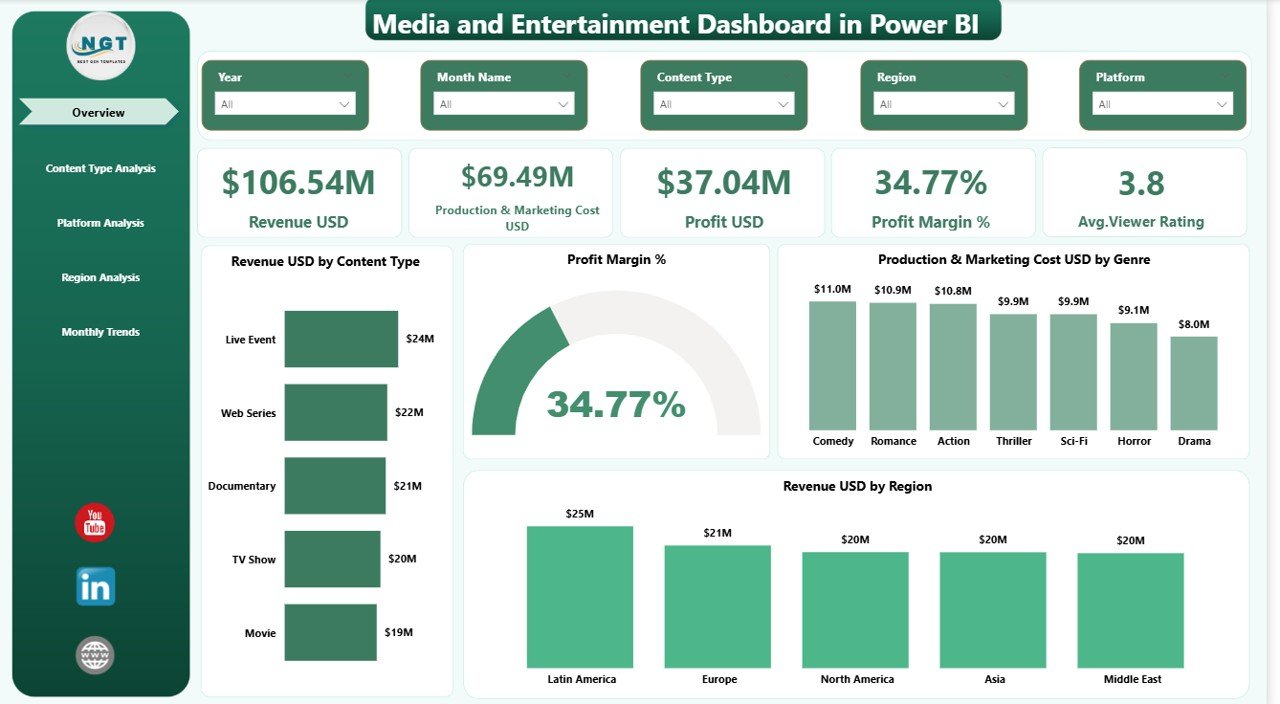
Overview Page – What Does It Show?
The Overview Page acts as the command center of the dashboard.
Here, you see slicers at the top. These slicers allow you to filter data by content type, region, or platform. Therefore, you control the analysis instantly.
Key KPI Cards on Overview Page
This page includes 5 powerful KPI cards:
- Revenue (USD)
- Production & Marketing Cost (USD)
- Profit (USD)
- Profit Margin %
- Average Viewer Rating
These cards give you a quick performance snapshot.
Visual Charts on Overview Page
In addition, you see important charts such as:
- Revenue by Content Type
- Profit Margin %
- Production & Marketing Cost by Genre
- Revenue by Region
Therefore, within seconds, you understand which content type earns the highest revenue and which region drives profitability.
Click to buy Media and Entertainment Dashboard in Power BI
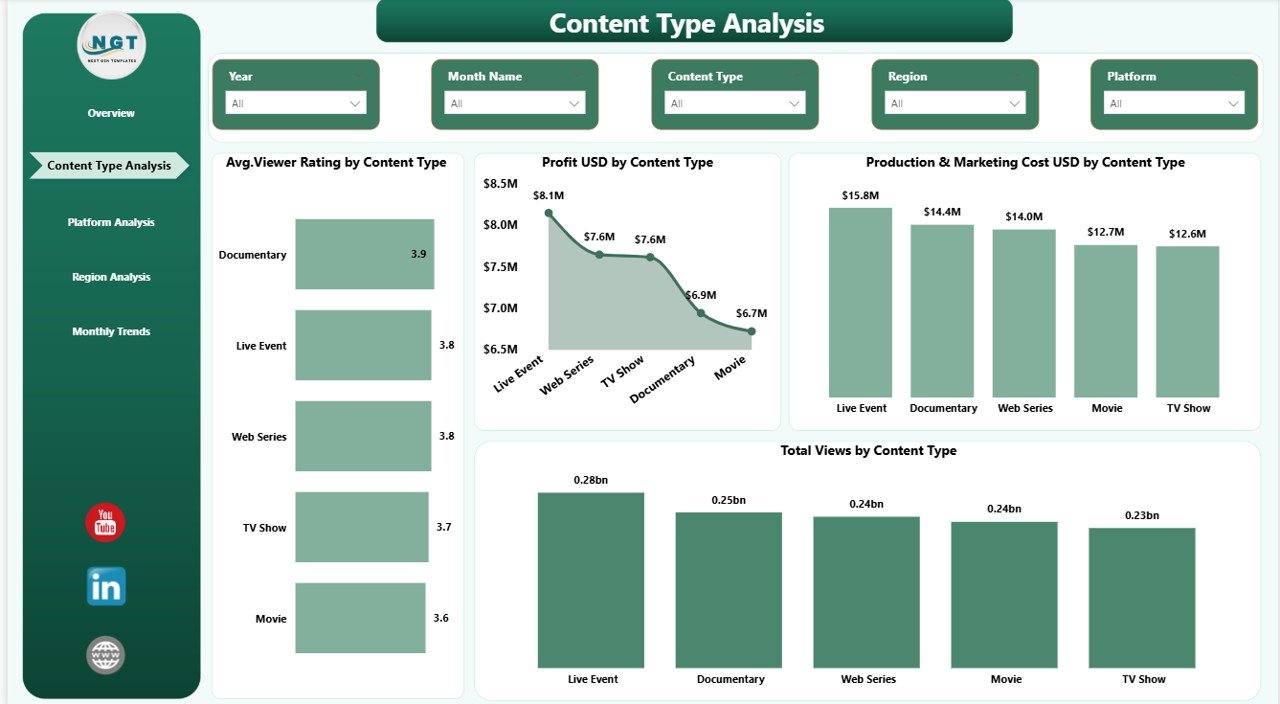
Content Type Analysis – Which Content Performs Best?
Content type plays a major role in entertainment success.
This page helps you compare:
- Movies
- Web Series
- TV Shows
- Documentaries
- Reality Shows
Key Charts in Content Type Analysis
- Average Viewer Rating by Content Type
- Profit (USD) by Content Type
- Production & Marketing Cost (USD) by Content Type
- Total Viewers by Content Type
For example, suppose web series generate high viewer ratings but lower profit margins. In that case, you can adjust marketing strategy.
Therefore, you make data-backed content investment decisions.
Click to buy Media and Entertainment Dashboard in Power BI
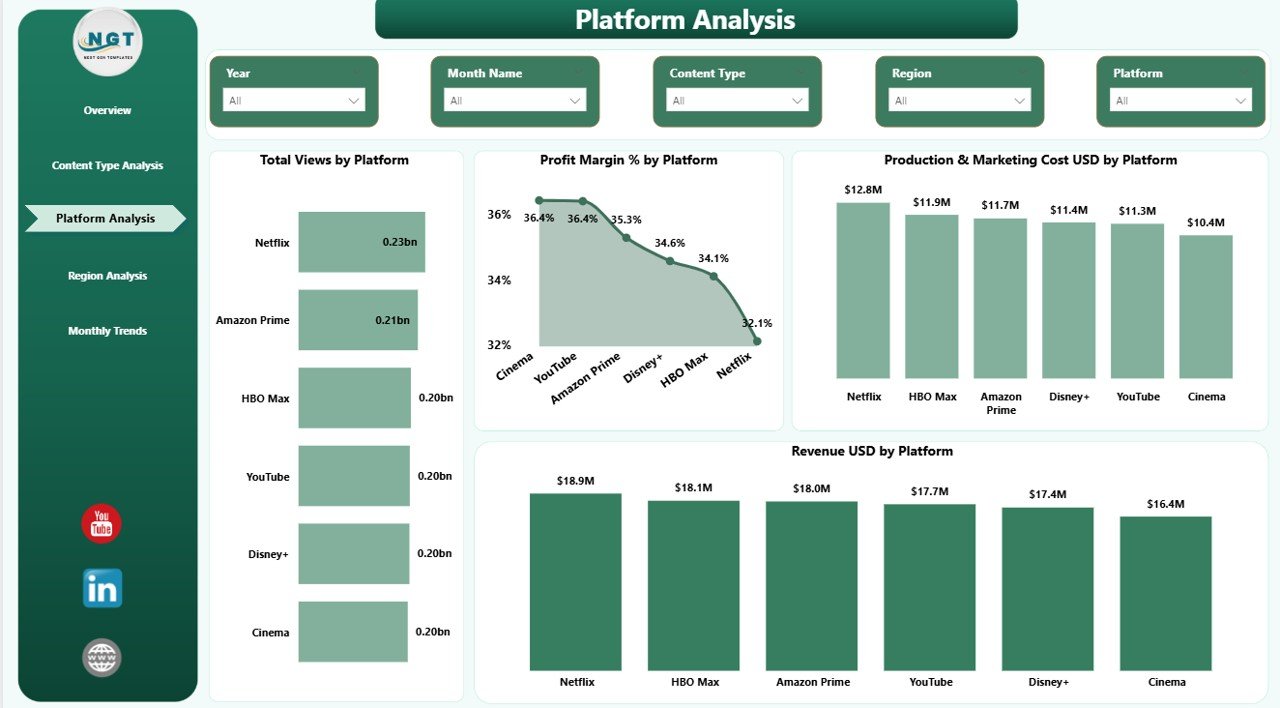
Platform Analysis – Which Platform Generates More Profit?
Today, audiences consume content across multiple platforms.
- OTT platforms
- Cinema
- Television
- YouTube
- Digital Apps
However, each platform shows different cost structures and revenue models.
This page includes:
- Total Views by Platform
- Profit Margin % by Platform
- Production & Marketing Cost by Platform
- Revenue by Platform
For instance, OTT may show high revenue but also high marketing costs. Meanwhile, television might deliver steady profit margins.
Thus, executives can allocate budgets wisely.
Click to buy Media and Entertainment Dashboard in Power BI
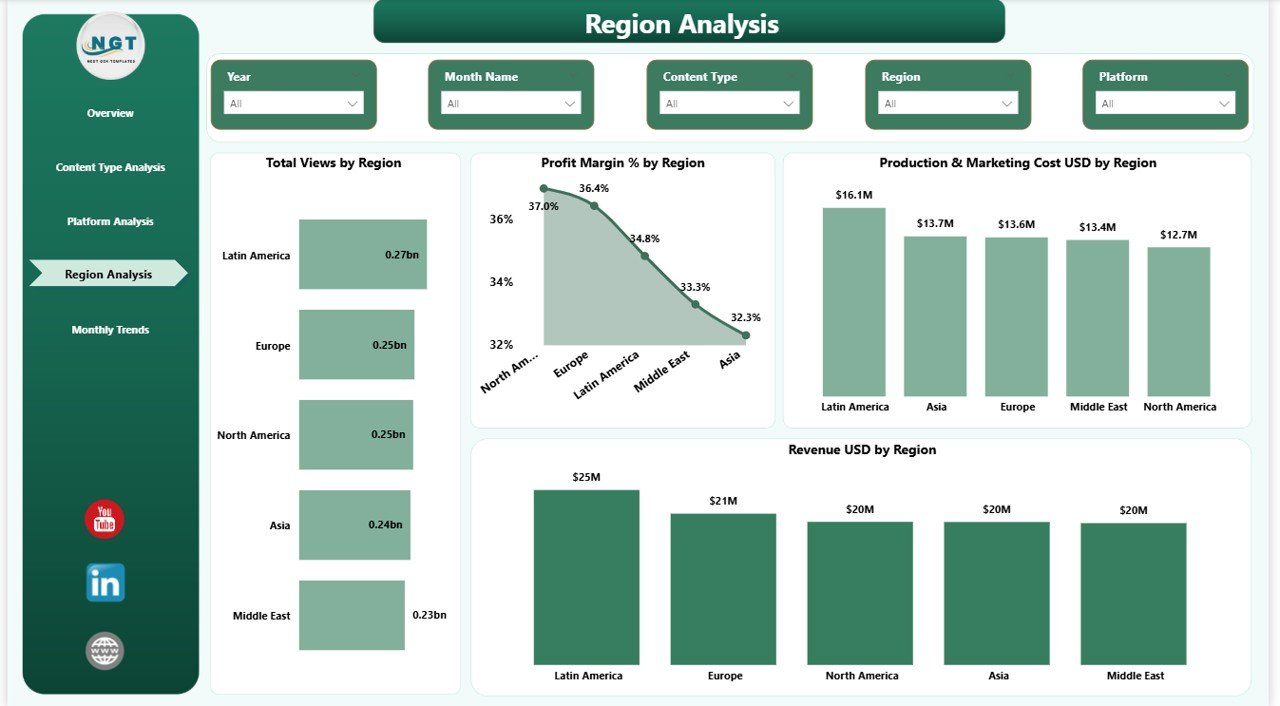
Region Analysis – Where Does Content Perform Better?
Global expansion increases revenue opportunities. However, each region behaves differently.
Some regions prefer action content. Others prefer drama or comedy.
This page includes:
- Total Views by Region
- Profit Margin % by Region
- Production & Marketing Cost by Region
- Revenue by Region
Therefore, you identify high-performing markets.
For example:
- North America may generate strong revenue.
- Asia-Pacific may show rapid viewer growth.
- Europe may offer stable margins.
Consequently, marketing teams can focus campaigns strategically.
Click to buy Media and Entertainment Dashboard in Power BI
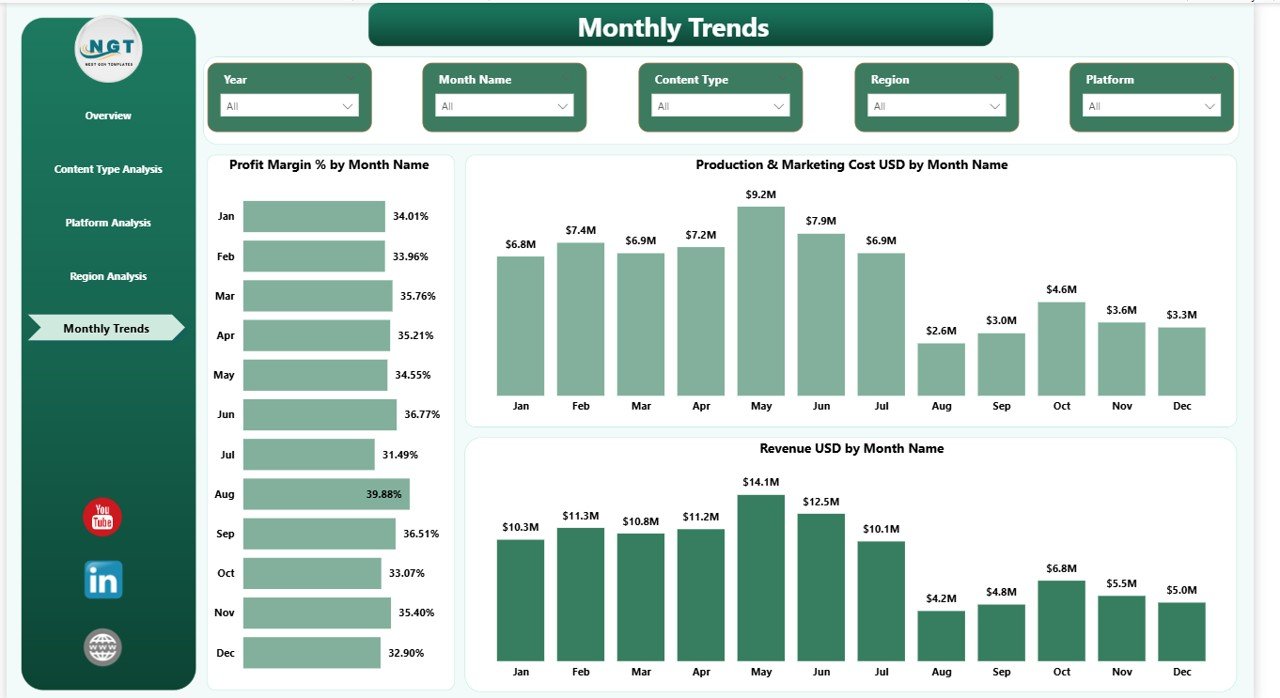
Monthly Trends – Are Performance Metrics Improving?
Monthly trends reveal patterns that daily reports cannot show.
This final page includes:
- Profit Margin % by Month
- Production & Marketing Cost (USD) by Month
- Revenue (USD) by Region
When you monitor monthly trends, you:
- Identify seasonal spikes
- Detect cost overruns early
- Track revenue growth
- Plan future releases
Therefore, long-term strategy becomes easier.
Click to buy Media and Entertainment Dashboard in Power BI
Advantages of Media and Entertainment Dashboard in Power BI
Using this dashboard delivers powerful benefits.
Centralized Reporting
You see all KPIs in one place. Consequently, you avoid manual consolidation.
Faster Decision-Making
Since visuals update instantly, leadership teams act quickly.
Improved Profitability Tracking
You compare cost vs revenue clearly. Therefore, you protect margins.
Better Content Investment Decisions
You identify profitable content types. Thus, you invest smarter.
Real-Time Performance Monitoring
You track viewer ratings, revenue, and profit continuously.
Enhanced Regional Strategy
You analyze regional demand. As a result, you improve distribution strategy.
How Does This Dashboard Improve Revenue and Profit?
Let us break it down.
- It highlights high-revenue content types.
- It identifies low-margin platforms.
- It tracks cost spikes immediately.
- It connects viewer ratings with profit.
Therefore, management can:
- Stop underperforming projects early
- Boost marketing for trending content
- Negotiate better platform contracts
- Expand in high-growth regions
Best Practices for the Media and Entertainment Dashboard in Power BI
To get maximum value, follow these best practices.
Maintain Clean Data
Ensure accurate revenue, cost, and viewer data. Because poor data reduces reliability.
Update Data Regularly
Refresh data weekly or monthly. Consequently, you maintain accuracy.
Use Clear KPI Definitions
Define revenue, profit, and cost clearly. Therefore, all teams align on metrics.
Train Teams on Dashboard Usage
Educate managers and analysts. As a result, they use slicers and filters effectively.
Monitor Trends, Not Just Snapshots
Focus on monthly patterns. Thus, you build long-term strategies.
Customize Based on Business Model
Streaming platforms, film studios, and TV networks may need slight adjustments. Therefore, tailor the dashboard accordingly.
Who Can Use This Dashboard?
This dashboard suits:
- Film production companies
- Streaming platforms
- OTT providers
- TV networks
- Media investors
- Digital content creators
Moreover, financial analysts and marketing teams also benefit from it.
How to Implement the Media and Entertainment Dashboard in Power BI?
Follow these steps:
- Collect revenue, cost, rating, and viewership data.
- Organize data into structured tables.
- Import data into Power BI Desktop.
- Create relationships between tables.
- Build DAX measures for revenue, cost, profit, and margin.
- Design interactive visuals.
- Add slicers for filtering.
- Publish to Power BI Service.
After implementation, monitor KPIs regularly.
Conclusion
The entertainment industry evolves rapidly. Therefore, companies must rely on data-driven decisions.
A Media and Entertainment Dashboard in Power BI provides clarity across revenue, cost, profit, ratings, platforms, and regions. Moreover, it simplifies complex data into easy visuals.
As a result, media companies improve profitability, optimize production budgets, and enhance audience engagement.
If you want to stay competitive in today’s dynamic market, you must embrace structured analytics. And this dashboard gives you exactly that advantage.
Frequently Asked Questions (FAQs)
What is a Media and Entertainment Dashboard in Power BI?
It is an interactive dashboard that tracks revenue, cost, profit, viewer ratings, and performance across content types, platforms, and regions.
Can streaming platforms use this dashboard?
Yes. Streaming platforms can track subscriber-based revenue, content profitability, and viewer engagement easily.
Does this dashboard support monthly trend analysis?
Yes. It includes a dedicated Monthly Trends page for monitoring revenue, cost, and profit margin over time.
Is Power BI suitable for media analytics?
Absolutely. Power BI offers interactive visuals, DAX calculations, and real-time updates. Therefore, it suits media analytics perfectly.
Can small production houses use this dashboard?
Yes. Small and medium studios can use it to track budget control and content performance efficiently.
How often should companies update this dashboard?
Companies should update it weekly or monthly. Regular updates ensure accurate decision-making.
Watch the step-by-step video tutorial:
Click to buy Media and Entertainment Dashboard in Power BI
Visit our YouTube channel to learn step-by-step video tutorials