In today’s competitive healthcare manufacturing sector, success depends on efficiency, quality, and compliance. Medical equipment manufacturers must continuously monitor production metrics, safety standards, and delivery timelines to stay ahead. A Medical Equipment Manufacturing KPI Dashboard in Power BI serves as a powerful digital solution that consolidates these performance indicators into a single, interactive platform.
This ready-to-use dashboard transforms raw Excel data into visual insights, helping production heads, quality managers, and executives make faster, data-driven decisions. In this article, we’ll explore everything about the dashboard — from its structure and features to its benefits, best practices, and frequently asked questions.
Click to Purchases Medical Equipment Manufacturing KPI Dashboard in Power BI
What Is a Medical Equipment Manufacturing KPI Dashboard in Power BI?
A Medical Equipment Manufacturing KPI Dashboard in Power BI is an interactive performance-tracking tool that helps monitor critical metrics across production, quality control, supply chain, and maintenance.
Instead of relying on scattered spreadsheets, this dashboard brings all key data into one visual interface. It displays Month-to-Date (MTD) and Year-to-Date (YTD) performance, compares results with targets, and highlights trends against previous years — making it easy to spot issues and optimize operations.
This dashboard is especially designed for:
-
Production Managers who need visibility into output, defects, and efficiency.
-
Quality Assurance Teams tracking compliance and rework rates.
-
Executives analyzing overall plant performance and profitability.
-
Supply Chain Professionals monitoring on-time delivery, cost, and vendor performance.
Built in Microsoft Power BI, the dashboard seamlessly connects with Excel data sources and automatically refreshes metrics, providing real-time insights for better control and decision-making.
Click to Purchases Medical Equipment Manufacturing KPI Dashboard in Power BI
Structure of the Dashboard
The Medical Equipment Manufacturing KPI Dashboard is structured into three interactive pages within the Power BI desktop application. Each page serves a specific analytical purpose and offers detailed insights through charts, tables, and KPI cards.
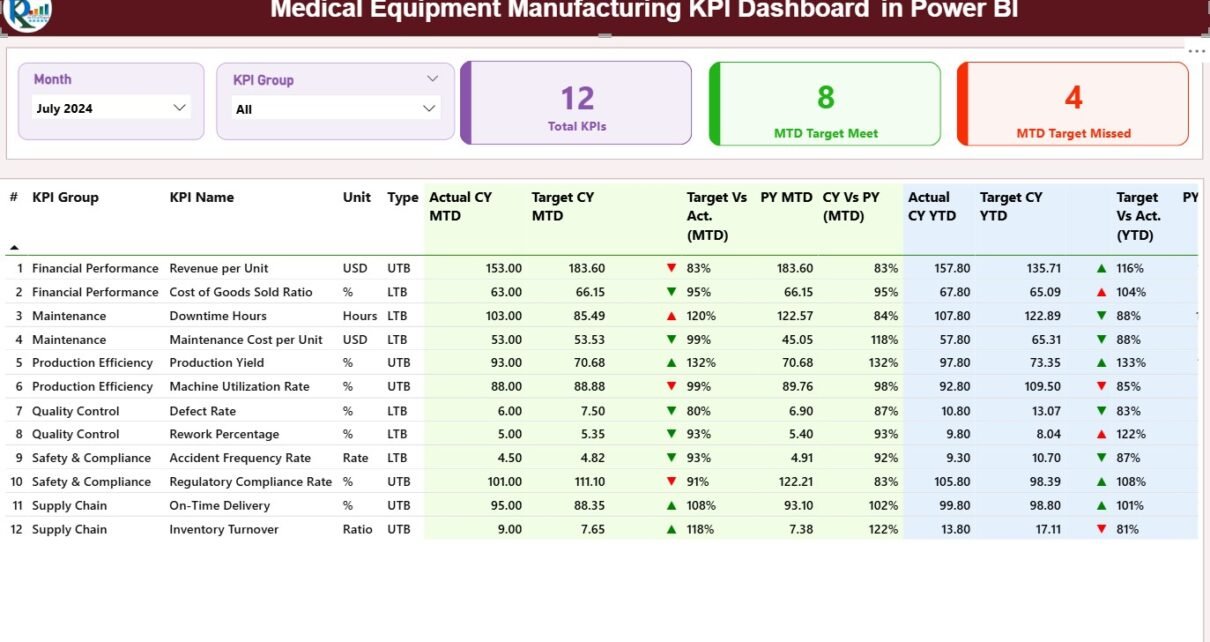
1. Summary Page — The Command Center

The Summary Page acts as the central hub of the dashboard. It provides an instant snapshot of all KPIs in one place.
Key Components:
-
Slicers:
At the top, you’ll find two slicers — one for Month and one for KPI Group. These slicers allow users to filter data dynamically and focus on specific time periods or categories such as production, quality, or maintenance. -
KPI Cards:
Three cards summarize high-level performance indicators:-
Total KPIs Count — Total number of KPIs tracked.
-
MTD Target Met Count — Number of KPIs that achieved the target this month.
-
MTD Target Missed Count — Number of KPIs below the target threshold.
-
-
Detailed KPI Table:
A comprehensive table below the cards displays all KPI metrics in one view.
Columns include:-
KPI Number: Unique identifier for each KPI.
-
KPI Group: The performance category (Production, Quality, Supply Chain, etc.).
-
KPI Name: The name of the metric (e.g., Production Yield %, Downtime Hours).
-
Unit: Measurement unit (e.g., %, Hours, Units).
-
Type: Classification as Lower the Better (LTB) or Upper the Better (UTB).
-
Actual CY MTD / Target CY MTD: Actual vs. Target Month-to-Date values.
-
MTD Icon: Visual indicator (▲ green for achieved, ▼ red for missed).
-
Target vs. Actual (MTD): Percentage ratio of performance against target.
-
PY MTD / CY vs. PY (MTD): Previous year comparisons for benchmarking progress.
-
Actual CY YTD / Target CY YTD: Year-to-Date actuals and targets.
-
YTD Icon: Visual performance indicator for YTD status.
-
Target vs. Actual (YTD): YTD achievement percentage.
-
PY YTD / CY vs. PY (YTD): Comparison of current vs. previous YTD performance.
-
These tables use conditional formatting to highlight strong or weak performance visually, making it easier for management to interpret results at a glance.
Click to Purchases Medical Equipment Manufacturing KPI Dashboard in Power BI
2. KPI Trend Page — Visualizing Performance Over Time

The KPI Trend Page focuses on the temporal aspect of performance. It lets users monitor trends for selected KPIs and understand their month-wise fluctuations.
Key Highlights:
-
Interactive Slicer:
A slicer on the left allows users to select a specific KPI name for analysis. -
Dual Combo Charts:
Two combo charts show:-
MTD Chart: Displays the actual, target, and previous year’s MTD values.
-
YTD Chart: Shows cumulative YTD performance compared with targets and previous year data.
-
These visuals help identify patterns, detect anomalies, and assess the impact of process improvements or external factors like material shortages or regulatory changes.
3. KPI Definition Page — The Insightful Drill-Through View

The KPI Definition Page provides detailed documentation for each KPI. This page remains hidden in the dashboard but can be accessed through drill-through navigation from the Summary Page.
When a user clicks on a KPI in the table and drills through, the dashboard reveals:
-
Formula Used — The calculation logic for the KPI.
-
Definition — A clear explanation of what the KPI measures and why it matters.
-
Type (LTB/UTB) — Whether higher or lower values indicate better performance.
A Back Button at the top-left corner allows users to return easily to the Summary Page.
Excel Data Integration
The dashboard uses Excel files as data sources, which makes it flexible and easy to update. The Excel workbook consists of three main worksheets.
1. Input_Actual Sheet
This sheet captures the actual numbers for each KPI:
-
Columns: KPI Name, Month (first date of month), MTD Value, YTD Value.
-
Users enter fresh data monthly, ensuring the dashboard reflects up-to-date figures.
2. Input_Target Sheet
Here, users record the target values for each KPI:
-
Columns: KPI Name, Month (first date of month), MTD Target, YTD Target.
-
Targets serve as benchmarks for evaluating performance.
3. KPI Definition Sheet
This sheet stores the reference data for KPIs:
-
Columns: KPI Number, KPI Group, KPI Name, Unit, Formula, Definition, Type (LTB/UTB).
-
It acts as the master dictionary, ensuring consistency across all dashboard pages.
With Power BI’s automatic refresh capability, any update in these Excel files immediately reflects in the dashboard.
Click to Purchases Medical Equipment Manufacturing KPI Dashboard in Power BI
Advantages of Medical Equipment Manufacturing KPI Dashboard in Power BI
Let’s look at the major benefits this dashboard offers:
1. Centralized Performance Monitoring
All critical metrics are consolidated into one view, eliminating the need for multiple reports and manual tracking.
2. Real-Time Insights
Since Power BI can connect live to Excel or SQL databases, you get real-time visibility into your production efficiency and quality metrics.
3. Enhanced Decision-Making
The use of color-coded visuals and KPI cards allows managers to instantly detect underperforming areas and take corrective action.
4. Improved Accuracy and Accountability
Manual reporting errors are minimized. Every KPI has a documented formula and definition for transparent performance evaluation.
5. Comparative Analysis
The dashboard highlights Current vs. Target and Current vs. Previous Year performance, supporting strategic planning and continuous improvement.
6. Easy Integration
As the dashboard reads from Excel, it’s compatible with existing systems and requires no complex database setup.
7. Time Savings
Automated updates and prebuilt visuals save hours of manual reporting and allow teams to focus on strategic decisions.
Use Cases of the Dashboard
-
Production Control: Monitor production yield, downtime, and utilization.
-
Quality Management: Track defects, rework rates, and complaint resolution time.
-
Regulatory Compliance: Ensure manufacturing meets medical device standards.
-
Maintenance Tracking: Analyze MTBF and MTTR to prevent unexpected breakdowns.
-
Cost Management: Compare actual production costs versus targets.
-
Supply Chain Optimization: Measure on-time deliveries and supplier performance.
This versatility makes the dashboard suitable for OEM manufacturers, medical device assemblers, and contract manufacturing organizations.
How to Use the Dashboard Effectively
-
Update Excel Data Regularly:
Keep your Actual and Target sheets up to date every month. -
Refresh Power BI File:
Use the “Refresh” button in Power BI to update visuals with the latest data. -
Apply Slicers:
Filter by month, region, or KPI group for focused analysis. -
Drill-Through KPIs:
Explore KPI details to understand root causes and trends. -
Export Insights:
Share summary pages as PDFs or PowerPoint slides with stakeholders.
Best Practices for the Medical Equipment Manufacturing KPI Dashboard
To get the best out of your Power BI dashboard, follow these proven best practices:
1. Standardize KPI Definitions
Ensure all departments use consistent formulas and units for every KPI to avoid confusion.
2. Focus on Actionable Metrics
Prioritize KPIs that directly influence productivity, cost, or compliance. Avoid unnecessary or redundant indicators.
3. Maintain Data Quality
Double-check Excel entries for accuracy. Clean data ensures reliable insights.
4. Use Conditional Formatting Wisely
Leverage Power BI’s icons, colors, and thresholds to highlight key results without cluttering visuals.
5. Schedule Regular Reviews
Set weekly or monthly review meetings based on dashboard outputs to foster continuous improvement.
6. Protect Sensitive Data
Apply row-level security and limit access to critical financial or production data.
7. Automate Refresh
Schedule automatic refreshes in Power BI Service to ensure stakeholders always see the latest numbers.
Why Power BI for Medical Equipment Manufacturing Analytics?
Power BI offers flexibility, scalability, and integration unmatched by traditional tools.
-
Interactive Visualization: Easily switch between charts, filters, and time frames.
-
Data Connectivity: Connect to Excel, SQL, ERP, or cloud data sources.
-
Collaboration: Share dashboards securely with team members or clients.
-
AI Insights: Built-in AI capabilities highlight trends and anomalies automatically.
-
Accessibility: View dashboards on desktops, tablets, or mobile devices.
These features make Power BI the ideal platform for any medical manufacturing organization striving for efficiency and transparency.
Click to Purchases Medical Equipment Manufacturing KPI Dashboard in Power BI
Conclusion
The Medical Equipment Manufacturing KPI Dashboard in Power BI is more than just a reporting tool — it’s a strategic asset. It empowers organizations to visualize performance, track efficiency, and improve decision-making. By automating data collection and analysis, it eliminates manual work, reduces errors, and enhances productivity.
Whether you’re managing production lines, monitoring compliance, or optimizing costs, this dashboard helps align your team’s actions with business goals. In a sector where precision, safety, and quality are non-negotiable, Power BI becomes the backbone of effective data management and performance excellence.
Frequently Asked Questions (FAQs)
1. What KPIs are most important in medical equipment manufacturing?
Key KPIs include Production Yield %, Defect Rate, Downtime Hours, MTBF, MTTR, On-Time Delivery %, and Production Cost per Unit. These metrics ensure high-quality production and compliance with regulatory standards.
2. Can I connect this Power BI dashboard to live databases?
Yes. Although the template uses Excel by default, you can connect it to SQL Server, ERP systems, or cloud databases for live data refreshes.
3. How often should I update the Excel data?
For optimal accuracy, update Actual and Target values at least once a month, preferably after the accounting or reporting period closes.
4. Can multiple users view the dashboard simultaneously?
Absolutely. When published to Power BI Service, authorized users can access the dashboard securely through web browsers or mobile apps.
5. Do I need coding knowledge to use this dashboard?
No. The dashboard is completely no-code and user-friendly. You can navigate, filter, and drill through without any technical expertise.
6. How does this dashboard help in compliance management?
It helps track quality, safety, and operational KPIs that align with ISO and FDA standards, ensuring every process stays compliant.
7. Can I customize the KPIs or visual design?
Yes. Power BI allows full customization — you can add or remove KPIs, adjust chart colors, or integrate new visuals to suit your reporting preferences.
Click to Purchases Medical Equipment Manufacturing KPI Dashboard in Power BI
Visit our YouTube channel to learn step-by-step video tutorials