In today’s digital world, meme marketing and viral content play a huge role in brand visibility, audience engagement, and online growth. Social media platforms such as Instagram, TikTok, YouTube, Twitter, and Facebook thrive on viral content that spreads rapidly across audiences. Meme and Viral Content Creation Dashboard in Power BI Because of this, businesses, influencers, and digital marketing teams constantly create memes and viral posts to increase engagement and brand awareness.
Meme and Viral Content Creation Dashboard in Power BI However, managing viral content performance can become challenging. Teams often publish dozens or even hundreds of posts across different platforms, languages, and topics. Without a structured analytics system, it becomes difficult to track which content performs well, which platform drives revenue, and how marketing investments impact profitability.
Therefore, organizations need a powerful analytics tool that tracks meme content performance, revenue generation, ad spending, and engagement trends.
One effective solution is the Meme and Viral Content Creation Dashboard in Power BI. This interactive dashboard helps content creators, marketing teams, and social media managers analyze viral content performance and make data-driven decisions.
Instead of analyzing scattered reports, users can monitor all important KPIs from one centralized Power BI dashboard.
In this detailed guide, you will learn:
-
What a Meme and Viral Content Creation Dashboard in Power BI is
-
Why content creators need performance dashboards
-
Key features of the dashboard
-
Important KPIs for viral content creation
-
Advantages of using Power BI for content analytics
-
Best practices for viral content performance monitoring
-
Practical use cases for digital creators and businesses
Let us explore everything step by step.
Click to Purchases Meme and Viral Content Creation Dashboard in Power BI
What is a Meme and Viral Content Creation Dashboard in Power BI?
A Meme and Viral Content Creation Dashboard in Power BI is a data visualization tool designed to track and analyze the performance of viral content campaigns.
Content creators publish memes, short videos, and trending posts to capture audience attention. However, tracking the performance of these posts requires structured analytics.
The Power BI dashboard helps organizations monitor metrics such as:
-
Content reach and trending percentage
-
Revenue generated from content
-
Profit margins
-
Advertising spending
-
Platform performance
-
Content category performance
Because Power BI converts raw data into interactive visual reports, teams can easily identify successful content strategies.
As a result, organizations can optimize their content creation process.
Click to Purchases Meme and Viral Content Creation Dashboard in Power BI
Why Do Content Creators Need a Viral Content Dashboard?
Content marketing and meme marketing rely heavily on performance analytics. Without data insights, creators cannot understand which content drives engagement and revenue.
A dashboard provides a clear overview of performance.
Key reasons organizations need a viral content dashboard
Track content performance
Teams can monitor how viral content performs across different categories.
Measure revenue impact
Organizations can track revenue generated from viral campaigns.
Analyze ad spending
The dashboard shows how advertising investments influence profitability.
Monitor trending content
Managers can identify which content types trend more frequently.
Improve content strategy
Data insights help teams create more engaging and profitable content.
Click to Purchases Meme and Viral Content Creation Dashboard in Power BI
Key Features of Meme and Viral Content Creation Dashboard in Power BI
The Meme and Viral Content Creation Dashboard in Power BI includes multiple pages designed to analyze viral content performance from different perspectives.
This dashboard includes five pages within the Power BI Desktop application.
1. Overview Page (Main Dashboard)
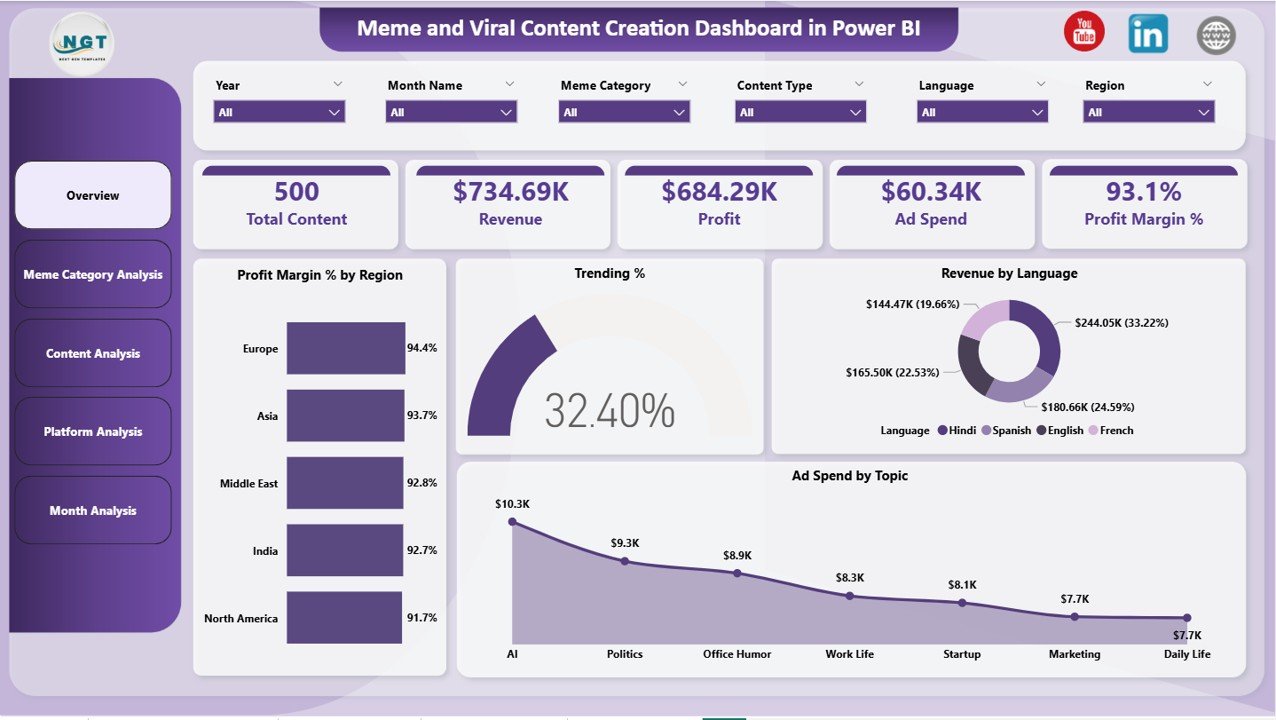
The Overview Page serves as the main performance monitoring page.
It provides a summary of viral content performance across all platforms and categories.
KPI Cards
The dashboard includes five KPI cards that display important performance metrics.
These include:
-
Total Content – Total number of posts created
-
Revenue – Total revenue generated from content
-
Profit – Total profit generated
-
Ad Spend – Total advertising investment
-
Profit Margin % – Profit percentage based on revenue and cost
These KPIs help managers quickly evaluate campaign performance.
Charts on Overview Page
The overview page includes four visual charts.
Profit Margin % by Region
This chart shows profitability across different geographic regions.
Trending %
This chart highlights the percentage of content that becomes trending or viral.
Revenue by Language
This chart helps analyze revenue performance based on language categories.
Ad Spend by Topic
This chart displays how advertising budgets distribute across different content topics.
These visuals help managers understand global content performance quickly.
Click to Purchases Meme and Viral Content Creation Dashboard in Power BI
2. Meme Category Analysis Page
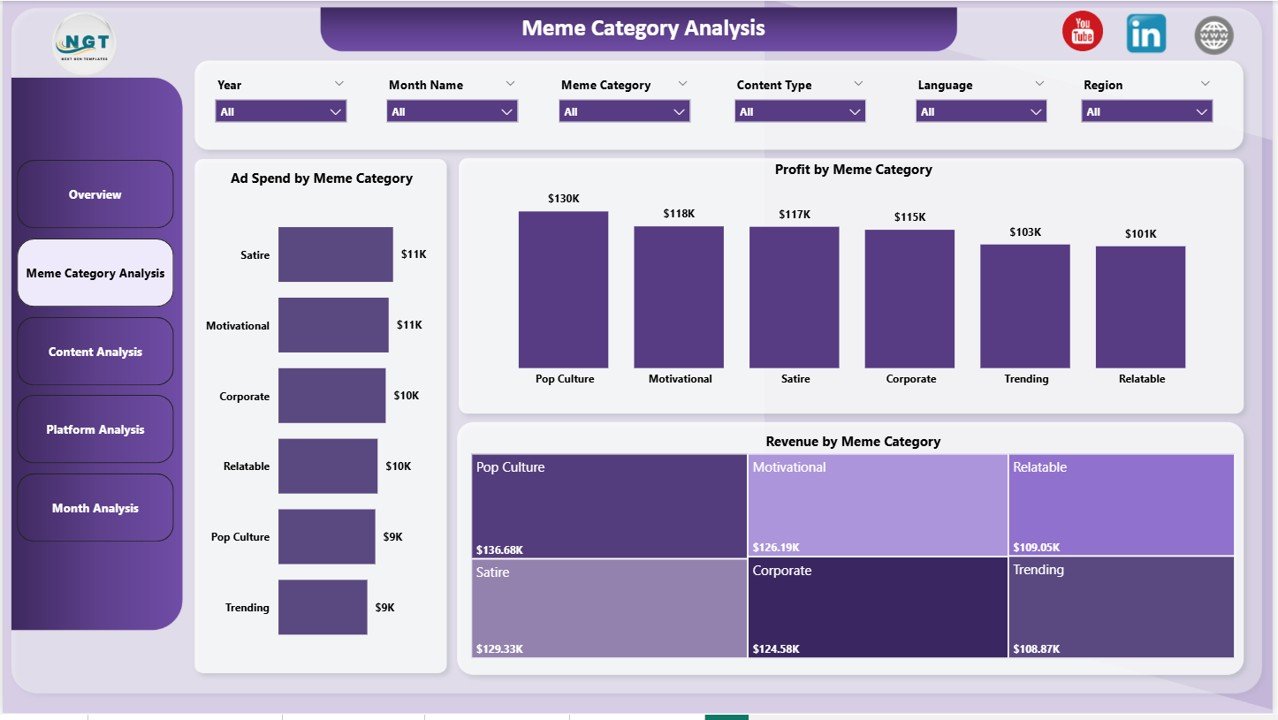
The Meme Category Analysis Page analyzes performance based on meme categories.
Different meme formats often generate different engagement levels. Therefore, analyzing performance by category helps teams refine their content strategy.
Charts on Meme Category Page
This page includes three charts.
Ad Spend by Meme Category
Shows advertising investment across meme categories.
Profit by Meme Category
Highlights which meme categories generate the highest profits.
Revenue by Meme Category
Displays revenue distribution across meme formats.
These insights help marketers invest more in profitable content types.
Click to Purchases Meme and Viral Content Creation Dashboard in Power BI
3. Content Analysis Page
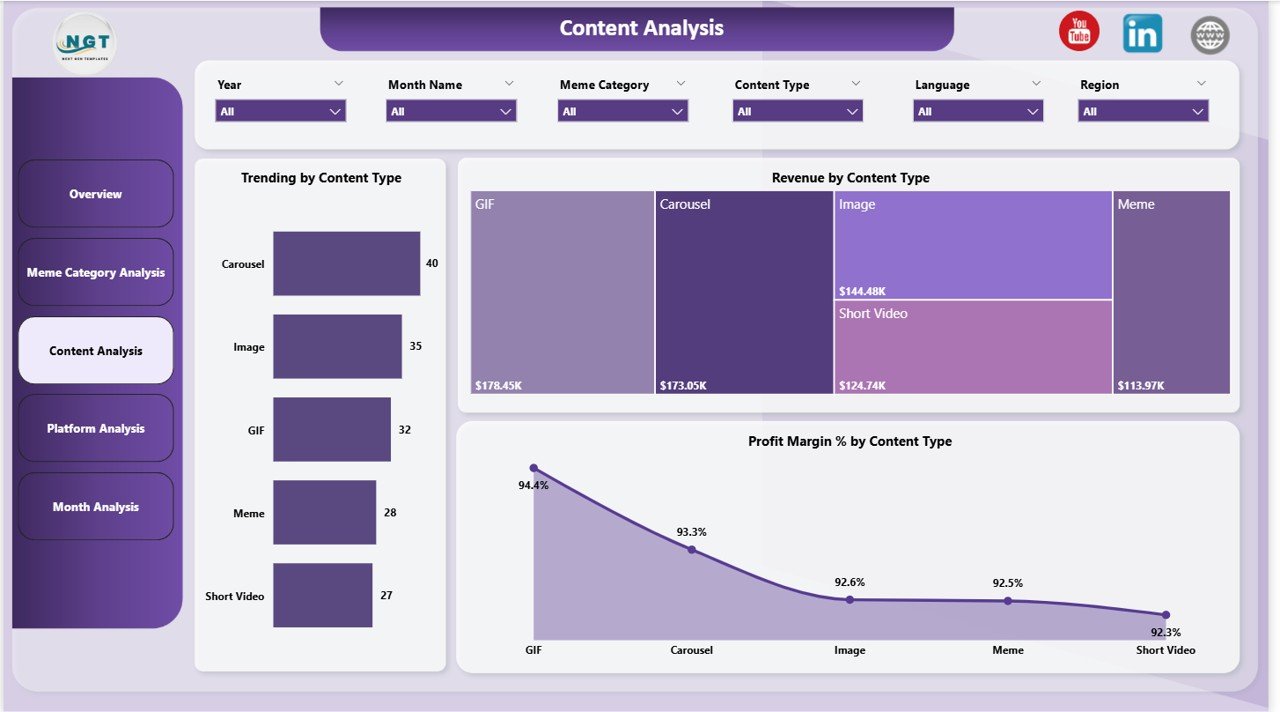
The Content Analysis Page focuses on performance across different content formats.
Content creators publish various types of posts such as:
-
Short videos
-
GIFs
-
Static memes
-
Reaction memes
-
Educational memes
Analyzing these formats helps teams identify the most effective content type.
Charts on Content Analysis Page
This page includes three charts.
Trending by Content Type
Shows which content formats trend the most.
Revenue by Content Type
Displays which content formats generate the highest revenue.
Profit Margin % by Content Type
Highlights profitability across content types.
These insights help creators prioritize successful formats.
Click to Purchases Meme and Viral Content Creation Dashboard in Power BI
4. Platform Analysis Page
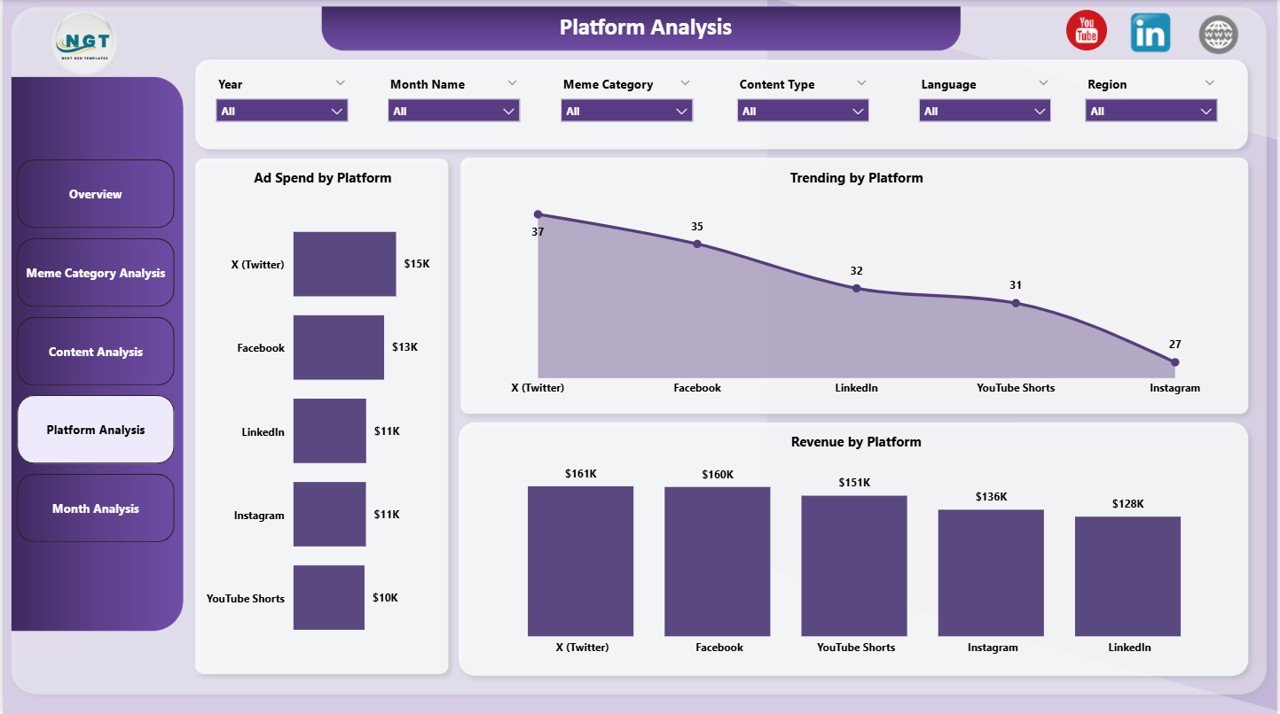
The Platform Analysis Page analyzes viral content performance across different social media platforms.
Different platforms often deliver different engagement levels.
Charts on Platform Analysis Page
This page includes three charts.
Ad Spend by Platform
Shows advertising investment across social media platforms.
Trending by Platform
Displays which platforms produce the most viral content.
Revenue by Platform
Shows which platforms generate the highest revenue.
These insights help teams optimize platform strategy.
Click to Purchases Meme and Viral Content Creation Dashboard in Power BI
5. Monthly Trends Page
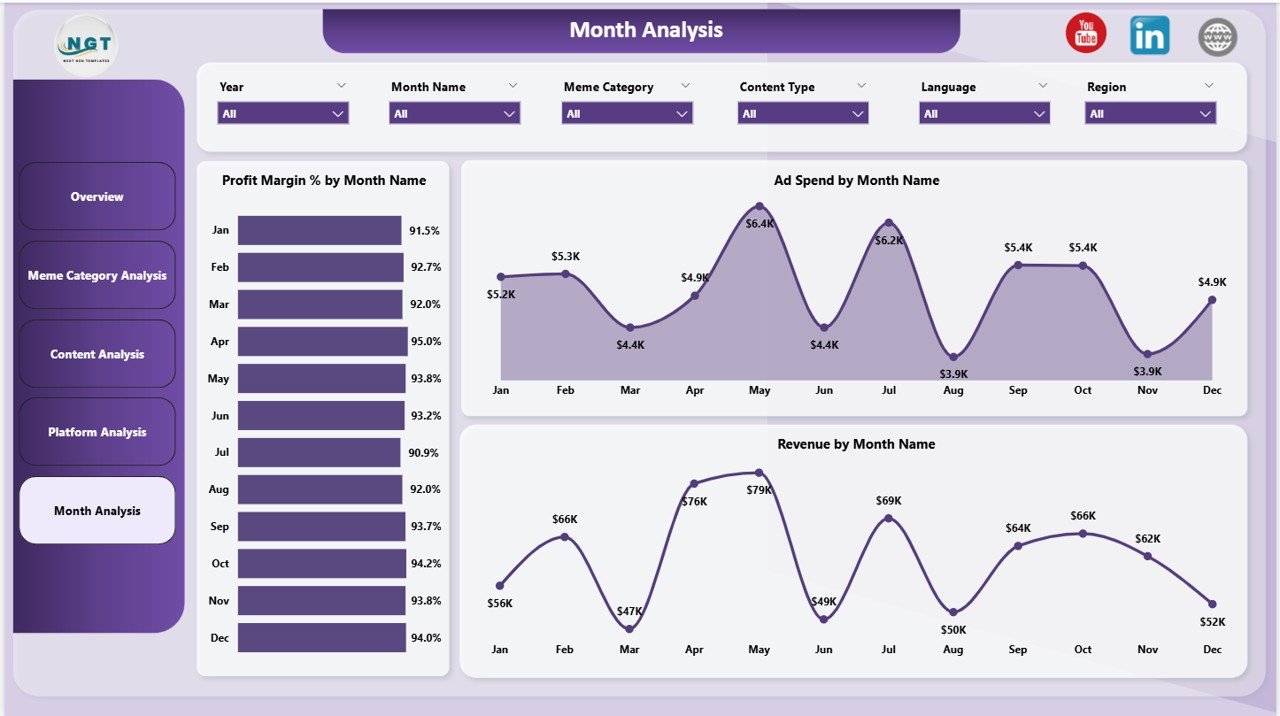
The Monthly Trends Page analyzes performance trends over time.
Trend analysis helps organizations understand seasonal patterns and campaign performance.
Charts on Monthly Trends Page
This page includes three charts.
Profit Margin % by Month Name
Shows how profitability changes over time.
Ad Spend by Month Name
Displays monthly advertising spending trends.
Revenue by Month Name
Shows revenue growth or decline across months.
These insights help organizations plan future campaigns effectively.
Important KPIs for Meme and Viral Content Creation
Content creators track several KPIs to measure viral content success.
Some common KPIs include:
Engagement KPIs
-
Trending percentage
-
Engagement rate
-
Content shares
-
Likes and comments
Financial KPIs
-
Revenue from content
-
Profit generated
-
Profit margin percentage
Marketing KPIs
-
Ad spend efficiency
-
Cost per engagement
-
ROI on campaigns
Platform KPIs
-
Platform engagement rate
-
Revenue by platform
-
Platform growth rate
Tracking these KPIs helps organizations build effective viral marketing strategies.
Click to Purchases Meme and Viral Content Creation Dashboard in Power BI
Advantages of Meme and Viral Content Creation Dashboard in Power BI
Using a Power BI dashboard offers many benefits.
Centralized analytics
All viral content metrics appear in one dashboard.
Interactive data visualization
Users can filter data using slicers and interactive visuals.
Better decision making
Managers can identify successful campaigns quickly.
Improved marketing ROI
Data insights help optimize advertising budgets.
Trend analysis
Historical trends help teams identify viral patterns.
Scalable analytics
Power BI dashboards can scale as content operations grow.
Click to Purchases Meme and Viral Content Creation Dashboard in Power BI
Best Practices for Meme and Viral Content Dashboard
Organizations should follow several best practices to maximize dashboard effectiveness.
Track content data consistently
Always record data for each content post.
Monitor performance regularly
Teams should analyze performance frequently.
Focus on trending metrics
Trending indicators help identify viral potential.
Analyze platform performance
Different platforms deliver different engagement levels.
Optimize advertising budgets
Use performance data to allocate ad spending effectively.
Click to Purchases Meme and Viral Content Creation Dashboard in Power BI
Practical Use Cases of Viral Content Dashboard
This dashboard can benefit many industries and professionals.
Social media marketing teams
Track campaign performance and engagement trends.
Influencers and content creators
Analyze which content types go viral.
Digital marketing agencies
Measure client campaign performance.
Media companies
Track viral content across different languages and regions.
Brand marketing teams
Monitor meme marketing campaigns.
Conclusion
Meme marketing and viral content creation have become powerful tools for audience engagement and digital growth. However, without proper analytics, organizations cannot measure content performance effectively.
The Meme and Viral Content Creation Dashboard in Power BI provides a structured and powerful solution for analyzing viral content campaigns.
This dashboard helps organizations:
-
Monitor content performance
-
Track revenue and profitability
-
Analyze trending content
-
Optimize advertising spending
Because Power BI provides powerful data visualization and analytics capabilities, organizations can gain valuable insights and improve their viral marketing strategies.
Click to Purchases Meme and Viral Content Creation Dashboard in Power BI
Frequently Asked Questions (FAQs)
What is a Meme and Viral Content Creation Dashboard?
It is a Power BI dashboard that tracks and analyzes performance metrics related to meme marketing and viral content campaigns.
Why should marketers track viral content performance?
Tracking viral content helps marketers identify successful campaigns and improve engagement strategies.
Can this dashboard track multiple platforms?
Yes. The dashboard analyzes performance across different platforms.
What KPIs are used in viral content dashboards?
Common KPIs include trending percentage, engagement rate, revenue, profit margin, and ad spending.
Is Power BI suitable for content analytics?
Yes. Power BI provides powerful visualization tools for analyzing digital marketing data.
Click to Purchases Meme and Viral Content Creation Dashboard in Power BI
Visit our YouTube channel to learn step-by-step video tutorials