In today’s fast-moving digital world, memes and viral content drive engagement, brand recall, and online conversations faster than traditional content formats. However, many content teams still rely on assumptions, likes, or gut feelings to judge success. As a result, they often miss clear performance insights and growth opportunities.
That is exactly where a Meme and Viral Content Creation KPI Dashboard in Power BI becomes essential.
This in-depth article explains what a Meme and Viral Content Creation KPI Dashboard in Power BI is, how it works, why it matters, and how content creators, social media managers, and marketing teams can use it to track performance with clarity. Moreover, you will learn about dashboard pages, KPIs, advantages, best practices, and common questions—so you can confidently implement this solution in your workflow.
Click to Purchases Meme and Viral Content Creation KPI Dashboard in Power BI
What Is a Meme and Viral Content Creation KPI Dashboard in Power BI?
A Meme and Viral Content Creation KPI Dashboard in Power BI is a structured performance monitoring tool that helps teams track, analyze, and improve meme and viral content effectiveness using measurable KPIs.
Instead of scrolling through multiple platforms or manually checking reports, this dashboard centralizes all KPI data into one interactive view. As a result, teams gain instant visibility into content performance trends, target achievements, and historical comparisons.
Moreover, this dashboard transforms raw Excel data into clear visuals, status indicators, and trend charts. Therefore, decision-makers can quickly understand what works, what underperforms, and what needs improvement.
Why Do Meme and Viral Content Teams Need KPI Tracking?
Memes spread fast. However, performance drops just as quickly if teams do not monitor results properly.
Here is why KPI tracking matters:
-
It helps measure content impact beyond likes and shares
-
It aligns creative efforts with business goals
-
It improves consistency in content performance
-
It supports data-driven creative decisions
-
It highlights trends, spikes, and declines early
Because viral content depends on timing, format, and audience response, teams must track KPIs regularly. Therefore, a dedicated Power BI dashboard becomes a powerful solution.
How Does the Meme and Viral Content Creation KPI Dashboard in Power BI Work?
This dashboard uses Excel as the data source and Power BI Desktop for visualization. As a result, users can easily update data without complex systems.
You only need to enter actual values, targets, and KPI definitions in Excel. Then, Power BI automatically updates all visuals, calculations, and indicators.
Moreover, the dashboard uses clear formulas to calculate MTD, YTD, target comparisons, and year-over-year performance. Consequently, teams save time and avoid manual calculation errors.
Key Features of the Meme and Viral Content Creation KPI Dashboard in Power BI
This ready-to-use dashboard includes three structured pages, each designed for a specific analysis purpose.
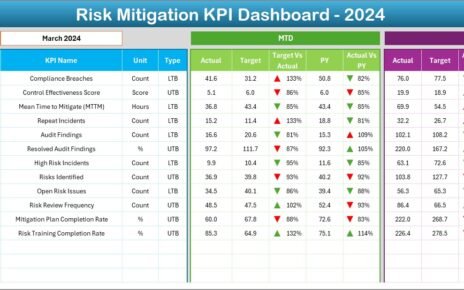
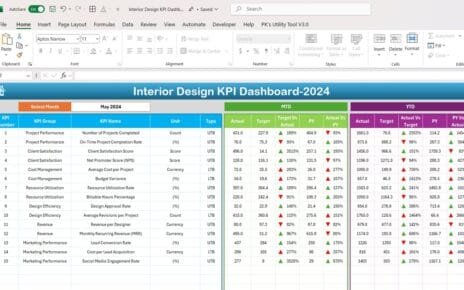
What Is Included in the Summary Page?

The Summary Page acts as the main control center of the dashboard.
Interactive Filters for Better Analysis
At the top of the page, you will find:
-
Month slicer to analyze performance for a selected month
-
KPI Group slicer to filter KPIs by category
As a result, users can quickly narrow down insights without scrolling or reloading reports.
KPI Performance Cards for Quick Status Check
This page includes three key cards:
-
Total KPIs Count
-
MTD Target Meet Count
-
MTD Target Missed Count
These cards instantly show how many KPIs perform well and how many require attention.
Detailed KPI Performance Table
Below the cards, the dashboard displays a comprehensive KPI table with the following fields:
-
KPI Number – Sequential number for each KPI
-
KPI Group – Category or theme of the KPI
-
KPI Name – Name of the performance indicator
-
Unit – Measurement unit such as %, count, or rate
-
Type – KPI type (LTB – Lower the Better, UTB – Upper the Better)
MTD Performance Metrics Explained
The table also shows detailed Month-to-Date (MTD) metrics:
-
Actual CY MTD – Actual value for the current year MTD
-
Target CY MTD – Target value for the current year MTD
-
MTD Icon – ▲ or ▼ with green/red color to show performance status
-
Target vs Actual (MTD) – Percentage calculated as
Actual MTD ÷ Target MTD -
PY MTD – Previous year MTD value
-
CY vs PY (MTD) – Percentage comparison between current and previous year
As a result, teams instantly understand short-term performance.
YTD Performance Metrics Explained
For long-term analysis, the dashboard also includes Year-to-Date (YTD) metrics:
-
Actual CY YTD – Current year actual YTD value
-
Target CY YTD – Current year target YTD value
-
YTD Icon – ▲ or ▼ performance indicator
-
Target vs Actual (YTD) – Actual YTD ÷ Target YTD
-
PY YTD – Previous year YTD value
-
CY vs PY (YTD) – Current vs previous year YTD comparison
Therefore, teams can track sustained growth and long-term trends.
Click to Purchases Meme and Viral Content Creation KPI Dashboard in Power BI
What Insights Does the KPI Trend Page Provide?

The KPI Trend Page focuses on visual performance trends over time.
KPI Selection for Focused Analysis
On the left side, a KPI Name slicer allows users to select a specific KPI. As a result, charts update instantly.
Combo Charts for MTD and YTD Trends
This page includes two combo charts:
-
MTD Trend Chart – Shows actual, target, and previous year MTD values
-
YTD Trend Chart – Shows actual, target, and previous year YTD values
These visuals help users spot:
-
Growth patterns
-
Performance dips
-
Target achievement gaps
-
Seasonal trends
Consequently, content teams can refine strategies quickly.
What Is the KPI Definition Page and Why Is It Important?

The KPI Definition Page serves as a drill-through page.
Purpose of the KPI Definition Page
This page displays:
-
KPI Formula
-
KPI Definition
-
KPI Type (LTB or UTB)
Because this page remains hidden, users access it only through drill-through from the Summary Page.
Easy Navigation with Back Button
A Back button in the top-left corner allows users to return to the main page instantly. As a result, navigation stays smooth and user-friendly.
What Excel Data Is Required for This Dashboard?
The dashboard uses an Excel file with three structured worksheets.
Input_Actual Sheet: What Data Should You Enter?
In the Input_Actual sheet, users must enter:
-
KPI Name
-
Month (first date of the month)
-
MTD Actual Value
-
YTD Actual Value
This sheet captures real performance numbers.
Input_Target Sheet: How Do Targets Work?
In the Input_Target sheet, users enter:
-
KPI Name
-
Month (first date of the month)
-
MTD Target Value
-
YTD Target Value
As a result, Power BI can calculate achievement percentages automatically.
KPI Definition Sheet: Why Is It Critical?
The KPI Definition sheet includes:
-
KPI Number
-
KPI Group
-
KPI Name
-
Unit
-
Formula
-
Definition
-
Type (LTB or UTB)
This sheet ensures KPI clarity and consistency across teams.
Advantages of Meme and Viral Content Creation KPI Dashboard in Power BI
Using this dashboard delivers multiple benefits.
Clear Performance Visibility
-
See all KPIs in one place
-
Identify strong and weak content quickly
Faster Decision-Making
-
Instant MTD and YTD insights
-
No manual calculations required
Improved Content Strategy
-
Understand what drives virality
-
Optimize content formats and timing
Easy Data Management
-
Simple Excel data input
-
Automatic Power BI updates
Scalable and Flexible
-
Add new KPIs easily
-
Adjust targets without redesigning the dashboard
Best Practices for Meme and Viral Content Creation KPI Dashboard in Power BI
To maximize results, follow these best practices.
Define KPIs Clearly
Always write clear definitions and formulas. As a result, everyone interprets metrics the same way.
Update Data Regularly
Update actuals and targets monthly. Therefore, insights stay accurate and relevant.
Group KPIs Logically
Use meaningful KPI groups such as Engagement, Reach, Conversion, or Growth. Consequently, analysis becomes easier.
Review Trends, Not Just Numbers
Always analyze trend charts. Short-term spikes may mislead without trend context.
Align KPIs with Goals
Ensure KPIs support brand awareness, engagement, or revenue goals. Otherwise, data loses relevance.
Who Can Benefit from This Dashboard?
This dashboard suits:
-
Social media managers
-
Meme marketing teams
-
Digital content creators
-
Marketing analysts
-
Brand managers
-
Growth marketing teams
Because it focuses on clarity and simplicity, even non-technical users can use it confidently.
How Does This Dashboard Improve Viral Content Strategy?
This dashboard replaces guesswork with data. As a result, teams understand:
-
Which KPIs drive virality
-
How performance changes month by month
-
Where targets fail or succeed
-
How current performance compares with past results
Therefore, teams create smarter, data-backed content strategies.
Conclusion
A Meme and Viral Content Creation KPI Dashboard in Power BI empowers content teams to move from intuition to insight. By combining structured KPIs, Excel-based data input, and powerful Power BI visuals, this dashboard delivers clarity, control, and confidence.
Moreover, it saves time, improves decision-making, and helps teams consistently create high-performing viral content. If you want measurable growth in your meme and viral content strategy, this dashboard becomes a must-have solution.
Click to Purchases Meme and Viral Content Creation KPI Dashboard in Power BI
Frequently Asked Questions (FAQs)
What is the main purpose of a Meme and Viral Content Creation KPI Dashboard in Power BI?
The main purpose is to track, analyze, and improve meme and viral content performance using structured KPIs and visual insights.
Do I need advanced Power BI skills to use this dashboard?
No. You only need to update Excel data. Power BI visuals update automatically.
Can I customize KPIs in this dashboard?
Yes. You can add, remove, or modify KPIs by updating the Excel KPI Definition sheet.
How often should I update the data?
You should update data monthly. However, you can update it more frequently if needed.
Does this dashboard support year-over-year comparison?
Yes. It includes CY vs PY comparison for both MTD and YTD metrics.
Can this dashboard handle multiple KPI groups?
Yes. The KPI Group slicer allows easy filtering across categories.
Is Excel mandatory as a data source?
Yes. This dashboard uses Excel as the primary data source for simplicity and flexibility.
Who should use this dashboard?
Social media managers, meme creators, digital marketers, and content strategists benefit the most.
Click to Purchases Meme and Viral Content Creation KPI Dashboard in Power BI
Visit our YouTube channel to learn step-by-step video tutorials