Running a microbrewery feels exciting. However, excitement alone does not grow profits. You must control production, monitor quality, track costs, and compare sales month after month. Otherwise, small inefficiencies will slowly reduce your margins.
Therefore, you need visibility.
More importantly, you need real-time performance intelligence.
That is exactly where the Microbreweries KPI Dashboard in Power BI becomes powerful.
This ready-to-use dashboard captures data in Excel and transforms it into interactive Power BI visuals. As a result, you can monitor KPIs, compare targets, and evaluate growth in seconds.
In this complete guide, you will learn:
-
What a Microbreweries KPI Dashboard in Power BI is
-
Why craft breweries need KPI tracking
-
Detailed explanation of all 3 dashboard pages
-
How the Excel data structure works
-
Important KPIs for microbreweries
-
Advantages of the Microbreweries KPI Dashboard
-
Best Practices for the Microbreweries KPI Dashboard
-
Frequently Asked Questions with Answers
Let us explore everything step by step.
Click to Purchases Microbreweries KPI Dashboard in Power BI
What Is a Microbreweries KPI Dashboard in Power BI?
A Microbreweries KPI Dashboard in Power BI is an interactive business intelligence solution designed for craft breweries. It tracks production, sales, financial, and operational KPIs using dynamic visuals and slicers.
Instead of reviewing raw Excel sheets, you can:
-
Analyze Month-to-Date (MTD) performance
-
Monitor Year-to-Date (YTD) results
-
Compare Current Year vs Previous Year
-
Track Target vs Actual instantly
-
Identify KPI performance using red and green indicators
Because Power BI uses interactive visuals, you gain faster insights. Therefore, you make smarter brewing decisions.
Click to Purchases Microbreweries KPI Dashboard in Power BI
Why Do Microbreweries Need a KPI Dashboard in Power BI?
Many breweries focus heavily on recipe development and branding. However, sustainable growth depends on performance tracking.
Without KPI monitoring:
-
You cannot detect yield loss early.
-
You cannot identify underperforming products.
-
You cannot monitor cost increase in time.
-
You cannot measure seasonal growth clearly.
On the other hand, when you use a KPI dashboard:
-
You centralize data.
-
You compare months instantly.
-
You detect issues faster.
-
You improve profitability consistently.
Therefore, this dashboard acts as your brewery command center.
Click to Purchases Microbreweries KPI Dashboard in Power BI
What Are the 3 Pages in the Microbreweries KPI Dashboard?
This Power BI dashboard contains three structured pages. Each page serves a clear purpose.
Let us understand them in detail.
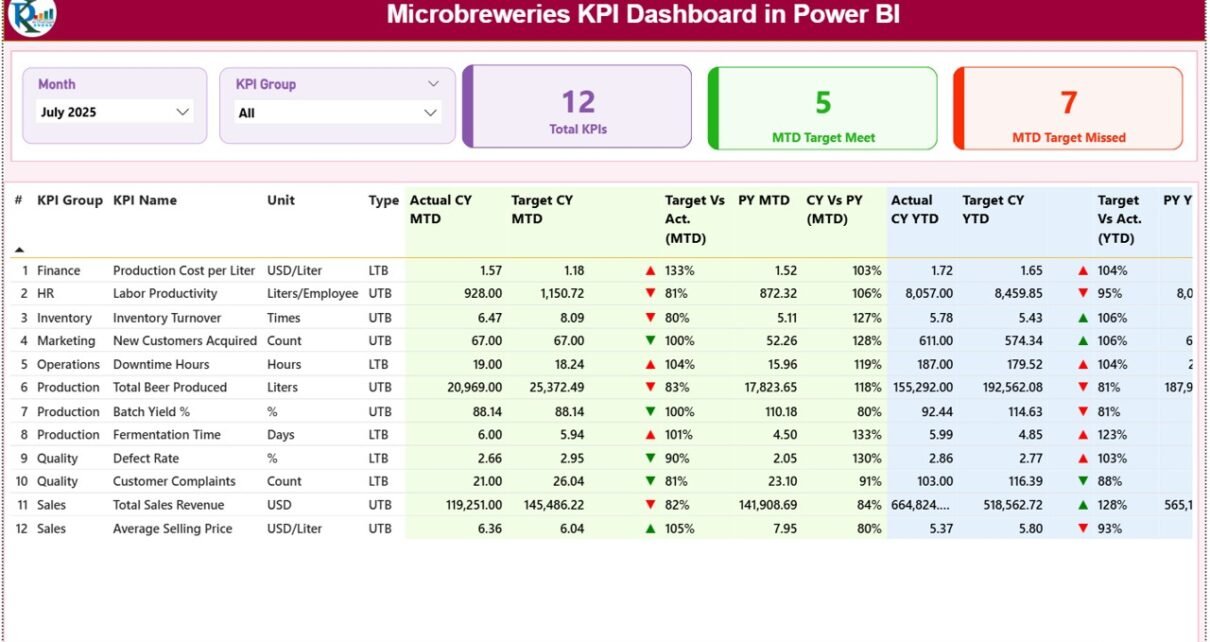
1️⃣ Summary Page – Your Performance Control Panel
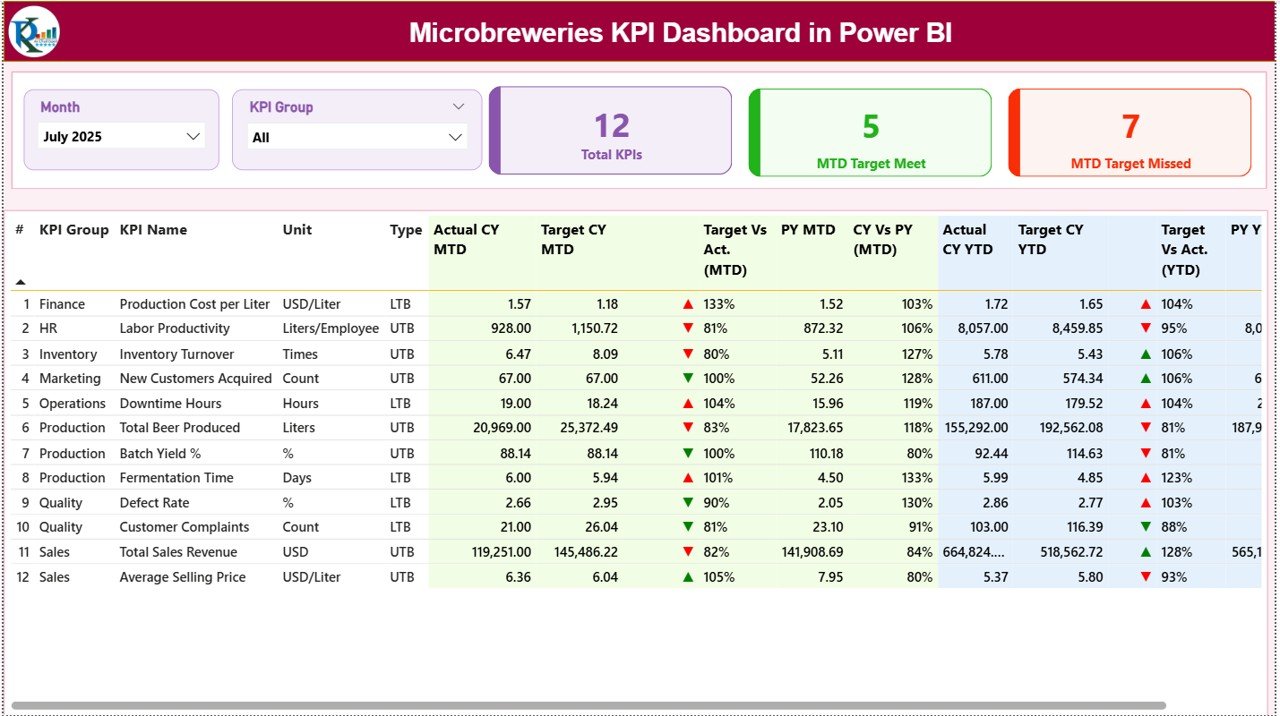
The Summary Page works as the main overview page.
At the top, you will find:
-
Month Slicer
-
KPI Group Slicer
Because of these slicers, you can filter performance by:
-
Specific month
-
Specific KPI category (Production, Financial, Quality, Sales, etc.)
🔹 KPI Cards Section
On the top section, you will see 3 KPI cards:
-
Total KPIs Count
-
MTD Target Meet Count
-
MTD Target Missed Count
These cards give you instant performance clarity.
For example:
-
If MTD Target Meet count is high, performance remains strong.
-
If MTD Target Missed count increases, you must take action immediately.
Therefore, these cards provide quick health status of your brewery.
🔹 Detailed KPI Performance Table
Below the cards, you will see a detailed KPI table. This table shows complete KPI performance data.
The Table Includes:
-
KPI Number
-
KPI Group
-
KPI Name
-
Unit
-
Type (LTB or UTB)
-
Actual CY MTD
-
Target CY MTD
-
MTD Icon (▲ / ▼ with color coding)
-
Target vs Actual (MTD %)
-
PY MTD
-
CY vs PY (MTD %)
-
Actual CY YTD
-
Target CY YTD
-
YTD Icon
-
Target vs Actual (YTD %)
-
PY YTD
-
CY vs PY (YTD %)
🔹 Understanding the KPI Icons
The dashboard uses visual indicators:
-
▲ Green = Target achieved or positive growth
-
▼ Red = Target missed or negative performance
Because of this visual system, you do not need to read every number. Instead, you identify performance quickly.
🔹 Performance Formulas Used
Here are the core calculations:
-
Target vs Actual (MTD) = Actual MTD / Target MTD
-
CY vs PY (MTD) = Current Year MTD / Previous Year MTD
-
Target vs Actual (YTD) = Actual YTD / Target YTD
-
CY vs PY (YTD) = Current Year YTD / Previous Year YTD
Therefore, the dashboard measures both target performance and year-over-year growth.
Click to Purchases Microbreweries KPI Dashboard in Power BI
2️⃣ KPI Trend Page – Analyze Performance Patterns
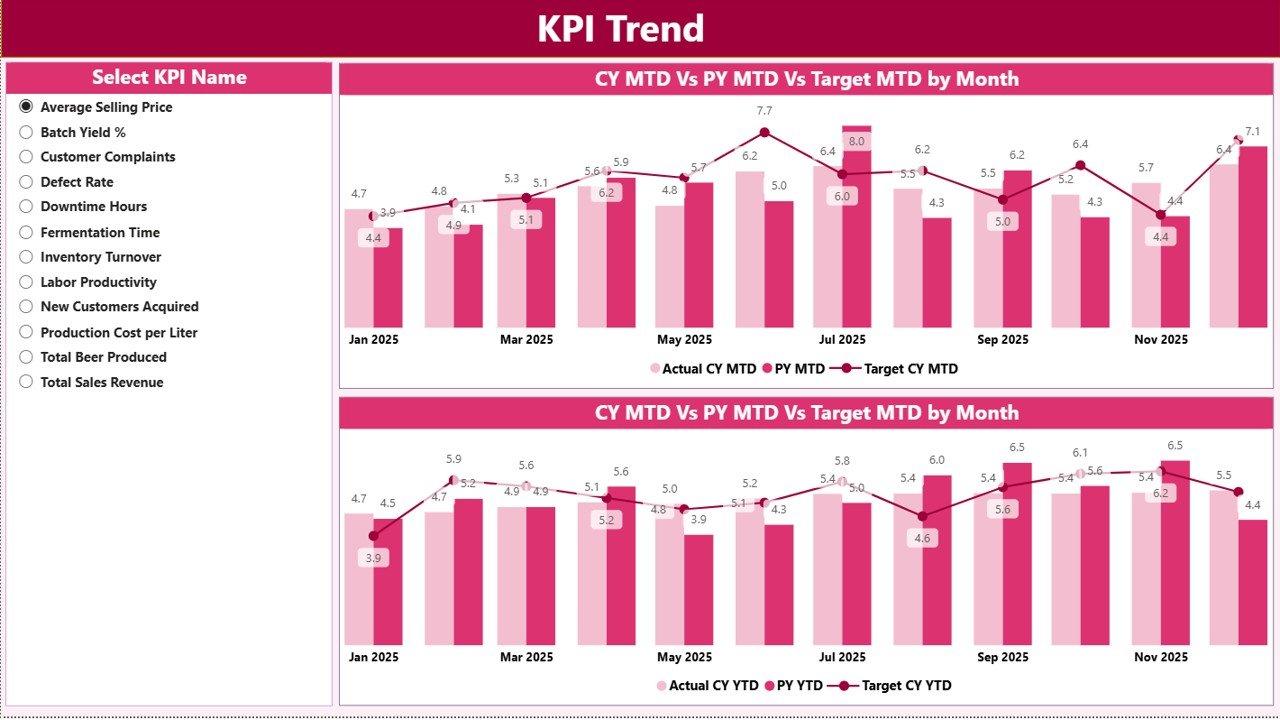
The KPI Trend page allows deeper analysis.
On the left side, you will find a KPI Name slicer.
When you select a KPI, the page displays:
-
MTD Trend Combo Chart
-
YTD Trend Combo Chart
Each combo chart shows:
-
Current Year Actual
-
Previous Year
-
Target
Because these charts show performance over time, you can:
-
Detect seasonal trends
-
Identify declining performance
-
Compare monthly improvement
-
Evaluate consistency
For example, if production yield drops every summer, you can investigate temperature or fermentation issues.
Thus, this page supports analytical decision-making.
Click to Purchases Microbreweries KPI Dashboard in Power BI
3️⃣ KPI Definition Page – Drill Through Details
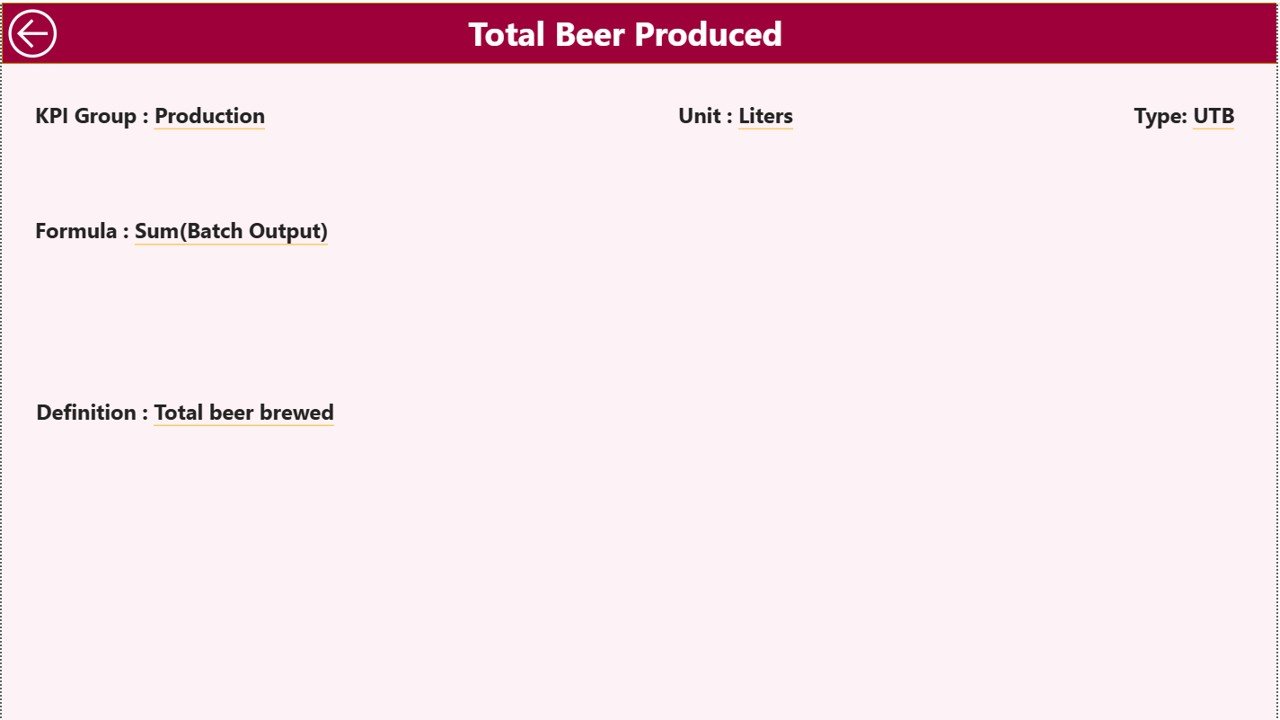
This page remains hidden by default. However, you can drill through from the Summary Page.
On this page, you can view:
-
KPI Formula
-
KPI Definition
-
KPI Unit
-
KPI Type (LTB or UTB)
If you want to go back, simply click the Back Button at the top left corner.
Therefore, this page ensures clarity and standardization.
How Does the Excel Data Source Work?
The dashboard pulls data from an Excel file.
You must fill three worksheets:
1️⃣ Input_Actual Sheet
Here, you enter:
-
KPI Name
-
Month (use first date of month)
-
MTD Value
-
YTD Value
Because you use structured columns, Power BI refreshes automatically.
2️⃣ Input_Target Sheet
Here, you enter:
-
KPI Name
-
Month
-
Target MTD
-
Target YTD
These targets help you measure performance.
3️⃣ KPI Definition Sheet
Here, you define:
-
KPI Number
-
KPI Group
-
KPI Name
-
Unit
-
Formula
-
Definition
-
Type (LTB or UTB)
This sheet ensures KPI clarity.
Click to Purchases Microbreweries KPI Dashboard in Power BI
What KPIs Should Microbreweries Track?
To maximize performance, you must monitor meaningful KPIs.
🔹 Production KPIs
-
Total Production Volume
-
Fermentation Efficiency %
-
Yield %
-
Batch Loss %
-
Downtime Hours
🔹 Financial KPIs
-
Revenue
-
Cost per Liter
-
Gross Margin %
-
Ingredient Cost %
-
Utility Cost %
🔹 Sales KPIs
-
Taproom Sales
-
Distribution Revenue
-
Sales by SKU
-
Average Order Value
🔹 Quality KPIs
-
Rejected Batch %
-
Quality Score
-
Alcohol Accuracy %
-
Customer Complaint Rate
Tracking these KPIs improves operational control.
Click to Purchases Microbreweries KPI Dashboard in Power BI
Advantages of Microbreweries KPI Dashboard in Power BI
Now let us discuss the advantages clearly.
✅ 1. Real-Time Interactive Analysis
Power BI updates visuals instantly after data refresh. Therefore, you see performance immediately.
✅ 2. Professional Visual Presentation
Combo charts, slicers, and KPI icons improve understanding. Moreover, management presentations look impressive.
✅ 3. Faster Decision Making
Because you see trends visually, you identify issues quickly.
✅ 4. Target Accountability
You compare Actual vs Target clearly. Consequently, your team focuses on performance goals.
✅ 5. Growth Measurement
Year-over-Year comparison helps you measure expansion accurately.
✅ 6. Drill-Through Capability
You can drill into KPI definitions easily. Therefore, you eliminate confusion.
✅ 7. Scalable System
As your brewery grows, you can add more KPIs and extend the model.
How Does This Dashboard Improve Brewery Profit?
You might wonder how exactly this improves profit.
Here is how:
-
You reduce production waste.
-
You identify costly inefficiencies.
-
You detect declining sales early.
-
You optimize pricing strategy.
-
You manage seasonal fluctuations.
-
You improve batch planning.
Because of this structured approach, your brewery becomes data-driven.
Click to Purchases Microbreweries KPI Dashboard in Power BI
Best Practices for the Microbreweries KPI Dashboard
To get maximum benefit, follow these best practices.
🔹 1. Update Data Consistently
Enter actual numbers monthly without delay. Consistency ensures reliability.
🔹 2. Define KPIs Clearly
Always write clear definitions and formulas in the KPI Definition sheet.
🔹 3. Use Realistic Targets
Set achievable targets based on historical data.
🔹 4. Review Trends Monthly
Do not only check single-month numbers. Instead, analyze trends regularly.
🔹 5. Focus on Actionable Insights
When you see red indicators, take immediate corrective action.
🔹 6. Train Your Team
Ensure managers understand KPI meaning and performance expectations.
Who Should Use This Dashboard?
This dashboard benefits:
-
Microbrewery Owners
-
Brewmasters
-
Production Managers
-
Finance Teams
-
Sales Managers
-
Brewery Consultants
If you want structured performance monitoring, this solution fits perfectly.
Click to Purchases Microbreweries KPI Dashboard in Power BI
Conclusion: Brew Smarter with Data Intelligence
Craft beer demands passion. However, growth demands performance control.
The Microbreweries KPI Dashboard in Power BI transforms raw Excel data into interactive intelligence.
Because of its structured design, you can:
-
Monitor KPIs clearly
-
Compare MTD and YTD performance
-
Evaluate target achievement
-
Measure year-over-year growth
-
Improve profitability
Therefore, you stop guessing.
Instead, you manage your brewery using data.
When you combine brewing expertise with performance analytics, you build a stronger and more profitable microbrewery.
Click to Purchases Microbreweries KPI Dashboard in Power BI
Frequently Asked Questions (FAQs)
❓ What is the purpose of the Microbreweries KPI Dashboard in Power BI?
It helps track production, sales, financial, and quality KPIs in an interactive Power BI environment.
❓ Do I need advanced Power BI skills to use it?
No. You only need to update Excel data and refresh the dashboard.
❓ How often should I refresh the data?
You should refresh it monthly after entering actual numbers.
❓ Can I add more KPIs?
Yes. You can expand the Excel data model and update Power BI accordingly.
❓ What does LTB and UTB mean?
LTB means Lower the Better.
UTB means Upper the Better.
Click to Purchases Microbreweries KPI Dashboard in Power BI
Visit our YouTube channel to learn step-by-step video tutorials