The mining industry works in one of the toughest environments in the world. Companies handle heavy equipment, complex operations, rising fuel costs, strict safety rules, and environmental responsibilities. Therefore, leaders must track production, cost, safety, and profitability in real time.However, traditional Excel sheets and static reports slow down decision-making. As a result, managers miss cost overruns, downtime patterns, and production gaps.So, how can mining companies gain full operational visibility?You need a Mining Dashboard in Power BI.This interactive dashboard centralizes production data, cost analysis, equipment performance, and ESG metrics into one powerful reporting system. Moreover, it helps executives monitor KPIs instantly, compare trends, and make data-driven decisions faster.
In this complete guide, you will learn:
- What a Mining Dashboard in Power BI is
- Why mining companies need it
- Detailed explanation of all 5 dashboard pages
- Key KPIs included in the dashboard
- Advantages of Mining Dashboard in Power BI
- Best Practices for the Mining Dashboard
- Frequently Asked Questions with Answers
Click to buy Mining Dashboard in Power BI
What Is a Mining Dashboard in Power BI?
A Mining Dashboard in Power BI is an interactive business intelligence solution that tracks mining operations in real time. It connects structured data from Excel, ERP systems, or databases and transforms raw numbers into meaningful visuals.
Instead of reviewing static monthly reports, managers can:
- Monitor total cost and revenue instantly
- Analyze ore production by commodity
- Track fuel and processing cost trends
- Evaluate equipment uptime and downtime
- Measure safety incidents and CO2 emissions
Therefore, this dashboard improves visibility, speed, and operational control.
Why Do Mining Companies Need a Mining Dashboard in Power BI?
Mining operations generate massive volumes of data every day. Production logs, fuel consumption, equipment downtime, and safety records create complex datasets.
However, without structured reporting, companies struggle to:
- Identify high-cost departments
- Reduce downtime hours
- Control fuel expenses
- Improve profit margins
- Monitor ESG performance
Consequently, decision-makers react late instead of acting proactively.
A Mining Dashboard in Power BI solves these challenges because it:
- Centralizes all mining KPIs
- Provides real-time data visualization
- Highlights performance gaps clearly
- Supports faster strategic decisions
Therefore, organizations improve efficiency while protecting profitability.
Key Features of the Mining Dashboard in Power BI
This Mining Dashboard includes 5 powerful pages inside the Power BI Desktop file. Each page focuses on a specific operational area.
Let us examine them one by one.
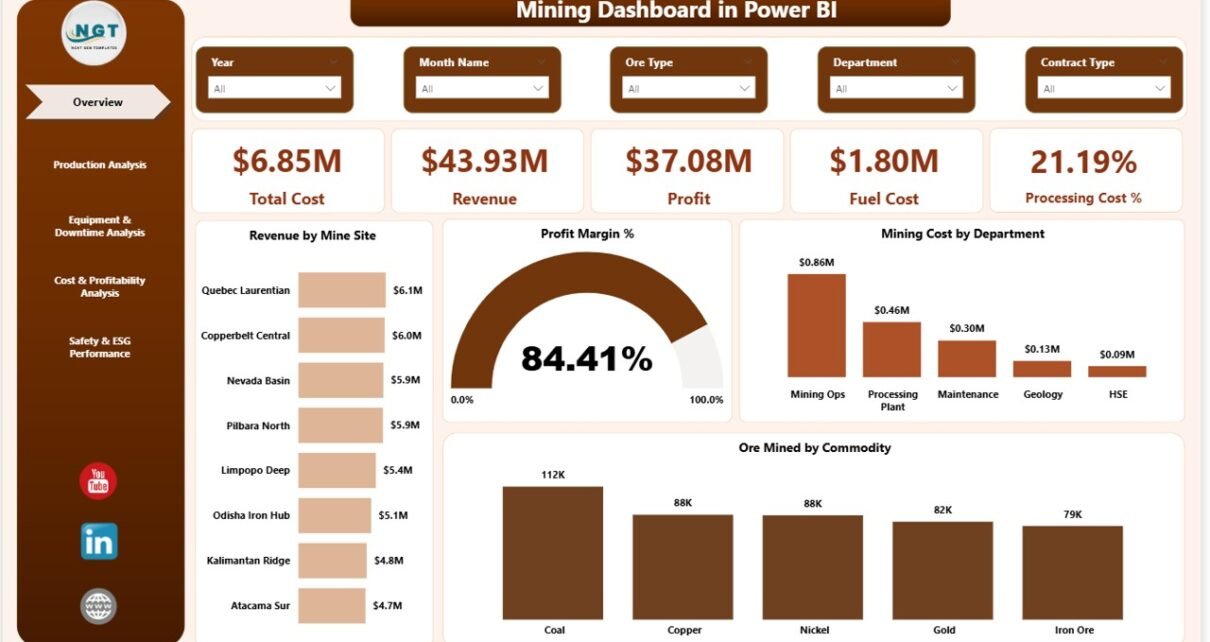
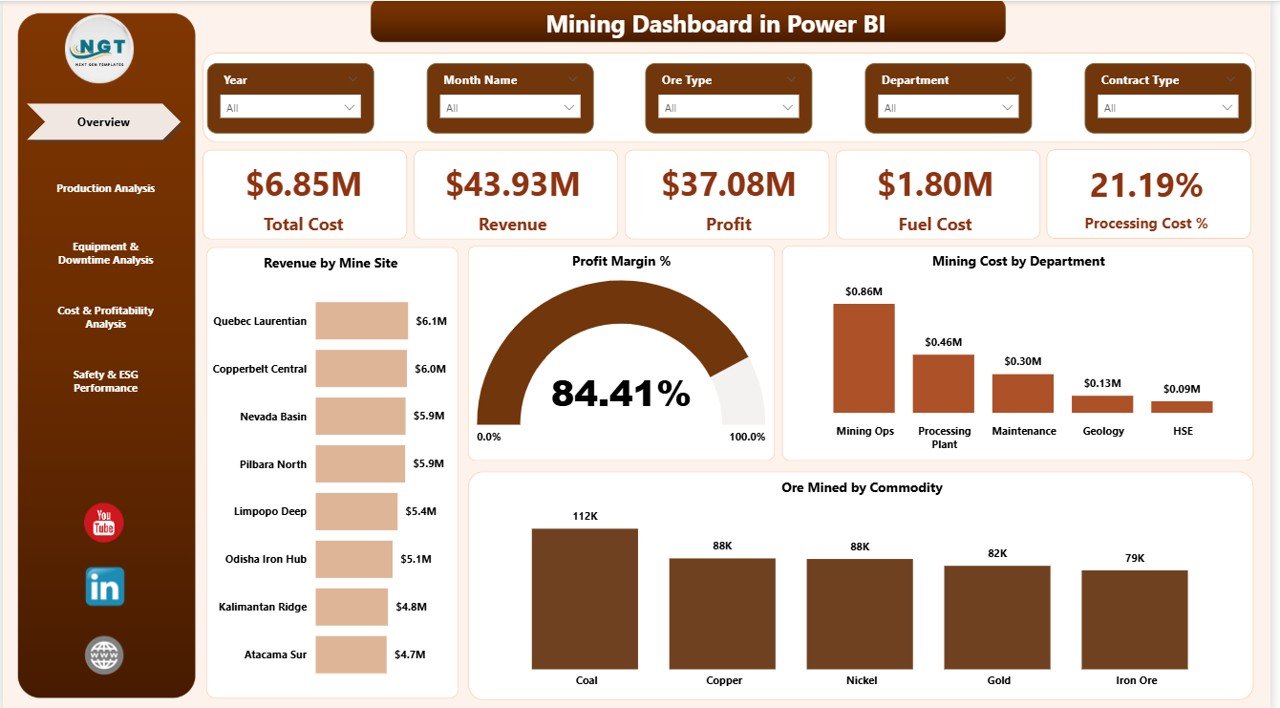
Overview Page – The Central Control Panel
The Overview Page acts as the main interface of the dashboard. It provides a snapshot of mining performance.
KPI Cards Displayed
This page shows 5 key cards:
- Total Cost
- Revenue
- Profit
- Fuel Cost
- Processing Cost %
These cards help managers quickly understand overall financial health.
Charts Included
In addition, the page displays:
- Revenue by Mine Site
- Profit Margin %
- Mining Cost by Department
- Ore Mined by Commodity
Therefore, leadership teams can instantly compare mine sites, departments, and commodities.
Moreover, slicers allow users to filter data by month, site, or company. As a result, analysis becomes simple and dynamic.
Click to buy Mining Dashboard in Power BI
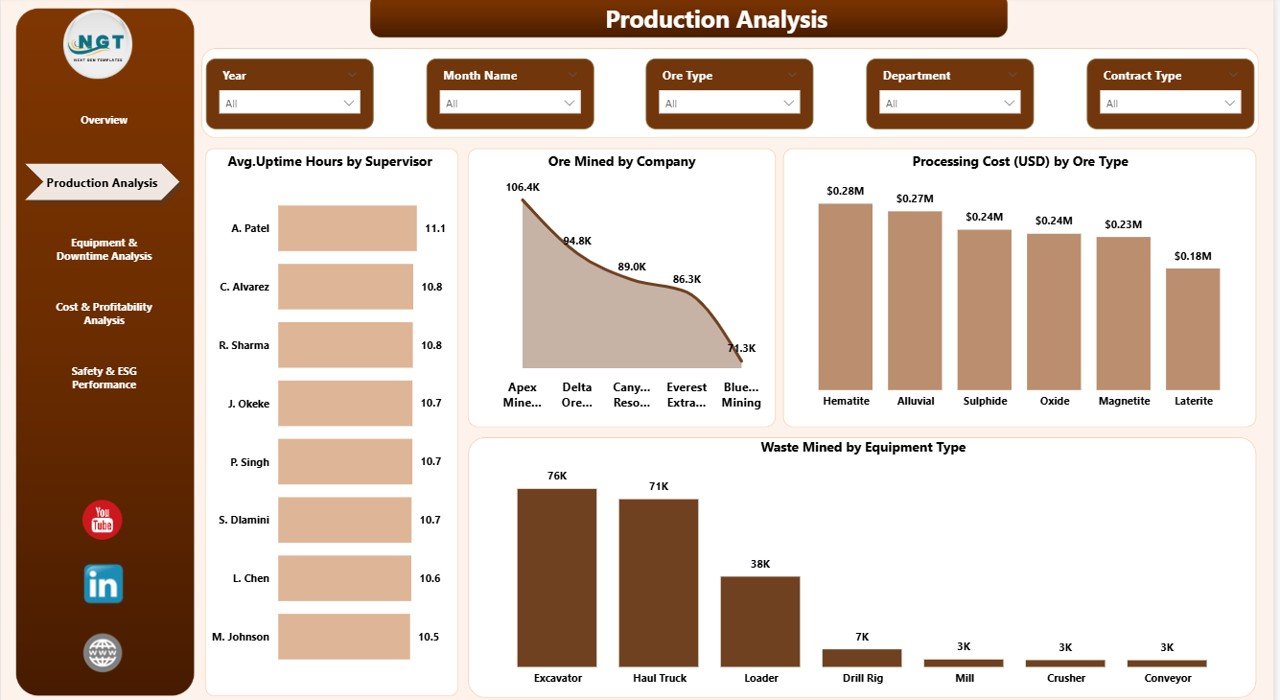
Production Analysis – How Efficient Is Production?
Production drives revenue in mining. Therefore, companies must monitor output carefully.
This page includes 4 major charts:
- Average Uptime Hours by Supervisor
- Ore Mined by Company
- Processing Cost (USD) by Ore Type
- Waste Mined by Equipment Type
Why Is This Important?
Because production directly impacts profitability.
For example:
- If uptime decreases by 10%, revenue drops significantly.
- If waste increases, cost per ton rises.
Therefore, production analysis ensures optimal output and cost control.
Click to buy Mining Dashboard in Power BI
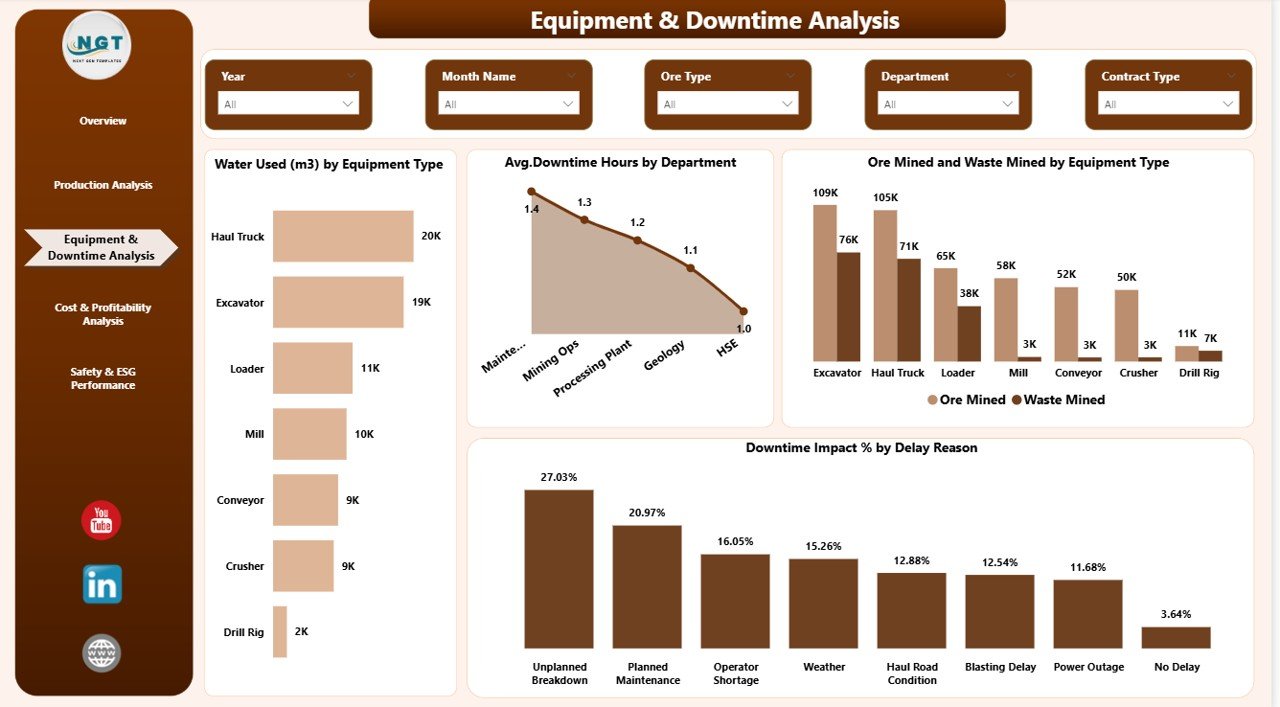
Equipment & Downtime Analysis – Where Do Delays Occur?
Mining operations rely heavily on machinery. However, equipment failure reduces productivity.
This page helps managers identify downtime patterns.
Charts Included
- Water Used (m³) by Equipment Type
- Average Downtime Hours by Department
- Ore Mined and Waste Mined by Equipment Type
- Downtime Impact % by Delay Reason
Key Benefits
- Detect high-maintenance equipment
- Analyze department-wise downtime
- Identify delay causes
- Improve maintenance planning
Therefore, companies reduce breakdowns and increase uptime hours.
Click to buy Mining Dashboard in Power BI
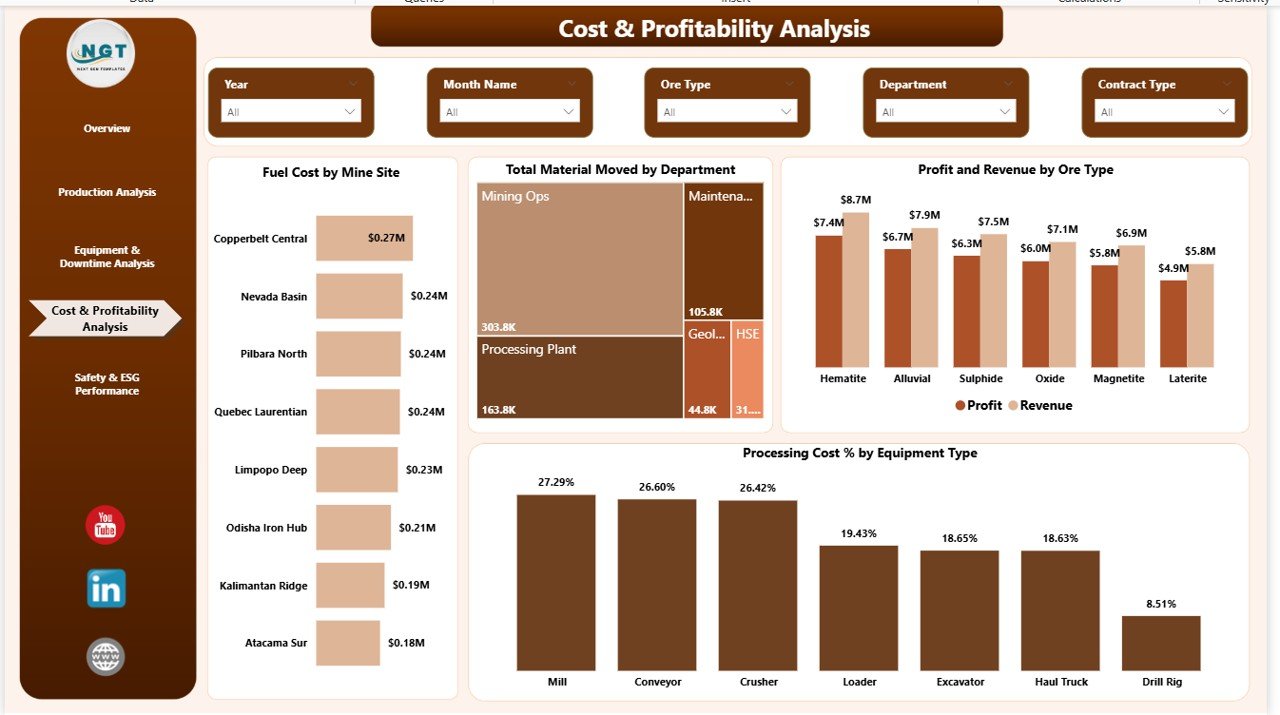
Cost & Profitability Analysis – Are Operations Profitable?
Cost control determines mining success. Fuel prices, material movement, and processing expenses significantly affect margins.
This page includes 4 important visuals:
- Fuel Cost by Mine Site
- Total Material Moved by Department
- Profit and Revenue by Ore Type
- Processing Cost % by Equipment Type
Why This Page Matters
Because even a small increase in fuel cost can reduce profit margin.
For instance:
- A 5% fuel increase can lower overall profit by 2–3%.
- High processing cost reduces net revenue per ton.
Therefore, managers must track cost trends continuously.
Click to buy Mining Dashboard in Power BI
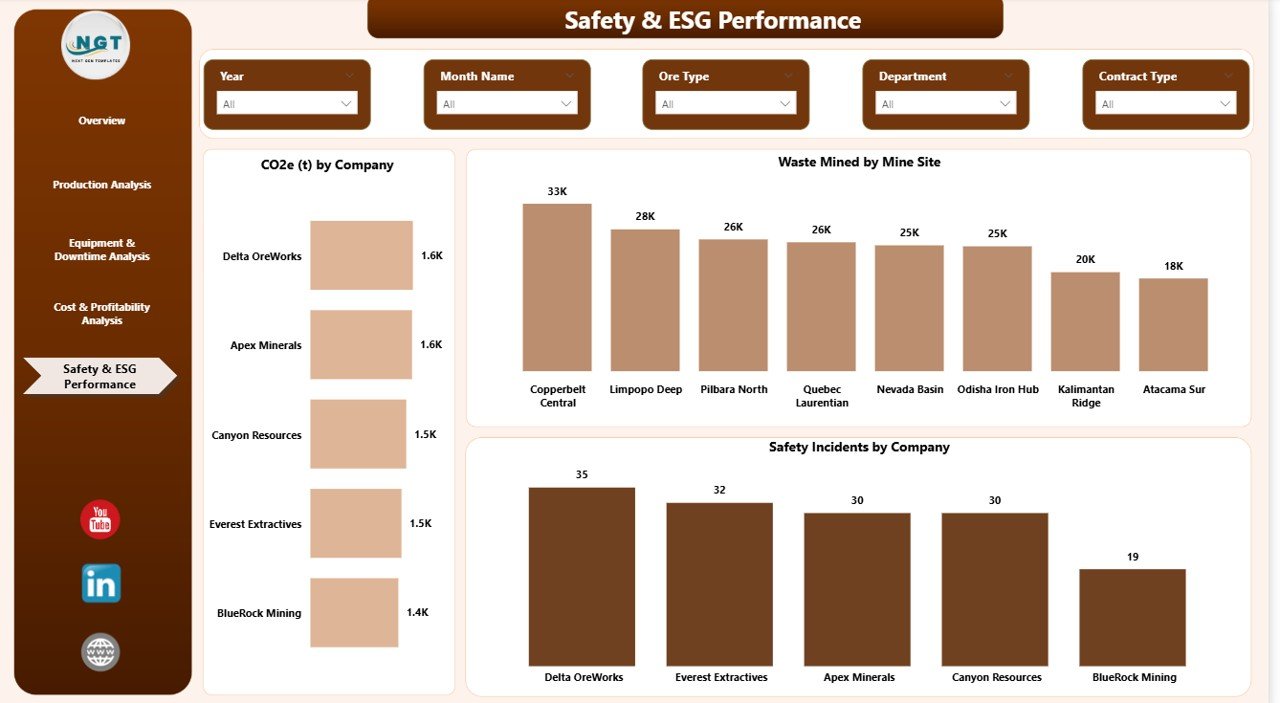
Safety & ESG Performance – Is the Company Responsible?
Modern mining companies must focus on Environmental, Social, and Governance (ESG) metrics.
This page includes:
- CO2 (t) by Company
- Waste Mined by Mine Site
- Safety Incidents by Company
Why ESG Matters
- Governments enforce strict regulations.
- Investors demand sustainability reports.
- Communities expect environmental protection.
Therefore, tracking safety and emissions improves compliance and reputation.
Click to buy Mining Dashboard in Power BI
What KPIs Can You Track in a Mining Dashboard in Power BI?
A well-designed mining dashboard includes multiple KPIs such as:
Financial KPIs
- Total Cost
- Revenue
- Profit
- Profit Margin %
- Fuel Cost
Production KPIs
- Ore Mined (Tons)
- Waste Mined
- Processing Cost %
- Material Moved
Equipment KPIs
- Average Uptime Hours
- Downtime Hours
- Downtime Impact %
- Water Usage
ESG KPIs
- CO2 Emissions (t)
- Safety Incidents
- Waste by Site
Therefore, companies achieve 360-degree performance monitoring.
How Does Power BI Improve Mining Data Analysis?
Power BI provides interactive dashboards with:
- Dynamic slicers
- Drill-down analysis
- Real-time updates
- Custom DAX calculations
- Advanced data modeling
Moreover, Power BI handles large datasets smoothly. As a result, mining companies analyze years of data in seconds.
Advantages of Mining Dashboard in Power BI
Using a Mining Dashboard in Power BI provides several advantages.
Real-Time Decision Making
Managers view updated metrics instantly. Therefore, they react quickly to issues.
Improved Cost Control
The dashboard highlights high-cost departments. As a result, companies reduce unnecessary expenses.
Higher Equipment Efficiency
Downtime analysis helps improve maintenance schedules. Consequently, uptime increases.
Better Profitability Monitoring
Profit margin charts reveal trends clearly. Therefore, executives optimize production strategy.
Enhanced ESG Compliance
Safety and CO2 tracking ensures regulatory compliance.
Centralized Reporting
All KPIs appear in one structured system. Thus, reporting becomes simple and professional.
Best Practices for the Mining Dashboard in Power BI
To maximize results, follow these best practices:
Use Clean and Structured Data
Always organize source data properly. Avoid duplicate records.
Define Clear KPIs
Choose KPIs that align with company goals.
Use Proper Data Modeling
Create relationships between tables correctly.
Update Data Regularly
Schedule automatic refresh to maintain accuracy.
Apply Clear Visual Design
Use consistent colors and simple charts.
Train Your Team
Teach managers how to use slicers and filters.
Therefore, your dashboard delivers maximum value.
How Can Mining Companies Implement This Dashboard Successfully?
Follow these steps:
- Collect production and cost data
- Clean and validate the data
- Import into Power BI
- Create data relationships
- Build KPI measures
- Design interactive visuals
- Test performance
- Publish and share reports
As a result, implementation becomes smooth and effective.
Conclusion
The mining industry demands precision, efficiency, and sustainability. However, manual reports slow down decision-making.
A Mining Dashboard in Power BI transforms raw operational data into powerful insights. Moreover, it centralizes cost, production, equipment, and ESG metrics in one structured system.
Therefore, mining companies improve profitability, reduce downtime, and enhance safety performance.
If you want faster decisions and better operational control, this dashboard becomes an essential tool.
Frequently Asked Questions with Answers
What is a Mining Dashboard in Power BI?
A Mining Dashboard in Power BI is an interactive reporting system that tracks production, cost, equipment, and ESG KPIs in real time.
Why should mining companies use Power BI?
Because Power BI provides interactive visualization, real-time updates, and advanced analytics for large datasets.
What KPIs are included in this dashboard?
The dashboard includes financial, production, equipment, and ESG KPIs such as revenue, ore mined, downtime hours, and CO2 emissions.
Can this dashboard connect to Excel?
Yes. Power BI easily connects to Excel files, databases, and ERP systems.
How often should companies update the dashboard?
Companies should update the dashboard daily or weekly depending on operational needs.
Does this dashboard improve profitability?
Yes. It highlights cost drivers and performance gaps, which helps managers improve profit margins.
Visit our YouTube channel to learn step-by-step video tutorials
Watch the step-by-step video tutorial:
Click to buy Mining Dashboard in Power BI