In today’s fast-growing mobile gaming industry, data plays a crucial role in success. Game developers, publishers, and marketers constantly deal with massive amounts of data such as revenue, user activity, marketing performance, and in-app purchases. However, when this data stays scattered across multiple sources, it becomes difficult to track performance and make smart decisions.
So, how can you monitor your mobile gaming performance, increase revenue, and improve user engagement—all in one place?
Click to Purchases Mobile Gaming Dashboard in Power BI
👉 The answer is the Mobile Gaming Dashboard in Power BI.
This powerful and interactive dashboard transforms raw gaming data into clear, visual insights. As a result, you can easily track key metrics, identify trends, and optimize your gaming strategy. In this detailed guide, you will learn everything about this dashboard, including its features, benefits, best practices, and frequently asked questions.
📊 What is a Mobile Gaming Dashboard in Power BI?
A Mobile Gaming Dashboard in Power BI is a dynamic data visualization tool designed to track and analyze gaming performance in real time.
Instead of relying on manual reports, this dashboard allows you to:
- 🎮 Track total revenue and ad revenue
- 📱 Monitor active users and engagement
- 💰 Analyze in-app purchase performance
- 📊 Evaluate marketing spend effectiveness
- 🌍 Understand performance by country, platform, and genre
Therefore, you can make faster, data-driven decisions and improve your overall gaming strategy.
🚀 Why Do You Need a Mobile Gaming Dashboard?
Many gaming businesses struggle with data management. Although they collect huge amounts of data, they often fail to use it effectively.
However, with a Power BI dashboard:
- You centralize all data in one place
- You reduce manual reporting effort
- You gain real-time insights
- You improve decision-making speed
As a result, you stay ahead of competitors and maximize your game’s success.
📌 Key Features of Mobile Gaming Dashboard in Power BI
This dashboard consists of 5 powerful pages, each designed to give you deep insights into your gaming business.
🧭 1. Overview Page – Get a Complete Snapshot
The Overview Page provides a high-level summary of your mobile gaming performance. It helps you quickly understand how your games are performing.
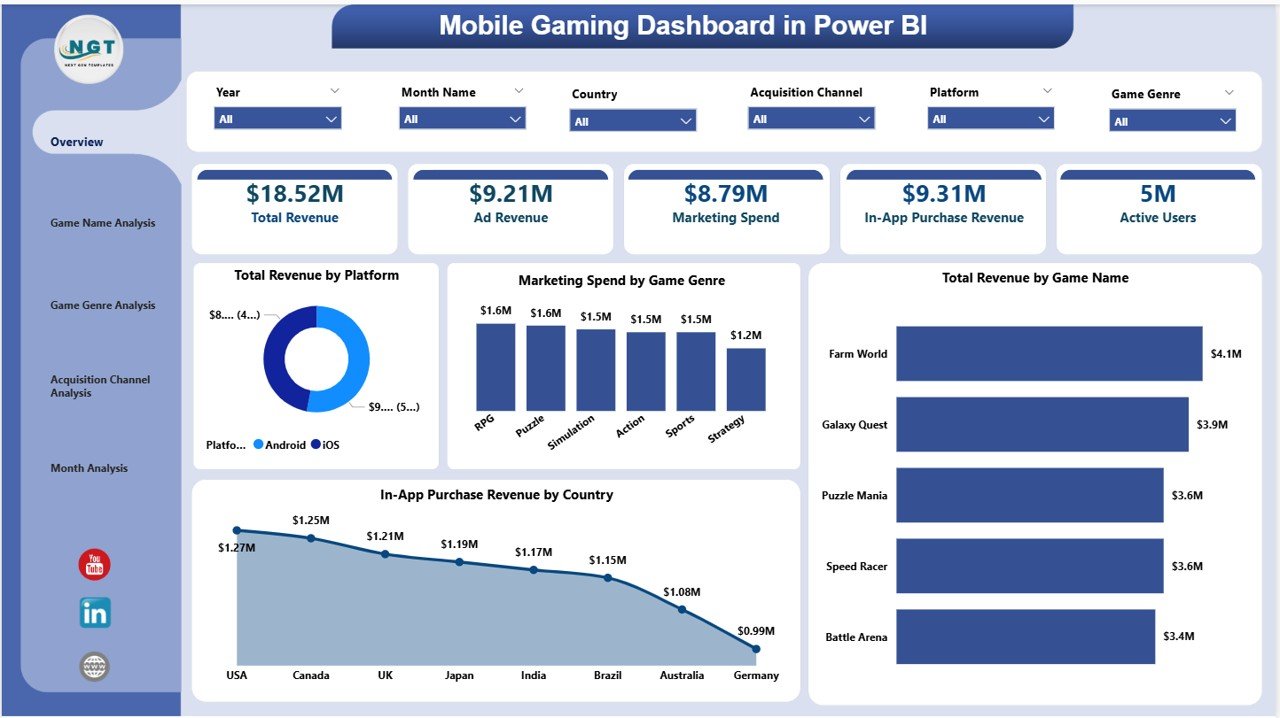
🔢 KPI Cards:
- 💰 Total Revenue
- 📢 Ad Revenue
- 💸 Marketing Spend
- 🛒 In-App Purchase Revenue
- 👥 Active Users
📊 Charts:
- Total Revenue by Platform
- Marketing Spend by Game Genre
- Total Revenue by Game Name
- In-App Purchase Revenue by Country
👉 Therefore, this page gives you a quick and clear overview of your entire gaming business.
🎮 2. Game Name Analysis – Which Game Performs Best?
The Game Name Analysis Page helps you analyze the performance of individual games.
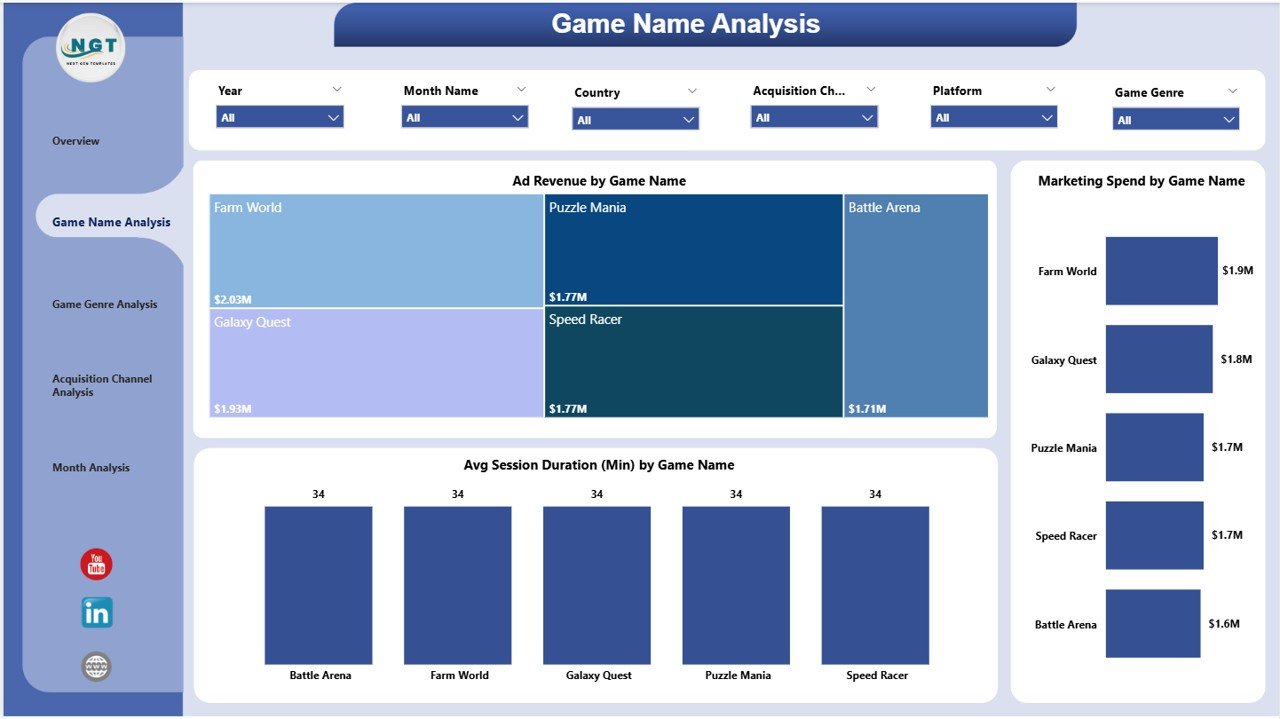
📊 Charts:
- Ad Revenue by Game Name
- Average Session Duration (Minutes) by Game Name
- Marketing Spend by Game Name
👉 As a result, you can easily identify top-performing games and optimize underperforming ones.
🎯 3. Game Genre Analysis – Which Genre Drives Growth?
The Game Genre Analysis Page focuses on performance by game category.
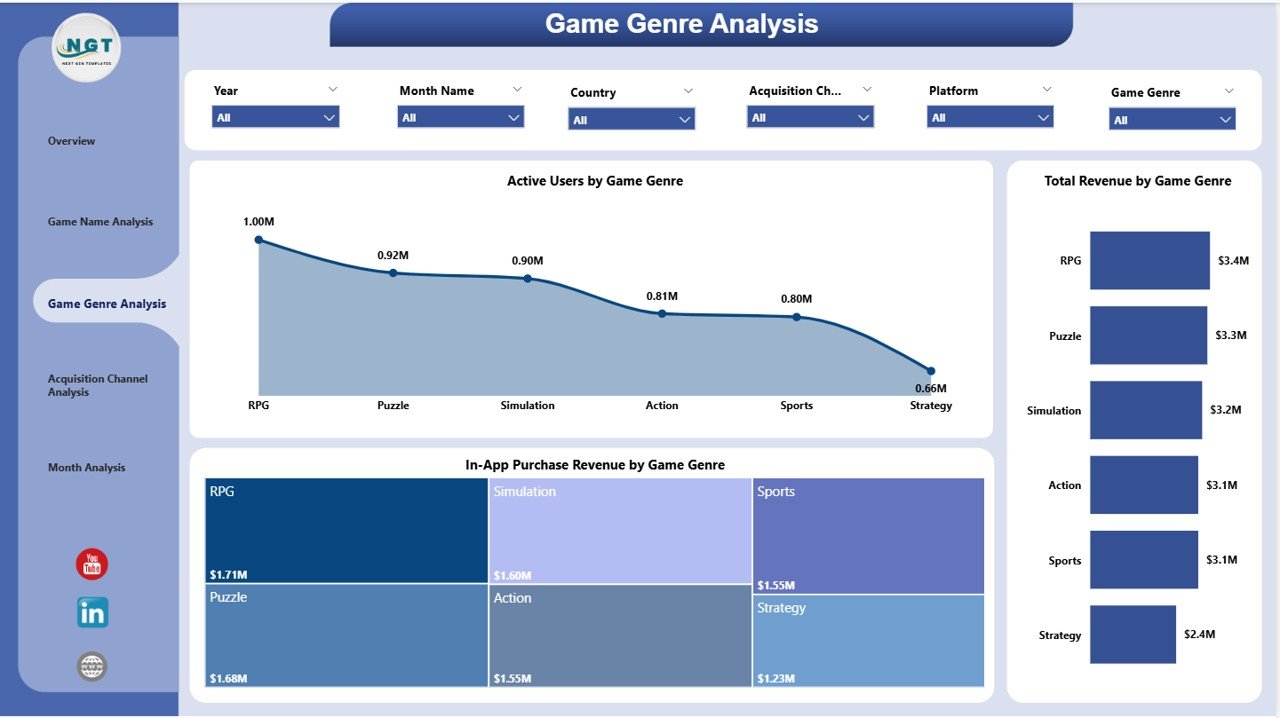
📊 Charts:
- Active Users by Game Genre
- Total Revenue by Game Genre
- In-App Purchase Revenue by Game Genre
👉 Therefore, you can understand which genres attract more users and generate higher revenue.
📢 4. Acquisition Channel Analysis – Where Do Your Users Come From?
The Acquisition Channel Analysis Page shows how different marketing channels perform.
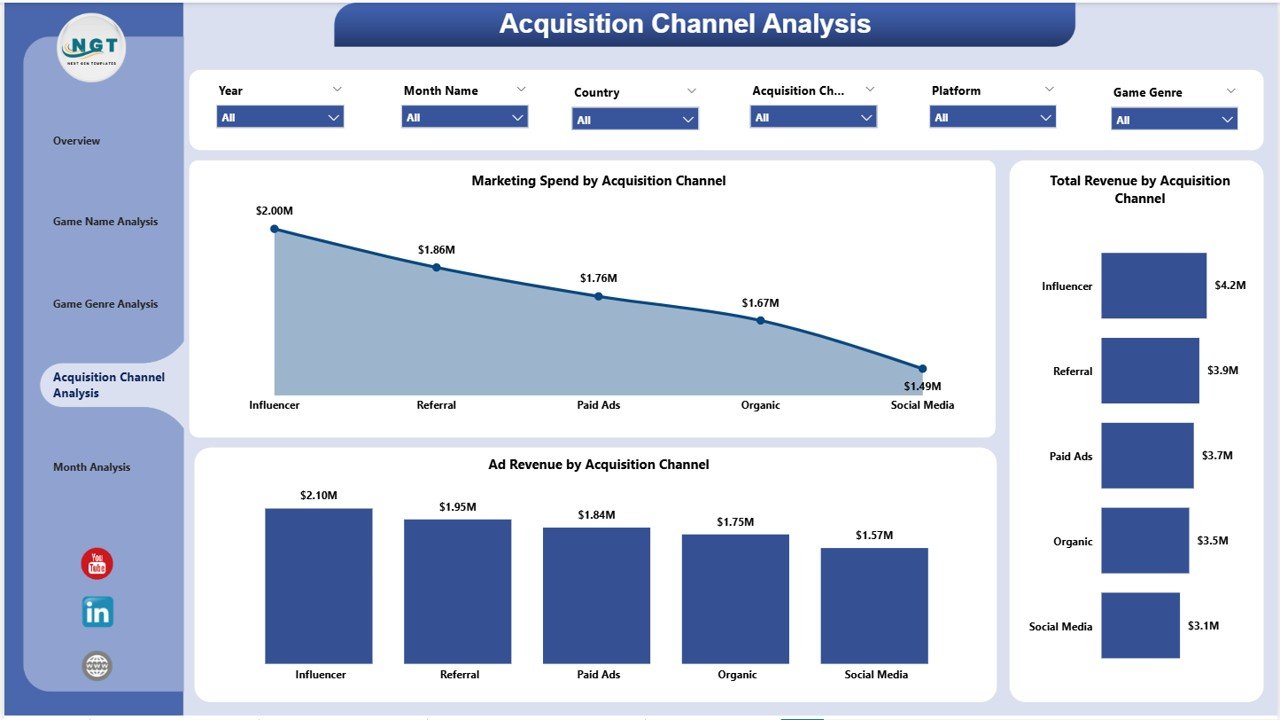
📊 Charts:
- Marketing Spend by Acquisition Channel
- Total Revenue by Acquisition Channel
- Ad Revenue by Acquisition Channel
👉 As a result, you can invest more in high-performing channels and reduce wasted spending.
📅 5. Monthly Trends – Track Growth Over Time
The Monthly Trends Page helps you monitor performance trends.
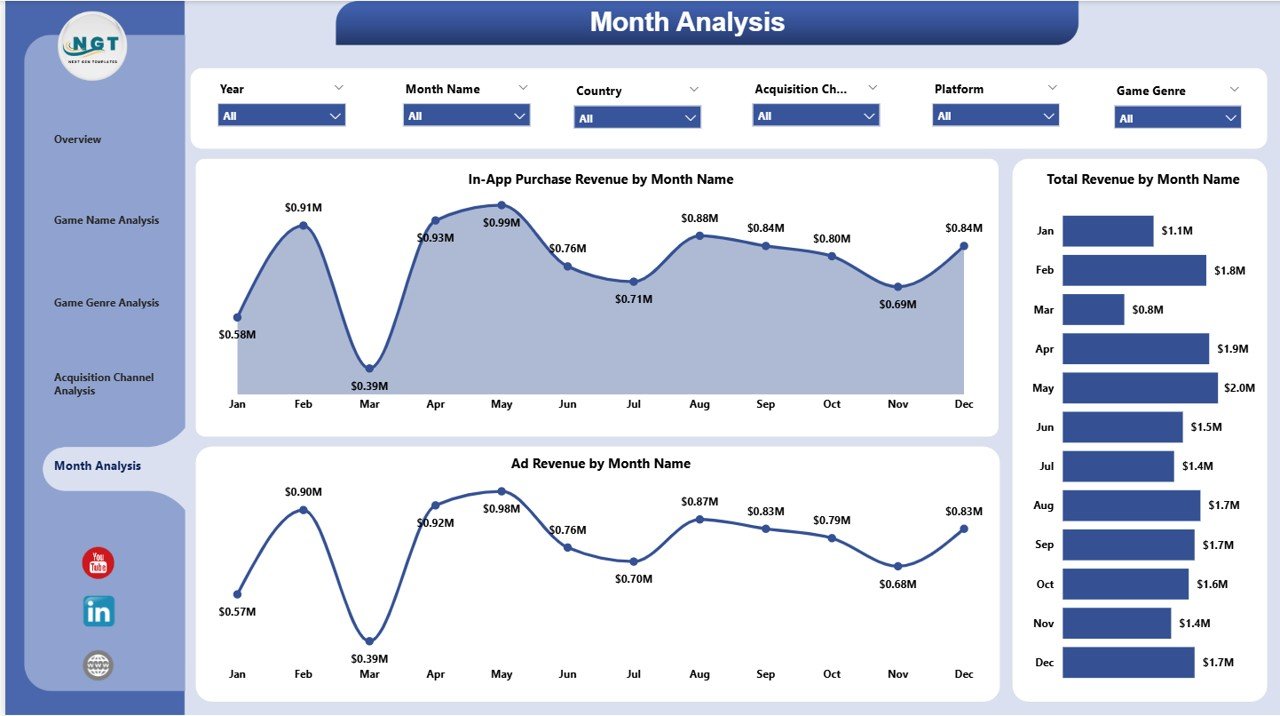
📊 Charts:
- In-App Purchase Revenue by Month
- Total Revenue by Month
- Ad Revenue by Month
👉 Therefore, you can identify seasonal trends and plan your strategy accordingly.
💡 How Does This Dashboard Help You Grow?
This dashboard does not just show numbers—it helps you take action.
Because:
- You can identify revenue trends quickly
- You can track user behavior easily
- You can optimize marketing campaigns effectively
- You can improve game performance continuously
As a result, your business grows faster and becomes more profitable.
Click to Purchases Mobile Gaming Dashboard in Power BI
✅ Advantages of Mobile Gaming Dashboard in Power BI
Using this dashboard offers multiple benefits. Let’s explore them:
🎯 Better Decision Making
- You get real-time insights
- You make faster and smarter decisions
💰 Increased Revenue
- You identify top-performing games
- You optimize monetization strategies
📊 Improved Data Visualization
- You understand complex data easily
- You reduce confusion and errors
📉 Cost Optimization
- You track marketing spend
- You reduce unnecessary expenses
👥 Enhanced User Engagement
- You analyze user behavior
- You improve retention strategies
⚙️ How to Use the Mobile Gaming Dashboard?
Using this dashboard is simple and effective.
Step-by-Step Process:
- 📥 Import your gaming data into Power BI
- 🔄 Refresh the dataset regularly
- 🎛️ Use slicers to filter data (by platform, genre, etc.)
- 📊 Analyze each page for insights
- 🎯 Take action based on data
👉 Therefore, you can easily manage and analyze your gaming data without technical complexity.
🔥 Best Practices for the Mobile Gaming Dashboard
To get the best results, you should follow these best practices:
📌 Keep Your Data Clean
- Ensure accurate and updated data
- Avoid duplicate entries
📊 Focus on Key KPIs
- Track only important metrics
- Avoid clutter
🔄 Update Data Regularly
- Refresh data frequently
- Monitor real-time changes
🎯 Use Filters Smartly
- Apply slicers effectively
- Drill down into insights
📈 Monitor Trends Consistently
- Track monthly performance
- Identify patterns early
📉 Common Challenges and How to Overcome Them
Although dashboards are powerful, you may face some challenges.
❌ Data Overload
- Too much data can confuse users
👉 Solution: Focus on key metrics only
❌ Inaccurate Data
- Poor data leads to wrong decisions
👉 Solution: Maintain data quality
❌ Lack of Insights
- Data without analysis is useless
👉 Solution: Focus on actionable insights
🎯 Who Can Benefit from This Dashboard?
This dashboard is useful for many professionals:
- 🎮 Game Developers
- 📊 Data Analysts
- 📢 Marketing Teams
- 💼 Business Owners
- 📱 Mobile App Companies
👉 Therefore, anyone involved in the gaming industry can benefit from this dashboard.
📈 How Does It Improve Business Performance?
This dashboard directly impacts your business growth.
Because:
- You identify profitable games
- You improve marketing ROI
- You enhance user experience
- You increase retention rates
As a result, your overall performance improves significantly.
🧠 Future of Mobile Gaming Analytics
The mobile gaming industry continues to grow rapidly. Therefore, data analytics becomes even more important.
In the future:
- AI-driven insights will improve decision-making
- Real-time analytics will become standard
- Personalized gaming experiences will increase
👉 Hence, dashboards like this will play a crucial role in success.
🏁 Conclusion
The Mobile Gaming Dashboard in Power BI is a powerful tool for anyone in the gaming industry. It helps you track performance, analyze data, and make smarter decisions.
Moreover, it simplifies complex data into clear insights. As a result, you can improve revenue, optimize marketing, and enhance user engagement.
So, if you want to take your mobile gaming business to the next level, this dashboard is a must-have tool.
❓ Frequently Asked Questions (FAQs)
1. What is a Mobile Gaming Dashboard in Power BI?
It is a data visualization tool that helps track gaming performance, revenue, and user engagement.
2. Who should use this dashboard?
Game developers, analysts, marketers, and business owners can use it.
3. Can beginners use this dashboard?
Yes, the dashboard is user-friendly and easy to understand.
4. What data is required for this dashboard?
You need data related to revenue, users, marketing spend, and game performance.
5. How often should I update the dashboard?
You should update it regularly, preferably daily or weekly.
6. Does this dashboard support real-time data?
Yes, Power BI supports real-time data integration.
7. Can I customize this dashboard?
Yes, you can modify it based on your business needs.
8. How does it improve revenue?
It helps identify trends, optimize strategies, and improve decision-making.
Click to Purchases Mobile Gaming Dashboard in Power BI
Visit our YouTube channel to learn step-by-step video tutorials