Managing a mortgage lending business requires constant tracking of performance, compliance, efficiency, and growth. However, when data remains scattered across spreadsheets and reports, decision-making becomes slow and unclear. Therefore, mortgage lenders increasingly rely on interactive dashboards to monitor key metrics in real time.
That is exactly where the Mortgage Lenders KPI Dashboard in Power BI becomes a powerful solution.
In this detailed article, you will learn what a Mortgage Lenders KPI Dashboard in Power BI is, why it is important, how it works, its page-wise structure, key features, advantages, opportunities for improvement, best practices, and frequently asked questions. Moreover, the language remains clear, practical, and business-focused, making this guide useful for both technical and non-technical professionals.
Click to Purchases Mortgage Lenders KPI Dashboard in Power BI
What Is a Mortgage Lenders KPI Dashboard in Power BI?
A Mortgage Lenders KPI Dashboard in Power BI is a ready-to-use analytical tool that helps mortgage companies track, analyze, and compare their key performance indicators (KPIs) in one centralized visual platform.
Instead of manually reviewing raw Excel files, this dashboard transforms structured KPI data into interactive cards, tables, charts, and slicers. As a result, leadership teams can instantly understand performance trends, identify gaps, and take corrective action.
Moreover, this dashboard uses Excel as the data source and Power BI as the visualization layer, which makes it flexible, scalable, and easy to maintain.
Why Do Mortgage Lenders Need a KPI Dashboard?
Mortgage lending involves multiple departments, including sales, underwriting, operations, compliance, and finance. Therefore, tracking performance without a unified view often leads to delays and missed opportunities.
A Mortgage Lenders KPI Dashboard in Power BI helps because:
-
It provides real-time visibility into performance.
-
It compares actual vs target metrics clearly.
-
It tracks MTD (Month-to-Date) and YTD (Year-to-Date) trends.
-
It highlights problem areas using visual indicators.
-
It supports data-driven strategic decisions.
As a result, mortgage lenders gain control, clarity, and confidence in their reporting.
Click to Purchases Mortgage Lenders KPI Dashboard in Power BI
What KPIs Can Mortgage Lenders Track Using This Dashboard?
Mortgage lenders can track a wide range of KPIs depending on business goals. However, this dashboard structure supports all common KPI categories, such as:
-
Loan Processing Efficiency KPIs
-
Sales & Origination KPIs
-
Portfolio Performance KPIs
-
Risk & Compliance KPIs
-
Customer Experience KPIs
-
Financial Performance KPIs
Because the dashboard uses a KPI Definition sheet, organizations can easily add, modify, or remove KPIs without redesigning the visuals.
Key Features of the Mortgage Lenders KPI Dashboard in Power BI
This dashboard is designed to deliver maximum insights with minimum effort. Below are its core features explained clearly.
How Many Pages Are There in the Dashboard?
The Mortgage Lenders KPI Dashboard in Power BI contains three structured pages in the Power BI Desktop file. Each page serves a specific analytical purpose.
What Is Included in the Summary Page?
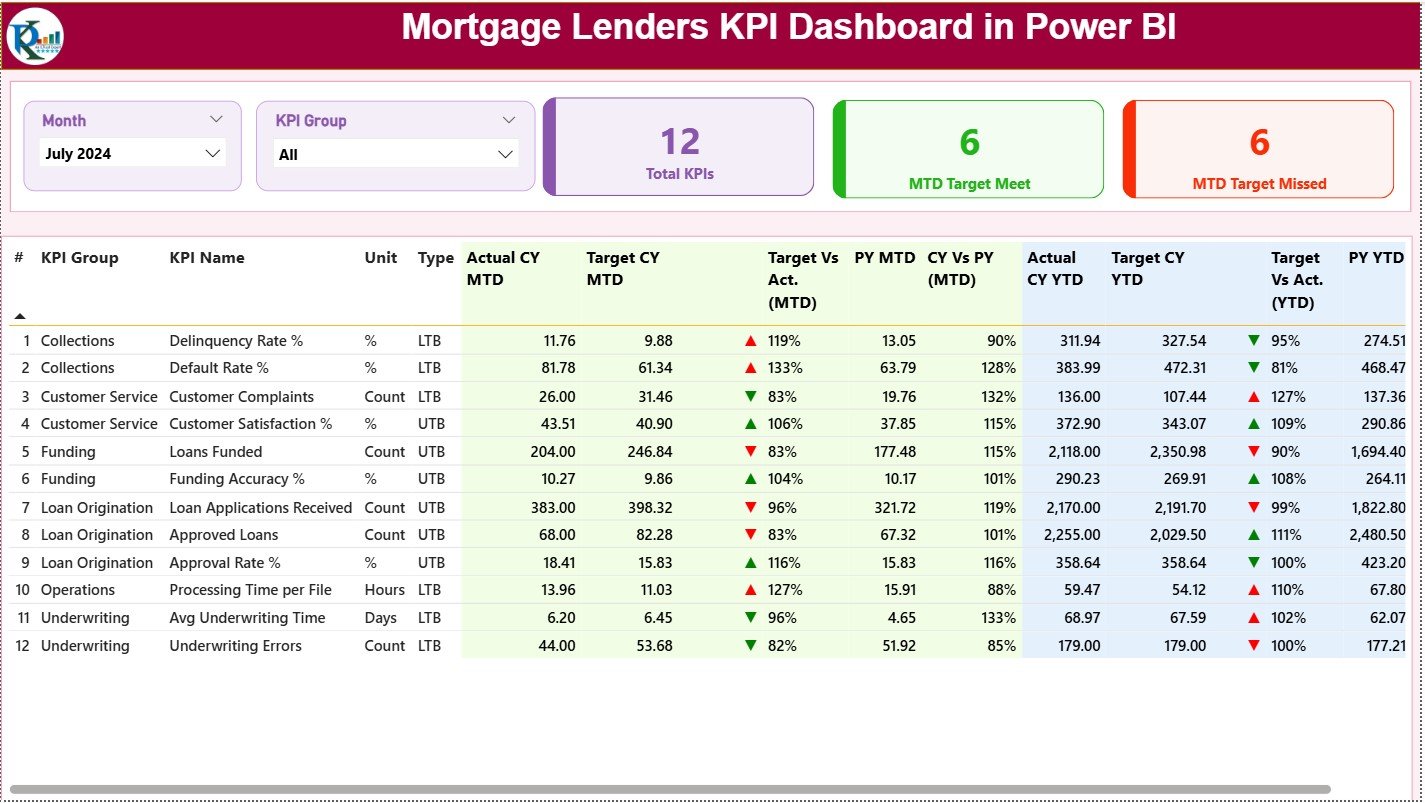
The Summary Page acts as the main control center of the dashboard.
Key Elements on the Summary Page
Top Slicers
-
📅 Month Slicer – Select a specific month for analysis
-
📊 KPI Group Slicer – Filter KPIs by category
KPI Cards
-
🔢 Total KPIs Count
-
✅ MTD Target Met Count
-
❌ MTD Target Missed Count
These cards instantly show how many KPIs perform well and how many need attention.
Detailed KPI Performance Table
The Summary Page also includes a detailed table with the following columns:
-
KPI Number – Sequential number of the KPI
-
KPI Group – Category of the KPI
-
KPI Name – Name of the KPI
-
Unit – Measurement unit (%, Days, Count, USD, etc.)
-
Type – LTB (Lower the Better) or UTB (Upper the Better)
Current Performance Metrics
-
Actual CY MTD – Current Year actual MTD value
-
Target CY MTD – Current Year target MTD value
-
MTD Icon – ▲ or ▼ icon in green or red indicating performance
Comparison Metrics
-
Target vs Actual (MTD) – Actual ÷ Target
-
PY MTD – Previous Year MTD value
-
CY vs PY (MTD) – CY MTD ÷ PY MTD
Year-to-Date Metrics
-
Actual CY YTD
-
Target CY YTD
-
YTD Icon – Visual indicator of YTD performance
-
Target vs Actual (YTD)
-
PY YTD
-
CY vs PY (YTD)
Because of this structure, users can compare targets, historical trends, and current performance in one view.
How Does the KPI Trend Page Help in Analysis?
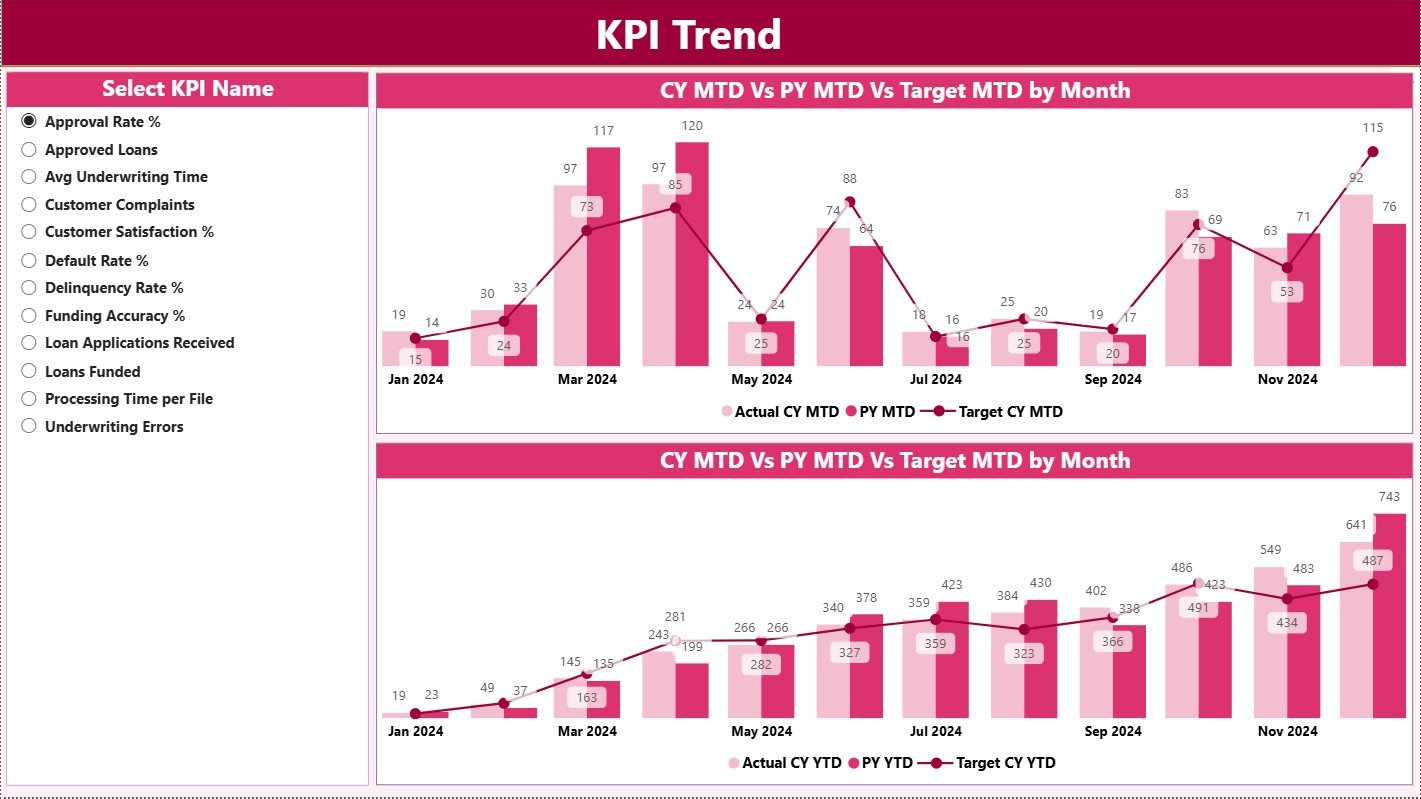
The KPI Trend Page focuses on performance trends over time.
Key Highlights of the KPI Trend Page
-
📈 MTD Combo Chart – Shows Actual CY, PY, and Target values
-
📉 YTD Combo Chart – Shows Actual CY, PY, and Target values
-
🎯 KPI Name Slicer – Select a KPI to analyze its trend
These combo charts help users understand whether performance improves, declines, or remains stable across months.
As a result, trend analysis becomes faster and more intuitive.
Click to Purchases Mortgage Lenders KPI Dashboard in Power BI
What Is the Purpose of the KPI Definition Page?
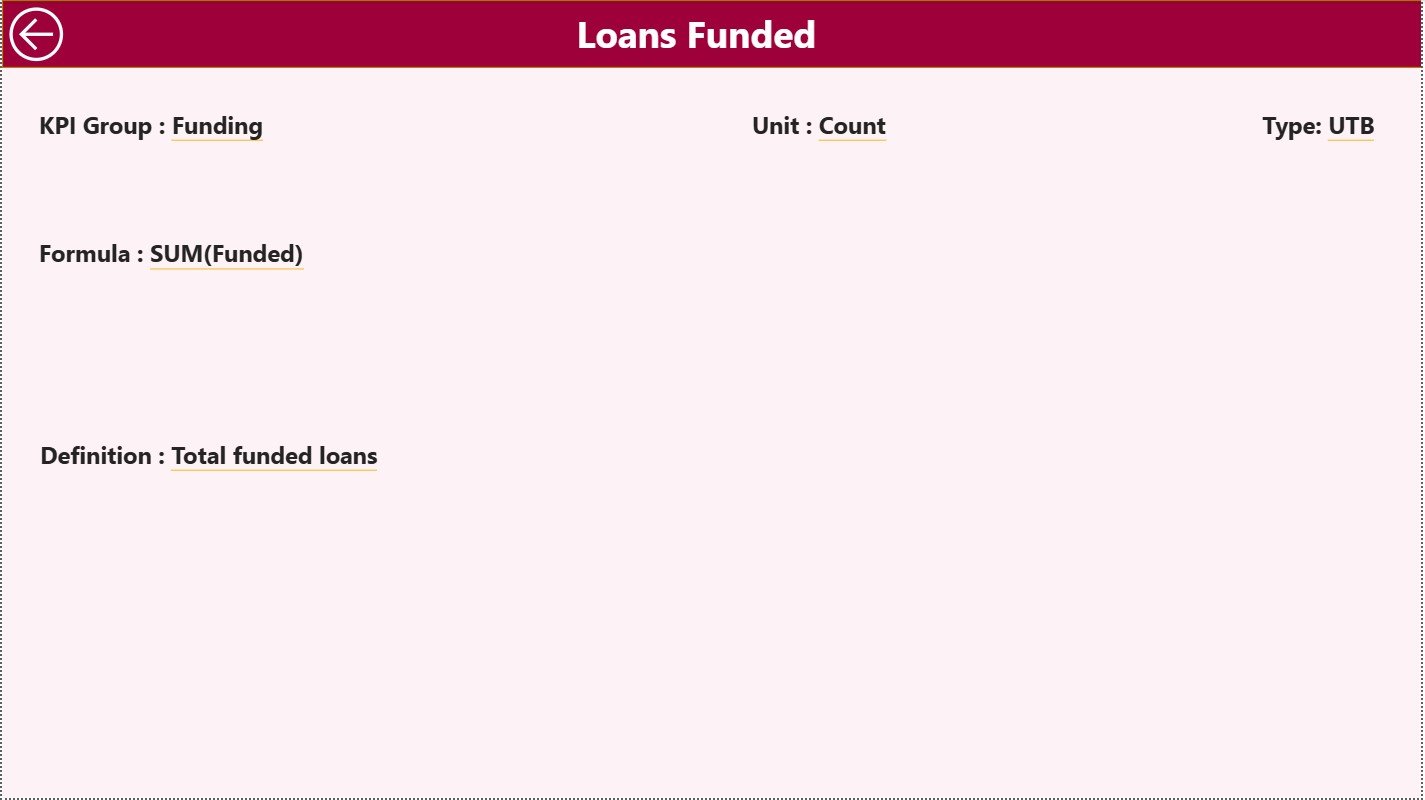
The KPI Definition Page acts as a drill-through page and remains hidden by default.
What Information Does It Show?
-
KPI Formula
-
KPI Definition
-
KPI Unit
-
KPI Type (LTB / UTB)
Users can drill through from the Summary Page to understand the logic behind each KPI. Moreover, a Back button allows easy navigation to the main page.
What Is the Excel Data Structure Used in This Dashboard?
The Mortgage Lenders KPI Dashboard in Power BI uses Excel as its data source, which makes data entry simple and structured.
Input_Actual Sheet – What Should You Enter?
In the Input_Actual worksheet, users enter:
-
KPI Name
-
Month (First date of the month)
-
MTD Actual Value
-
YTD Actual Value
This sheet captures the actual performance numbers.
Input_Target Sheet – What Data Goes Here?
In the Input_Target worksheet, users enter:
-
KPI Name
-
Month (First date of the month)
-
MTD Target Value
-
YTD Target Value
This sheet defines expected performance benchmarks.
KPI Definition Sheet – Why Is It Important?
The KPI Definition worksheet contains:
-
KPI Number
-
KPI Group
-
KPI Name
-
Unit
-
Formula
-
Definition
-
Type (LTB or UTB)
This sheet controls how KPIs behave inside the dashboard. Therefore, it acts as the foundation of the entire reporting system.
Click to Purchases Mortgage Lenders KPI Dashboard in Power BI
How Does This Dashboard Improve Mortgage Lending Performance?
This dashboard improves performance because it:
-
Centralizes all KPI data
-
Highlights underperforming metrics instantly
-
Supports historical comparison
-
Improves management reviews
-
Enhances accountability across teams
As a result, mortgage lenders gain better control over operational efficiency and profitability.
Advantages of the Mortgage Lenders KPI Dashboard in Power BI
Below are the key advantages, explained with clarity.
📊 Centralized KPI Monitoring – All KPIs appear in one dashboard
⏱️ Faster Decision-Making – No manual data crunching required
🎯 Target vs Actual Visibility – Performance gaps become obvious
📈 Trend Analysis – MTD and YTD trends support forecasting
🔄 Easy Data Updates – Just update Excel and refresh Power BI
👥 User-Friendly Design – Suitable for both analysts and leaders
Opportunities for Improvement in the Dashboard
Even a strong dashboard can improve further. Below are opportunities for improvement, presented clearly.
➕ Add loan-level drill-down analysis
➕ Include regional or branch-wise performance views
➕ Integrate risk scoring or delinquency metrics
➕ Connect live databases instead of Excel for automation
➕ Add forecast and predictive analytics
These enhancements can take the dashboard to an advanced analytical level.
Click to Purchases Mortgage Lenders KPI Dashboard in Power BI
Best Practices for the Mortgage Lenders KPI Dashboard in Power BI
To get maximum value, follow these best practices:
✅ Keep KPI definitions consistent across teams
✅ Update Excel data on a fixed schedule
✅ Limit KPIs to meaningful and actionable metrics
✅ Use slicers wisely to avoid clutter
✅ Review trends regularly, not just monthly
✅ Train users on KPI interpretation, not just visuals
By following these practices, organizations ensure long-term dashboard success.
Who Can Benefit from This Dashboard?
This dashboard benefits multiple roles, such as:
-
Mortgage Company Owners
-
Operations Managers
-
Sales & Origination Heads
-
Compliance Teams
-
Finance & Strategy Teams
-
Business Analysts
Because of its flexible design, both small lenders and large financial institutions can use it effectively.
How Is Power BI Better Than Traditional Excel Reports?
Power BI offers advantages that traditional Excel reports cannot match:
-
Interactive visuals instead of static charts
-
Drill-down and drill-through functionality
-
Cleaner and more professional presentation
-
Faster insights with fewer errors
Therefore, Power BI becomes the ideal front-end for KPI reporting.
Conclusion
The Mortgage Lenders KPI Dashboard in Power BI provides a structured, visual, and data-driven way to monitor mortgage lending performance. By combining Excel-based data input with Power BI visualization, this dashboard delivers clarity, speed, and strategic insights.
Moreover, its well-defined pages, KPI comparisons, trend analysis, and drill-through features make it an essential tool for modern mortgage lenders. When used with best practices, this dashboard transforms raw numbers into actionable intelligence.
Click to Purchases Mortgage Lenders KPI Dashboard in Power BI
Frequently Asked Questions (FAQs)
What is a Mortgage Lenders KPI Dashboard in Power BI?
It is an interactive reporting tool that tracks mortgage KPIs using Power BI visuals and Excel data sources.
Can I customize KPIs in this dashboard?
Yes, you can easily modify or add KPIs using the KPI Definition sheet.
Do I need advanced Power BI skills to use this dashboard?
No, basic Power BI knowledge and Excel data entry skills are sufficient.
How often should data be updated?
Ideally, you should update data monthly or as per reporting cycles.
Can this dashboard work for small mortgage companies?
Yes, the dashboard suits both small lenders and large enterprises.
Does the dashboard support MTD and YTD analysis?
Yes, it includes detailed MTD and YTD metrics with comparisons.
Can I integrate this dashboard with live systems?
Yes, you can replace Excel with live database connections if required.
Click to Purchases Mortgage Lenders KPI Dashboard in Power BI
Visit our YouTube channel to learn step-by-step video tutorials