Modern cities generate massive amounts of operational data every single day. Municipal departments handle citizen complaints, infrastructure maintenance, sanitation services, public utilities, and emergency requests continuously. However, many municipalities still rely on disconnected spreadsheets and manual reporting methods. As a result, decision-makers struggle to monitor service performance in real time.Therefore, city administrations increasingly adopt data-driven dashboards to improve efficiency and transparency. One powerful solution is the Municipal Services Dashboard in Power BI — an interactive analytics system designed to track municipal operations using centralized reporting and visual insights.In this detailed guide, you will learn everything about the Municipal Services Dashboard in Power BI, including its structure, features, advantages, best practices, implementation strategy, and frequently asked questions.
Click to buy Municipal Services Dashboard in Power BI
What Is a Municipal Services Dashboard in Power BI?
A Municipal Services Dashboard in Power BI is a business intelligence solution that monitors city service operations using Key Performance Indicators (KPIs), interactive visuals, and automated analytics.
Instead of reviewing multiple reports separately, municipal managers can analyze service performance from one centralized dashboard. Consequently, departments gain faster insights and improve operational decisions.
The dashboard converts raw service data into meaningful metrics such as:
- Material costs
- Labor costs
- Total operational expenses
- Resolution time for citizen requests
- Citizen satisfaction levels
- Department performance
- Channel efficiency
- Monthly service trends
Because Power BI provides interactive filtering and drill-down capabilities, users can instantly explore performance by department, service type, channel, or time period.
Why Do Municipalities Need a Power BI Dashboard?
City administrations face increasing pressure to deliver faster and better services. Meanwhile, citizens expect transparency and accountability.
Without analytics tools, municipalities often experience:
- Delayed service responses
- Poor cost visibility
- Inefficient resource allocation
- Lack of performance tracking
- Difficulty identifying problem areas
However, a Power BI dashboard solves these challenges by transforming operational data into actionable insights.
Key Benefits Include:
- Real-time performance monitoring
- Better budget control
- Improved service quality
- Faster issue resolution
- Data-driven decision-making
As cities move toward smart governance, dashboards become essential tools rather than optional systems.
Structure of the Municipal Services Dashboard in Power BI
The dashboard contains five interactive pages, each designed to analyze municipal operations from a different perspective. Together, they provide a complete view of city service performance.
Overview Page – The Central Command View
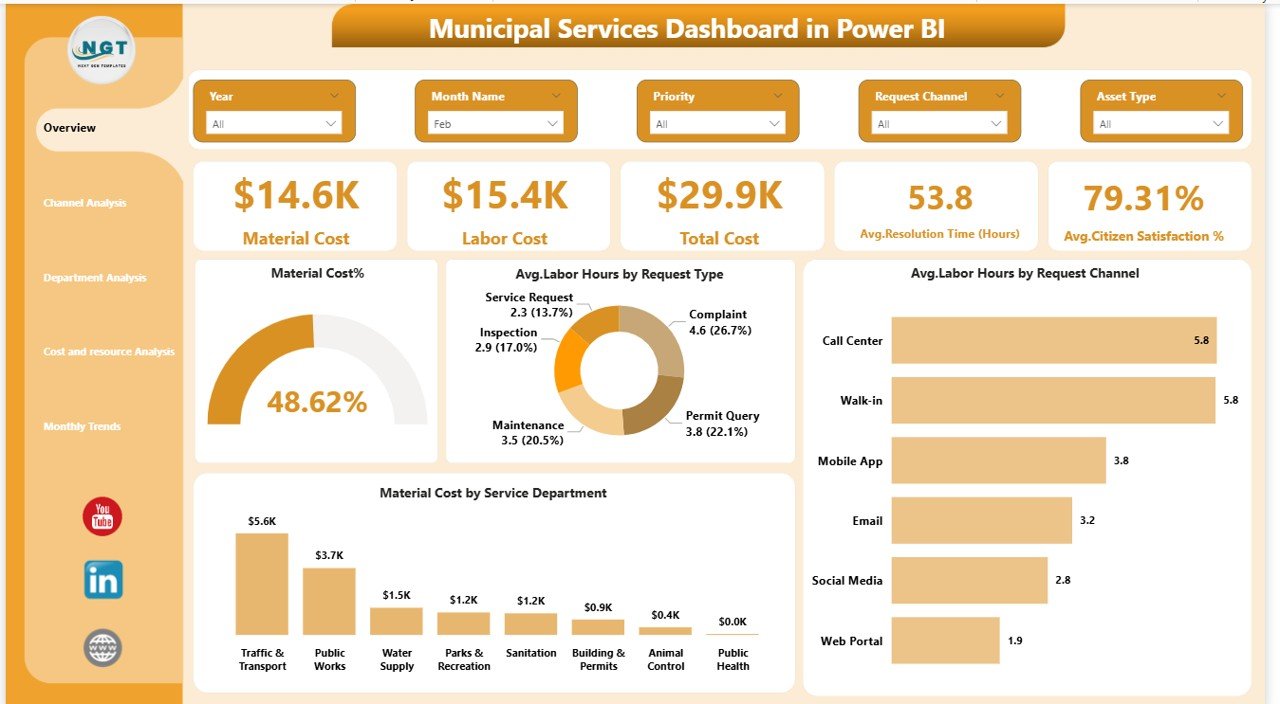
The Overview Page acts as the main control center of the dashboard. It provides a high-level snapshot of overall municipal performance.
KPI Cards Displayed
The dashboard includes five important KPI cards:
- Material Cost
- Labor Cost
- Total Cost
- Average Resolution Time (Hours)
- Average Citizen Satisfaction (%)
These cards immediately help managers understand operational health.
Charts Available
The page includes four analytical visuals:
- Material Cost Percentage
- Average Labor Hours by Request Type
- Service Performance Comparison by Request Type
- Material Cost by Service Type
Why This Page Matters
Because leaders require quick insights, this page enables instant performance evaluation. Moreover, slicers allow users to filter results by time, service type, or department.
Click to buy Municipal Services Dashboard in Power BI
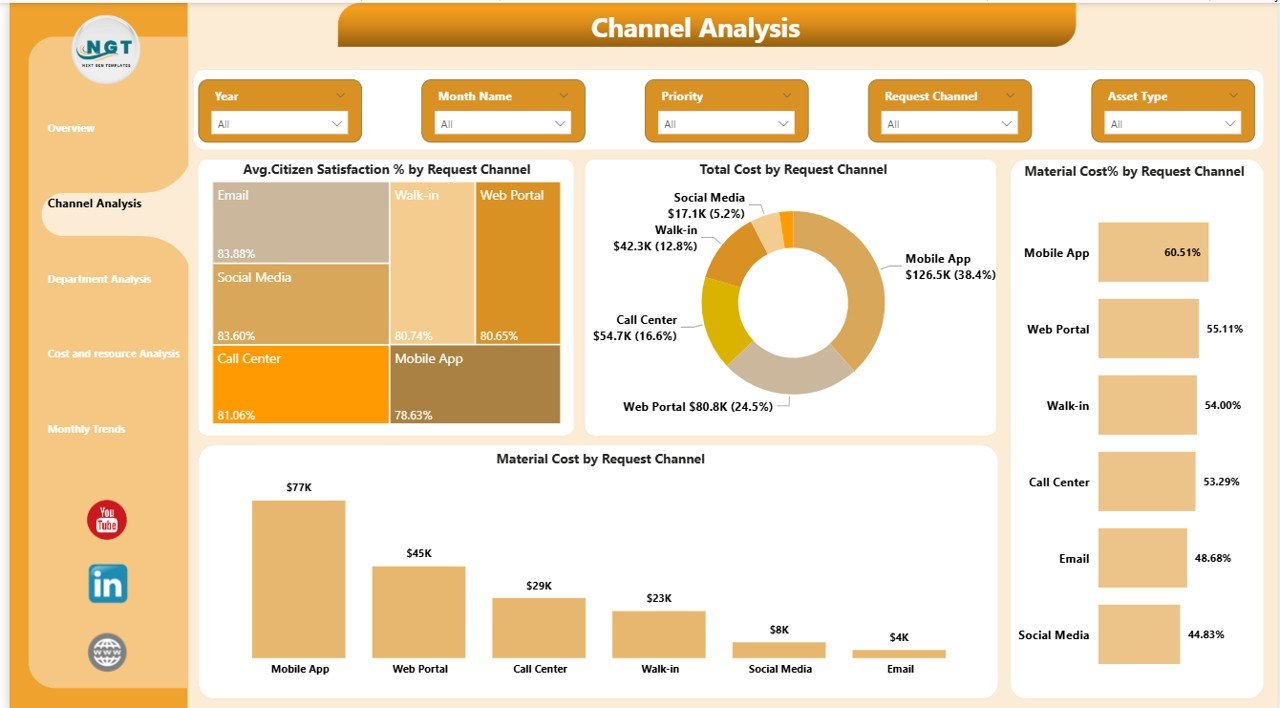
Channel Analysis – Understanding Citizen Interaction
Citizens submit service requests through multiple channels such as mobile apps, call centers, websites, or physical offices. Therefore, analyzing channel performance becomes critical.
Charts Included
- Average Citizen Satisfaction % by Request Channel
- Total Cost by Request Channel
- Material Cost % by Request Channel
- Channel Performance Comparison
Insights You Can Gain
- Which channel receives most requests
- Which channel delivers faster resolutions
- Cost efficiency across channels
- Satisfaction differences between channels
As a result, municipalities can optimize communication strategies and improve citizen experience.
Click to buy Municipal Services Dashboard in Power BI
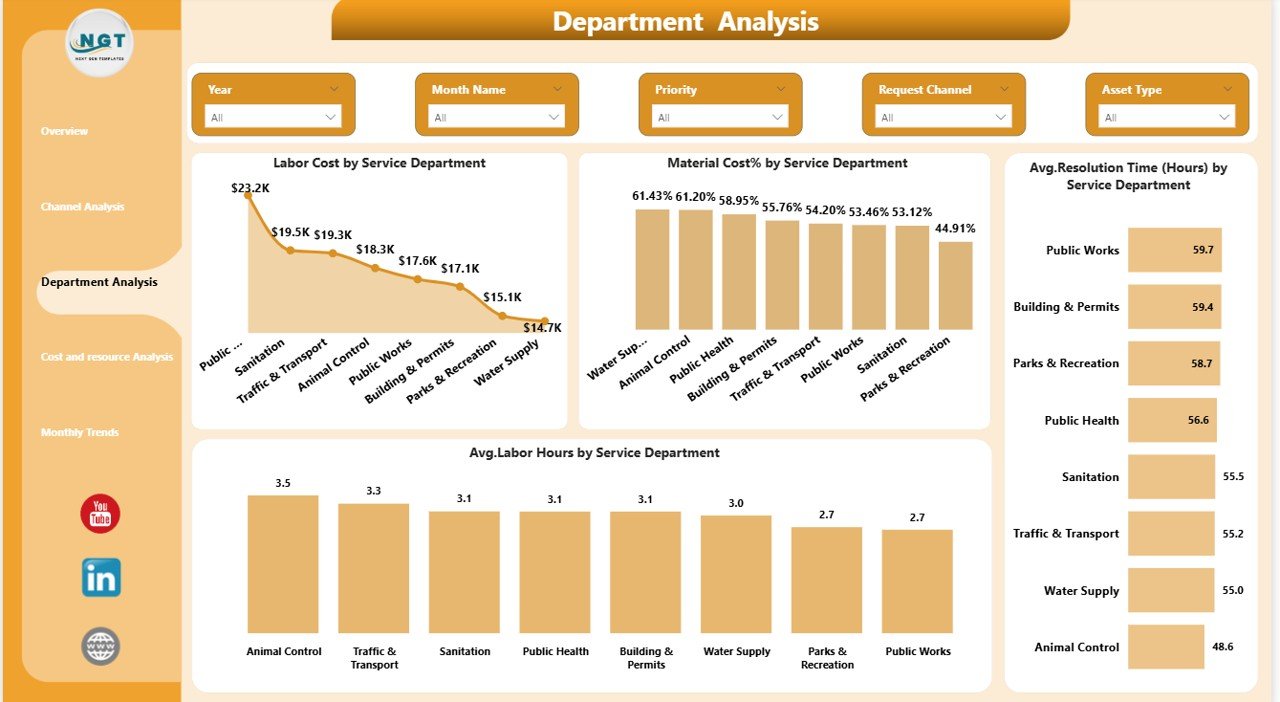
Department Analysis – Measuring Operational Efficiency
Different departments handle different responsibilities. Hence, comparing departmental performance helps identify inefficiencies.
Charts Available
- Labor Cost by Service Department
- Material Cost % by Service Department
- Average Resolution Time by Service Department
- Average Labor Hours by Service Department
Key Questions Answered
- Which department spends the most resources?
- Which department resolves issues faster?
- Where does labor efficiency decline?
- Which services require optimization?
Because managers can clearly see performance gaps, they can allocate resources more effectively.
Click to buy Municipal Services Dashboard in Power BI
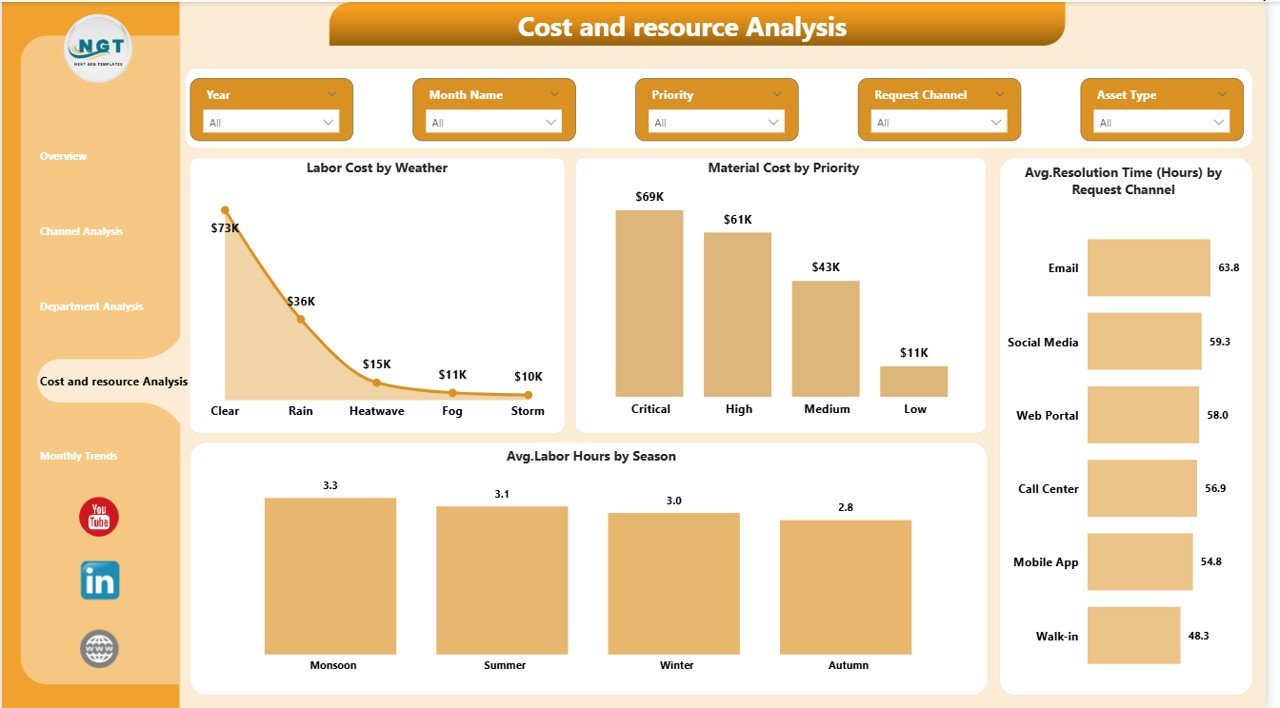
Cost and Resource Analysis – Optimizing Resource Usage
Municipal operations depend heavily on workforce planning and environmental conditions. Therefore, analyzing cost drivers becomes essential.
Charts Included
- Labor Cost by Weather Condition
- Material Cost by Priority Level
- Average Resolution Time by Request Channel
- Average Labor Hours by Season
Operational Advantages
This page helps municipalities:
- Predict seasonal workload changes
- Understand weather impact on services
- Allocate labor intelligently
- Reduce unnecessary spending
Consequently, administrations can improve both efficiency and budgeting accuracy.
Click to buy Municipal Services Dashboard in Power BI
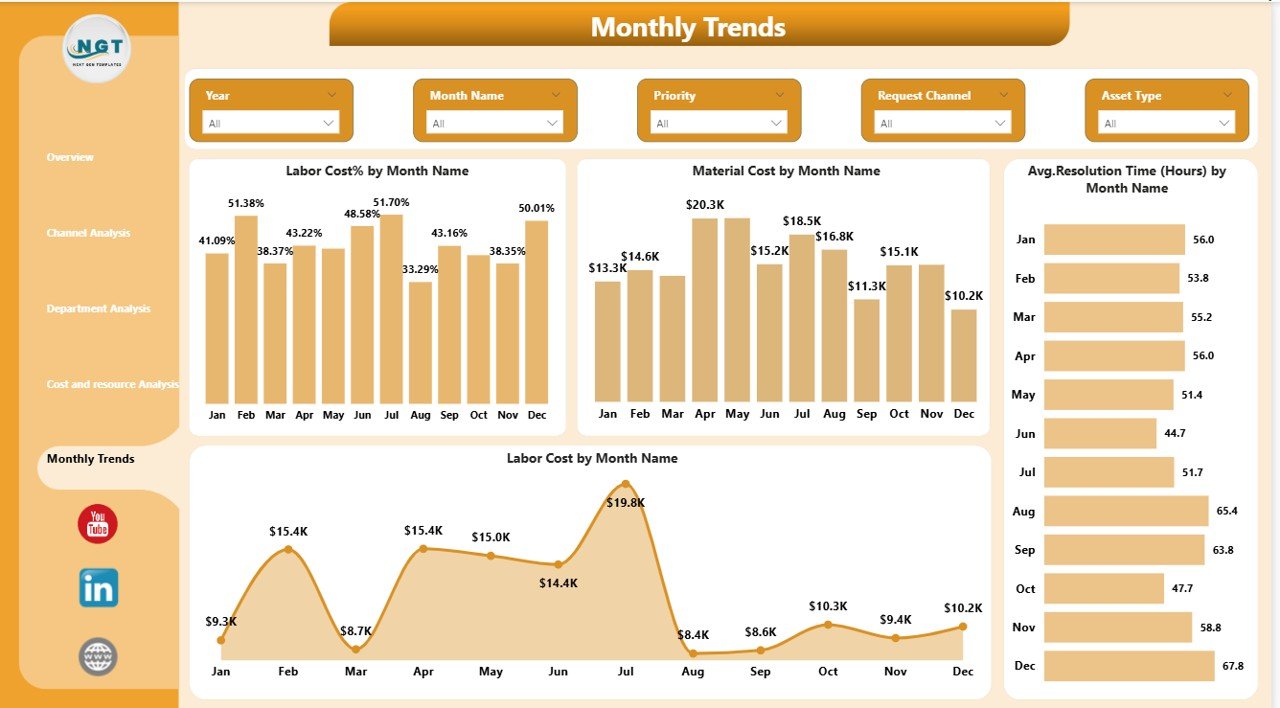
Monthly Trends – Tracking Performance Over Time
Trend analysis reveals patterns that single-period analysis cannot show. Hence, the Monthly Trends Page focuses on long-term performance monitoring.
Charts Included
- Labor Cost % by Month Name
- Material Cost by Month
- Average Resolution Time by Month
- Labor Cost by Month
Why Trend Analysis Is Important
Monthly insights help leaders:
- Detect seasonal cost spikes
- Monitor improvement initiatives
- Evaluate policy effectiveness
- Forecast future budgets
Over time, trend analysis supports strategic planning and sustainable city management.
Click to buy Municipal Services Dashboard in Power BI
What Data Does the Dashboard Require?
To operate effectively, the dashboard typically uses structured datasets containing:
- Service request ID
- Request type
- Service department
- Request channel
- Priority level
- Material cost
- Labor cost
- Labor hours
- Resolution time
- Citizen satisfaction score
- Date and month fields
- Weather or seasonal indicators
When municipalities maintain consistent data entry, analytics accuracy improves significantly.
How Does Power BI Improve Municipal Decision-Making?
Power BI enables interactive analysis rather than static reporting.
Key Capabilities
- Dynamic filtering using slicers
- Drill-down analysis
- Automated calculations
- Real-time visualization updates
- Cross-department comparison
- Data consolidation from Excel sources
Therefore, decision-makers move from reactive management to proactive governance.
Advantages of Municipal Services Dashboard in Power BI
Improved Operational Visibility
Managers instantly see service performance across departments.
Faster Issue Resolution
Teams identify bottlenecks quickly and act immediately.
Better Budget Management
Cost breakdowns help control expenses effectively.
Increased Citizen Satisfaction
Data insights support faster and higher-quality services.
Transparent Governance
Performance metrics build trust between citizens and authorities.
Resource Optimization
Labor and materials get allocated based on actual demand.
How Can Municipalities Implement This Dashboard?
Implementing the dashboard requires a structured approach.
Step-by-Step Implementation
- Collect municipal service data.
- Standardize data formats.
- Create data tables in Excel.
- Import data into Power BI.
- Define KPIs and measures.
- Design dashboard pages.
- Apply slicers and filters.
- Validate calculations.
- Train staff members.
- Monitor and update regularly.
When teams follow these steps, implementation becomes smooth and scalable.
Best Practices for the Municipal Services Dashboard in Power BI
To achieve maximum benefits, municipalities should follow proven best practices.
Data Management Best Practices
- Maintain consistent naming conventions.
- Validate data regularly.
- Avoid duplicate records.
- Update datasets frequently.
Dashboard Design Best Practices
- Keep visuals simple and clear.
- Use consistent color themes.
- Highlight critical KPIs.
- Avoid overcrowding visuals.
Operational Best Practices
- Review dashboard weekly.
- Set performance benchmarks.
- Train departments on data usage.
- Encourage data-driven culture.
Because consistent usage matters more than technology itself, organizations must integrate dashboards into daily operations.
Common Challenges and How to Overcome Them
- Poor Data Quality
Solution: Establish data validation rules.
- Resistance to Technology
Solution: Provide training and demonstrate benefits.
- Lack of Standard KPIs
Solution: Define clear performance metrics.
- Data Silos
Solution: Centralize data collection systems.
By addressing these challenges early, municipalities ensure successful adoption.
Future of Municipal Analytics with Power BI
Smart cities increasingly depend on analytics platforms. In the future, municipal dashboards will integrate with:
- IoT sensors
- Smart traffic systems
- Waste management tracking
- Predictive maintenance models
- AI-driven forecasting
As technology evolves, dashboards will shift from reporting tools to predictive decision engines.
Conclusion
The Municipal Services Dashboard in Power BI transforms how cities monitor and manage public services. Instead of relying on fragmented reports, municipalities gain a centralized, interactive view of operations.
Because the dashboard tracks costs, performance, resolution time, and citizen satisfaction together, leaders can make faster and smarter decisions. Moreover, departments improve accountability while citizens experience better service quality.
Ultimately, adopting a municipal dashboard represents a major step toward efficient, transparent, and data-driven governance.
Frequently Asked Questions (FAQs)
- What is the purpose of a Municipal Services Dashboard in Power BI?
It helps municipalities monitor operational performance, costs, and citizen satisfaction using interactive analytics.
- Who can use this dashboard?
City administrators, department managers, analysts, and municipal planners can use it for performance monitoring.
- Does the dashboard require technical expertise?
Basic Power BI knowledge helps, but users mainly interact through filters and visuals, which remain user-friendly.
- Can municipalities customize KPIs?
Yes. Organizations can modify KPIs according to service priorities and operational goals.
- What data source does the dashboard use?
Most implementations use Excel or database sources connected directly to Power BI.
- How often should data be updated?
Municipalities should update data daily or weekly depending on service volume.
- Can this dashboard improve citizen satisfaction?
Yes. Faster insights lead to quicker service improvements, which increases citizen satisfaction.
- Is Power BI suitable for smart city initiatives?
Absolutely. Power BI supports scalable analytics and integrates easily with modern data systems.
Watch the step-by-step video tutorial:
Visit our YouTube channel to learn step-by-step video tutorials
Click to buy Municipal Services Dashboard in Power BI