Managing music concerts and performing arts events requires creativity, planning, and strong financial control. However, many event organizers still rely on scattered Excel sheets, manual calculations, and static reports. As a result, decision-making becomes slow and error-prone. Therefore, a Music and Performing Arts Dashboard in Excel becomes an essential solution for modern event managers, venue owners, cultural organizations, and production teams.
In this detailed article, you will learn what a Music and Performing Arts Dashboard in Excel is, how it works, why it matters, its advantages, best practices, and common questions. Moreover, this guide uses simple language, practical examples, and structured explanations so you can implement the dashboard easily.
Click to buy Music and Performing Arts Dashboard in Excel
What Is a Music and Performing Arts Dashboard in Excel?
A Music and Performing Arts Dashboard in Excel is a ready-to-use analytical tool that transforms raw event data into meaningful insights. Instead of checking multiple worksheets, you can view revenue, expenses, ticket sales, profit, venue capacity, and performance trends in one interactive dashboard.
Additionally, this dashboard allows you to track event performance across event types, genres, venues, and months. Consequently, you gain complete visibility into financial health and audience engagement.
Why Do Music and Performing Arts Organizations Need a Dashboard?
Music and performing arts events involve many moving parts. For example, you manage artists, venues, ticket pricing, expenses, and audience turnout. However, manual tracking creates gaps in understanding.
Here is why dashboards matter:
- They centralize data in one place
- They reduce manual reporting time
- They improve financial visibility
- They support faster and better decisions
Therefore, a dashboard becomes a strategic asset instead of just a reporting tool.
How Does the Music and Performing Arts Dashboard in Excel Work?
The dashboard connects directly to structured Excel data tables. Once you update the source data, all charts and KPIs update automatically. As a result, you always work with the latest numbers.
The dashboard uses multiple analytical sheets, each focusing on a specific performance area. Let us explore each sheet in detail.
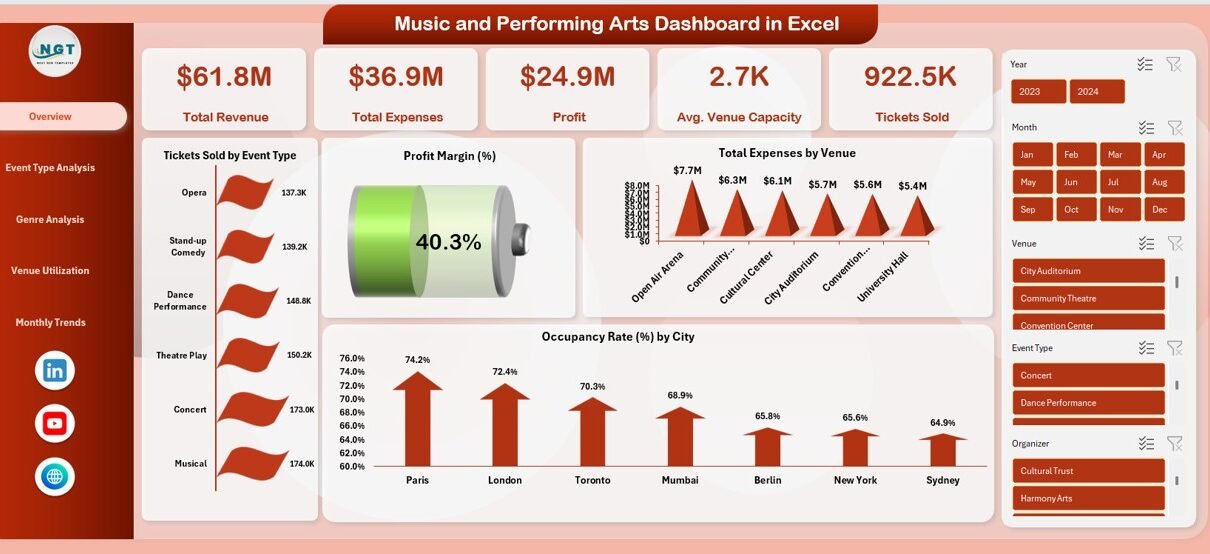
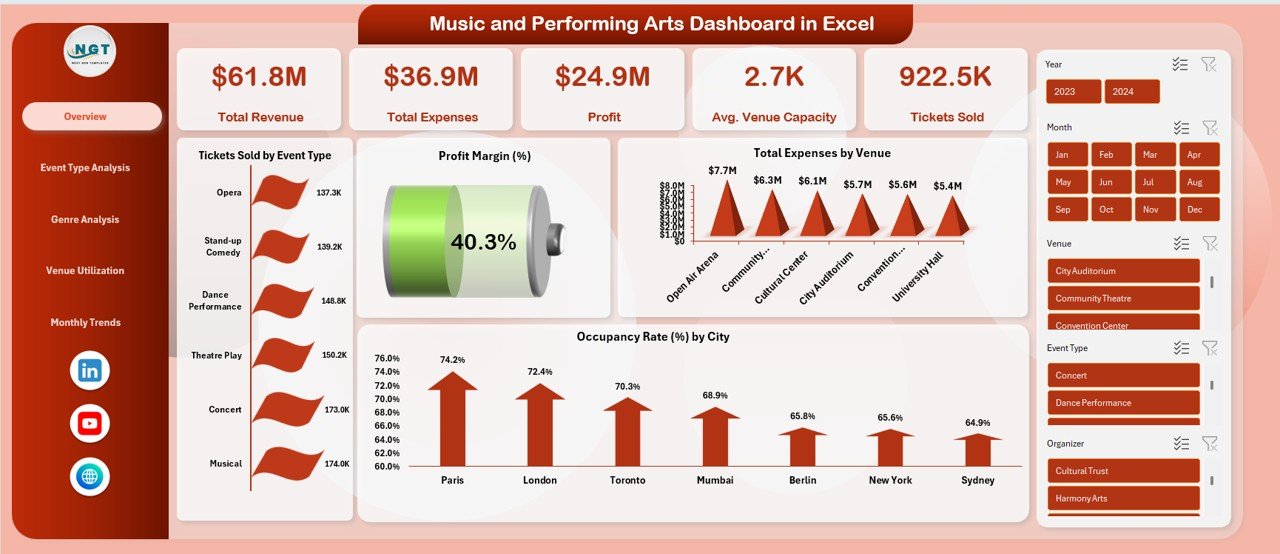
Overview Sheet
The Overview Sheet Tab provides a high-level snapshot of overall performance. It helps decision-makers understand the big picture instantly.
Key KPIs on the Overview Sheet
- Total Revenue – Shows total income from ticket sales and events
- Total Expenses – Displays cumulative event-related costs
- Profit – Calculates revenue minus expenses
- Average Venue Capacity – Shows average seating or standing capacity
- Tickets Sold – Tracks total ticket volume
- Profit Margin (%) – Highlights overall profitability
Key Charts on the Overview Sheet
- Tickets Sold by Event Type – Identifies top-performing event formats
- Total Expenses by Venue – Reveals cost-heavy venues
- Venue Capacity by Event Type – Shows capacity utilization patterns
Because of this structure, users quickly identify trends and performance gaps.
Click to buy Music and Performing Arts Dashboard in Excel
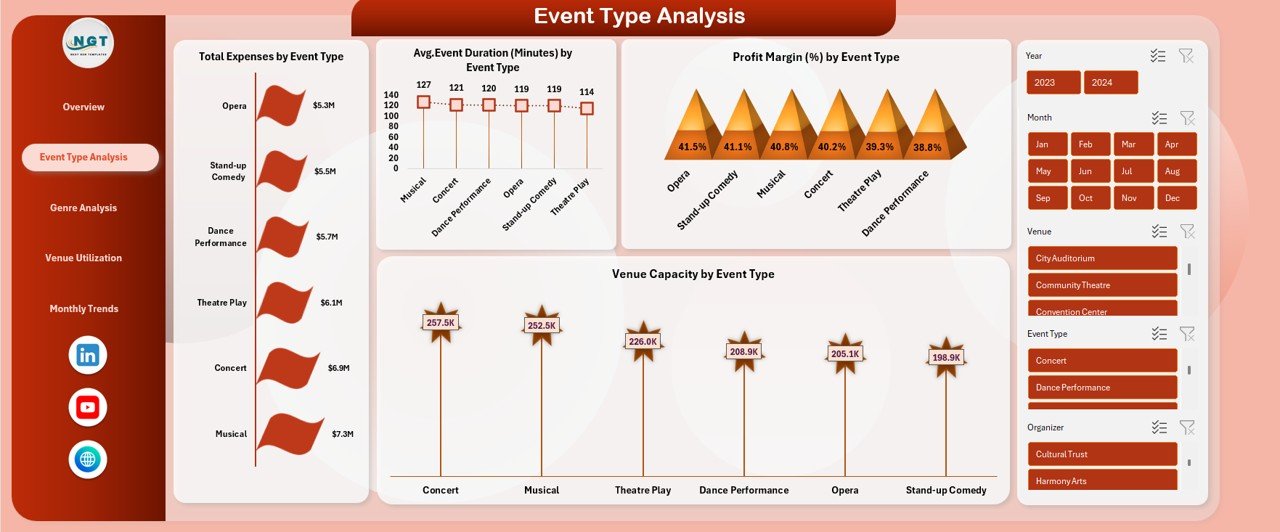
Event Type Analysis Sheet
Different event types perform differently. For instance, concerts, theatre shows, and dance performances attract different audiences. Therefore, analyzing performance by event type becomes essential.
Key Metrics in Event Type Analysis
- Total Expenses by Event Type – Identifies cost-intensive formats
- Event Duration (Minutes) by Event Type – Helps with scheduling decisions
- Profit Margin (%) by Event Type – Highlights profitable event categories
- Venue Capacity by Event Type – Shows space utilization trends
As a result, organizers can optimize event planning and resource allocation.
Click to buy Music and Performing Arts Dashboard in Excel
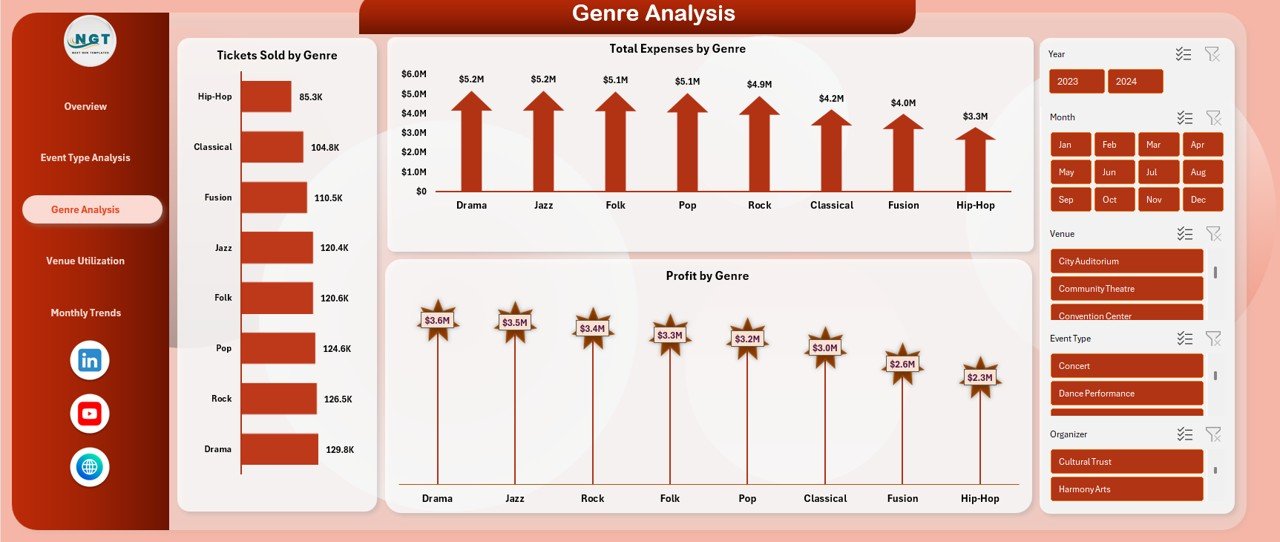
Genre Analysis Sheet
Genre plays a major role in audience engagement and ticket sales. Hence, the Genre Analysis Sheet focuses on genre-wise performance.
Key Metrics in Genre Analysis
- Tickets Sold by Genre – Identifies popular genres
- Total Expenses by Genre – Highlights cost distribution
- Profit by Genre – Shows which genres generate higher returns
Consequently, marketing teams can focus on genres that deliver maximum value.
Click to buy Music and Performing Arts Dashboard in Excel
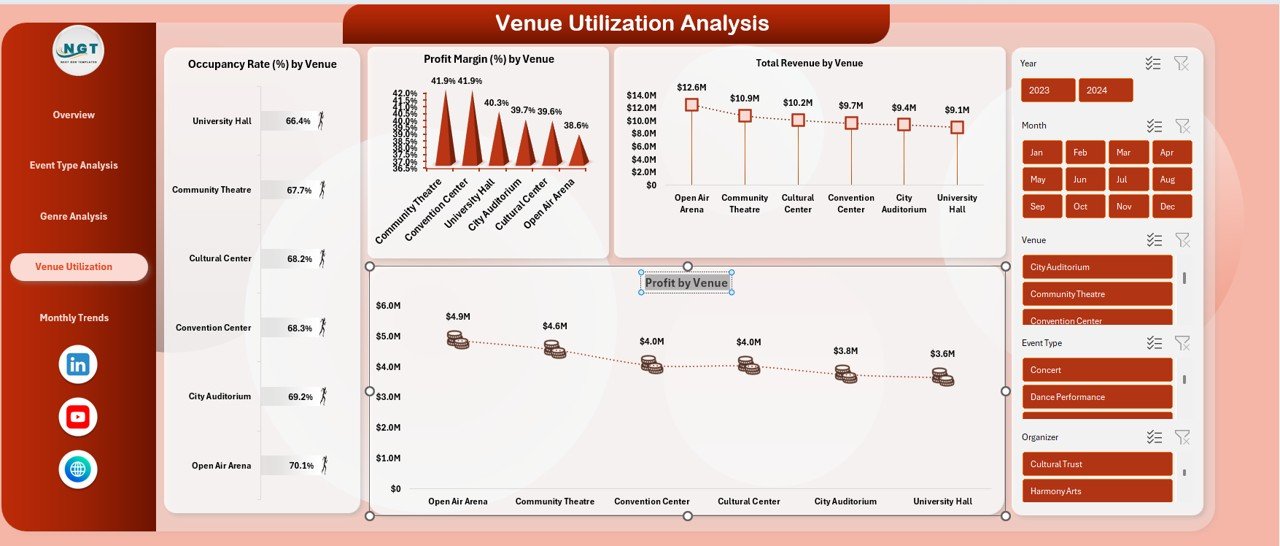
Venue Utilization Analysis
Venues represent one of the largest cost components in performing arts events. Therefore, optimizing venue usage directly impacts profitability.
Key Metrics in Venue Utilization Analysis
- Occupancy Rate (%) by Venue – Shows how well venues fill seats
- Profit Margin (%) by Venue – Highlights profitable locations
- Total Revenue by Venue – Compares venue-wise income
- Profit by Venue – Identifies top-performing venues
Because of this analysis, organizers can negotiate better contracts and select venues strategically.
Click to buy Music and Performing Arts Dashboard in Excel
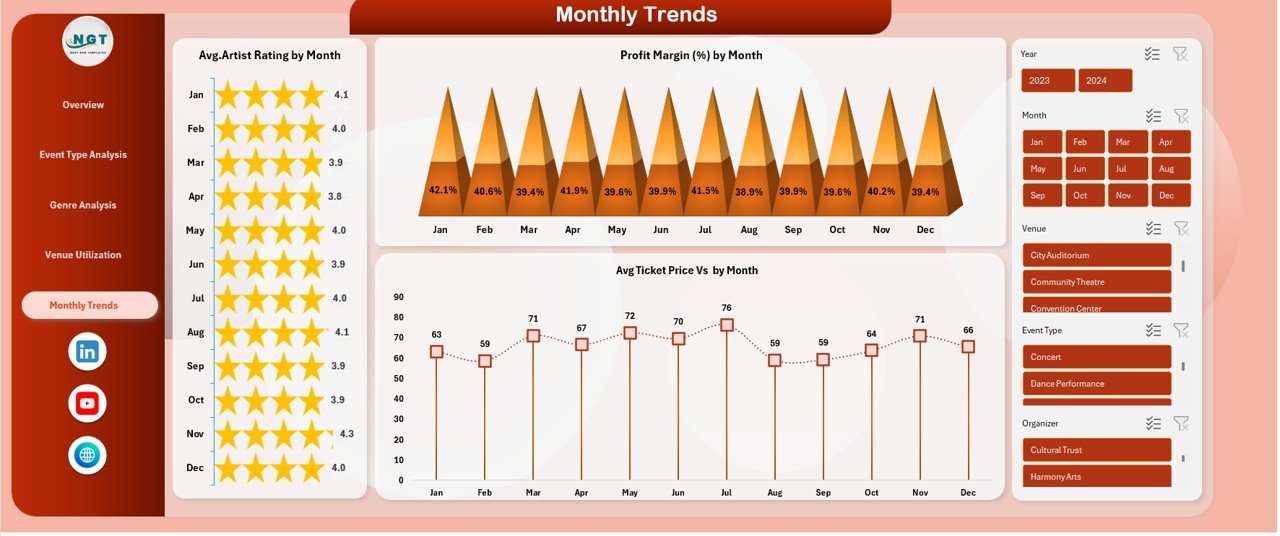
Monthly Trends
Trends over time reveal patterns that static reports often hide. Hence, the Monthly Trends Sheet plays a crucial role.
Key Monthly Trend Metrics
- Average Artist Rating by Month – Tracks performance quality trends
- Profit Margin (%) by Month – Identifies seasonal profitability
- Average Ticket Price vs Month – Shows pricing trends
As a result, teams can plan future events with better timing and pricing strategies.
Click to buy Music and Performing Arts Dashboard in Excel
What Are the Advantages of Music and Performing Arts Dashboard in Excel?
Why Should You Use This Dashboard?
The dashboard delivers multiple business benefits:
- Centralized Event Insights – View all KPIs in one place
- Improved Financial Control – Track revenue, expenses, and profit clearly
- Better Ticket Sales Analysis – Understand demand by genre and event type
- Optimized Venue Usage – Improve occupancy and cost efficiency
- Time-Saving Reporting – Reduce manual work significantly
- Data-Driven Decisions – Replace assumptions with facts
Therefore, the dashboard transforms raw data into strategic insights.
Who Can Benefit from a Music and Performing Arts Dashboard?
This dashboard suits a wide range of users:
- Event organizers
- Music festival planners
- Theatre and performing arts groups
- Cultural institutions
- Venue managers
- Arts management students
Because of its simplicity, both beginners and professionals can use it effectively.
How to Customize the Music and Performing Arts Dashboard in Excel?
Customization enhances relevance. You can modify the dashboard based on your needs.
Customization Options
- Add new event types or genres
- Modify KPIs based on business goals
- Change chart layouts and colors
- Include additional financial metrics
- Add slicers for deeper filtering
As a result, the dashboard adapts to different event models.
Best Practices for the Music and Performing Arts Dashboard in Excel
How Can You Get the Best Results?
Follow these best practices to maximize dashboard value:
- Define Clear KPIs before data entry
- Maintain Clean Data to avoid reporting errors
- Update Data Regularly for accurate insights
- Use Monthly Reviews to track trends
- Compare Venues Periodically to optimize costs
- Analyze Genres Separately for targeted marketing
- Limit KPIs Per Page to maintain clarity
By following these practices, the dashboard remains effective and reliable.
What Challenges Does This Dashboard Solve?
Many organizations face similar issues. Fortunately, this dashboard addresses them directly.
Key Problems Solved
- Lack of performance visibility
- Delayed financial reporting
- Poor venue utilization
- Unclear genre profitability
- Manual and repetitive analysis
Therefore, the dashboard becomes a problem-solving tool rather than just a report.
How Does This Dashboard Improve Strategic Planning?
Strategic planning requires accurate insights. This dashboard supports planning by:
- Identifying profitable event types
- Highlighting underperforming genres
- Showing seasonal trends
- Improving pricing strategies
- Supporting budget optimization
As a result, organizations make confident and informed decisions.
Conclusion: Why Should You Use a Music and Performing Arts Dashboard in Excel?
A Music and Performing Arts Dashboard in Excel delivers clarity, control, and confidence. Instead of guessing performance outcomes, you rely on data-driven insights. Moreover, the dashboard saves time, improves accuracy, and supports long-term growth.
If you manage music concerts, theatre shows, or cultural events, this dashboard becomes an essential companion for success.
Frequently Asked Questions About Music and Performing Arts Dashboard in Excel
What is a Music and Performing Arts Dashboard in Excel used for?
It tracks revenue, expenses, ticket sales, profit, venue utilization, and performance trends in one interactive dashboard.
Do I need advanced Excel skills to use this dashboard?
No, basic Excel knowledge is enough because the dashboard is ready to use.
Can I add my own KPIs to the dashboard?
Yes, you can customize KPIs, charts, and layouts based on your requirements.
How often should I update the data?
You should update the data regularly, preferably weekly or monthly, to maintain accuracy.
Does this dashboard support multiple venues and event types?
Yes, it supports multiple venues, event types, and genres efficiently.
Can this dashboard help improve profitability?
Yes, it highlights cost drivers, profitable genres, and venue performance, which helps improve profitability.
Visit our YouTube channel to learn step-by-step video tutorials
Watch the step-by-step video tutorial:
Click to buy Music and Performing Arts Dashboard in Excel