In today’s fast-moving digital media world, news portals operate under constant pressure. Editors, content teams, digital marketers, and management teams must track performance every single day. Traffic fluctuates quickly. Revenue depends on multiple channels. Audience behavior changes frequently. Therefore, relying on gut feeling never works anymore.
That is exactly why a News Portals KPI Dashboard in Excel becomes a powerful and practical solution.
In this detailed guide, you will learn what a News Portals KPI Dashboard in Excel is, why it matters, how it works, and how each worksheet supports better decision-making. Moreover, you will explore its advantages, best practices, and frequently asked questions. By the end, you will clearly understand how this dashboard can transform raw data into actionable insights for any news or media organization.
Click to buy News Portals KPI Dashboard in Excel
What Is a News Portals KPI Dashboard in Excel?
A News Portals KPI Dashboard in Excel is a structured, interactive reporting tool designed to track and analyze key performance indicators related to digital news platforms.
Instead of reviewing multiple spreadsheets for traffic, engagement, revenue, and operational metrics, this dashboard consolidates everything into one centralized Excel file. As a result, stakeholders can monitor performance quickly and respond faster.
Moreover, Excel-based dashboards remain popular because they offer flexibility, ease of use, and customization without requiring advanced technical skills.
Why Do News Portals Need a KPI Dashboard in Excel?
News portals generate massive amounts of data every day. Page views, unique visitors, ad impressions, subscriptions, and engagement metrics grow constantly. However, raw data alone does not create value.
A KPI dashboard helps because it:
- Converts complex data into clear visuals
- Highlights performance gaps instantly
- Tracks targets versus actual results
- Enables month-to-date and year-to-date analysis
- Supports strategic and editorial decisions
Therefore, instead of reacting late, teams act proactively.
How Does a News Portals KPI Dashboard in Excel Work?
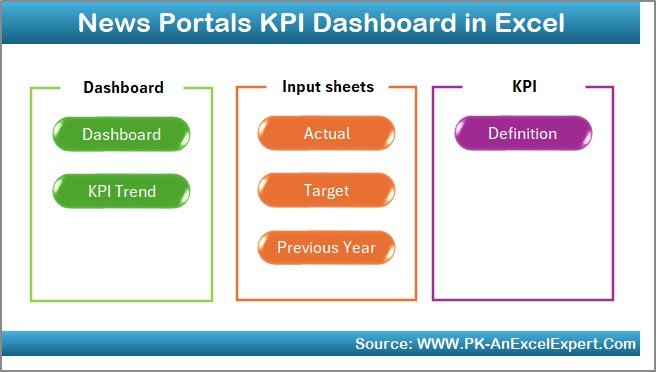
This dashboard follows a structured worksheet-based approach, where each sheet serves a specific purpose. Because of this design, users can enter data easily, analyze trends quickly, and present insights clearly.
Let us now explore each worksheet in detail.
Summary Page
Summary Page (Index Sheet)
The Summary Page acts as the entry point of the entire dashboard.
On this sheet:
- You will find six navigation buttons
- Each button takes you directly to a specific worksheet
- Users save time because they avoid manual scrolling
As a result, even non-technical users can navigate the dashboard smoothly.
This page improves usability and makes the dashboard presentation-ready.
Click to buy News Portals KPI Dashboard in Excel
Dashboard Sheet
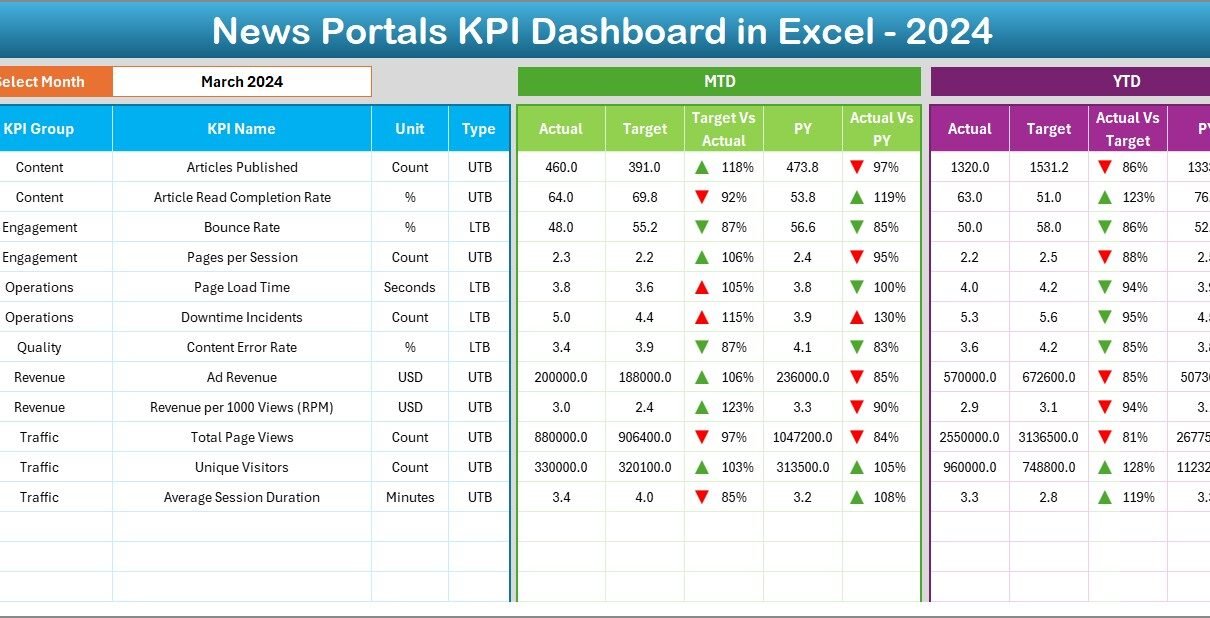
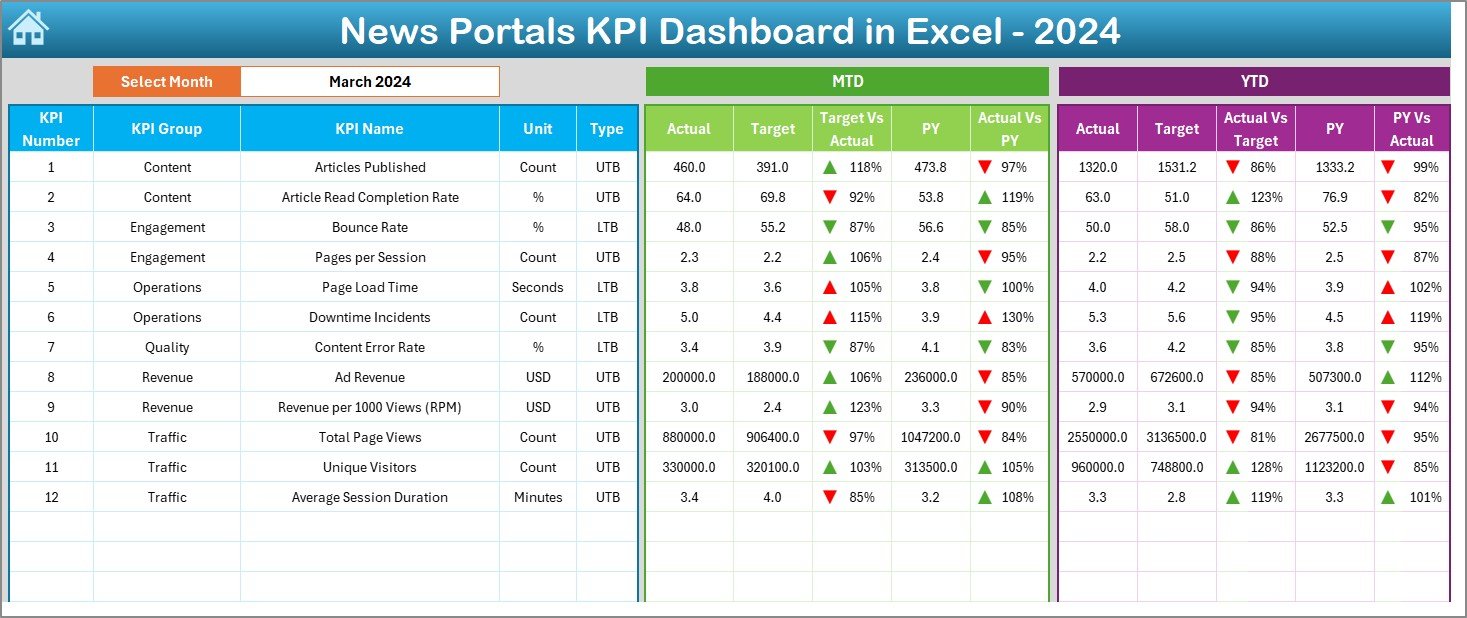
Dashboard Sheet (Main KPI View)
The Dashboard Sheet serves as the heart of the News Portals KPI Dashboard in Excel.
Here, you see all KPIs summarized in one view.
Key Features of the Dashboard Sheet
- Month Selection (Cell D3)
You can select a month from a dropdown. As soon as you change the month, the entire dashboard updates automatically. - MTD Performance Metrics
MTD Actual
MTD Target
MTD Previous Year
Target vs Actual comparison
Previous Year vs Actual comparison
YTD Performance Metrics
YTD Actual
YTD Target
YTD Previous Year
Target vs Actual comparison
Previous Year vs Actual comparison
Conditional Formatting
Up arrows show positive performance
Down arrows highlight underperformance
Because of this design, decision-makers instantly understand whether KPIs perform well or need attention.
Click to buy News Portals KPI Dashboard in Excel
Trend Sheet
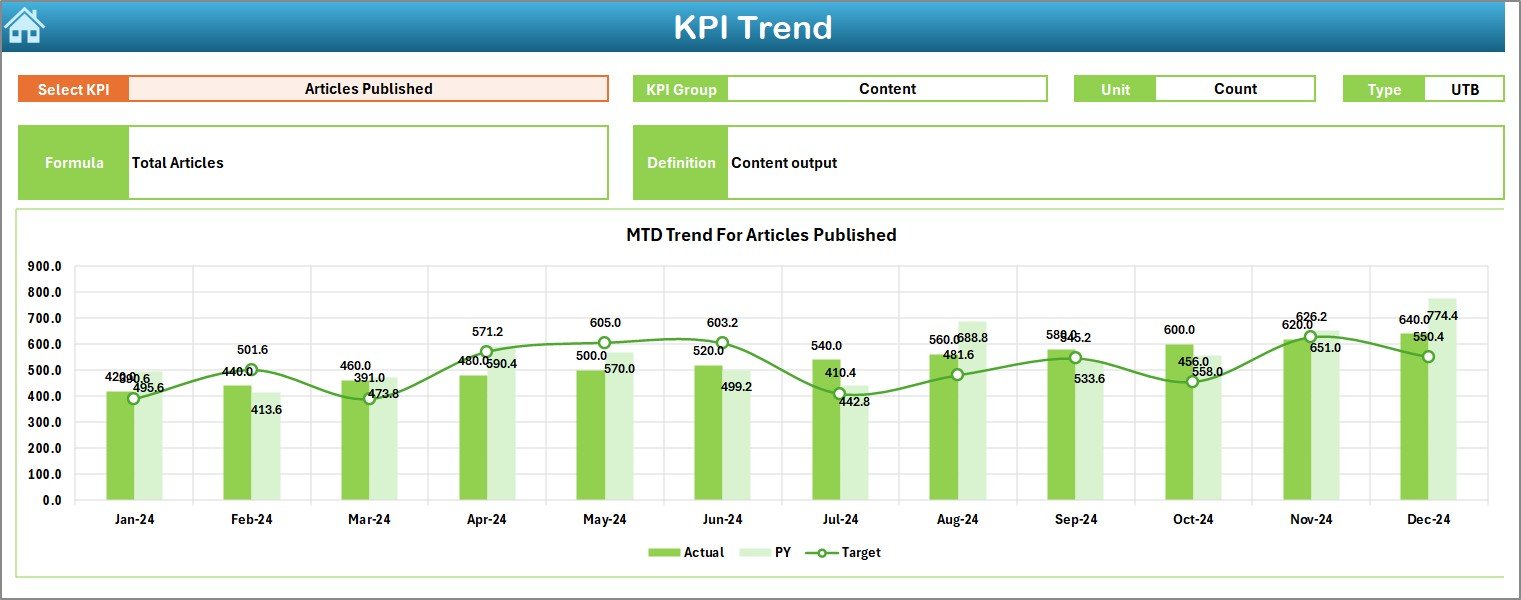
Trend Sheet (KPI Trend Analysis)
The Trend Sheet allows users to analyze individual KPIs in depth.
What Can You Do on the Trend Sheet?
- Select a KPI Name from the dropdown (Cell C3)
- View detailed metadata such as:
KPI Group
KPI Unit
KPI Type (Upper the Better or Lower the Better)
KPI Formula
KPI Definition
Trend Visualization
- MTD trend chart for:
Actual
Target
Previous Year
YTD trend chart for:
Actual
Target
Previous Year
Therefore, users can easily identify patterns, seasonal effects, and growth trends over time.
Click to buy News Portals KPI Dashboard in Excel
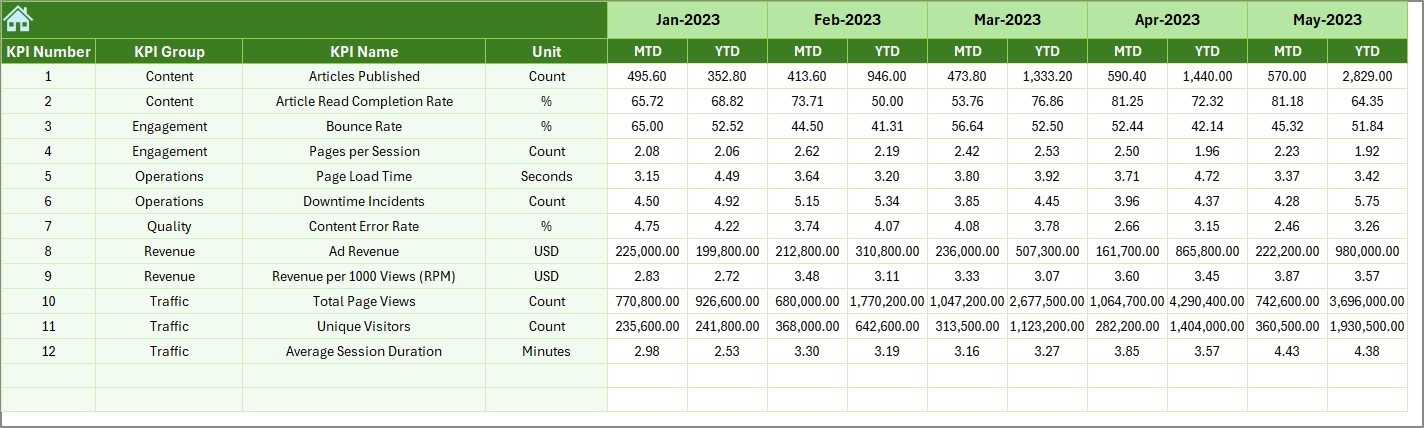
Where Do You Enter Actual KPI Data?
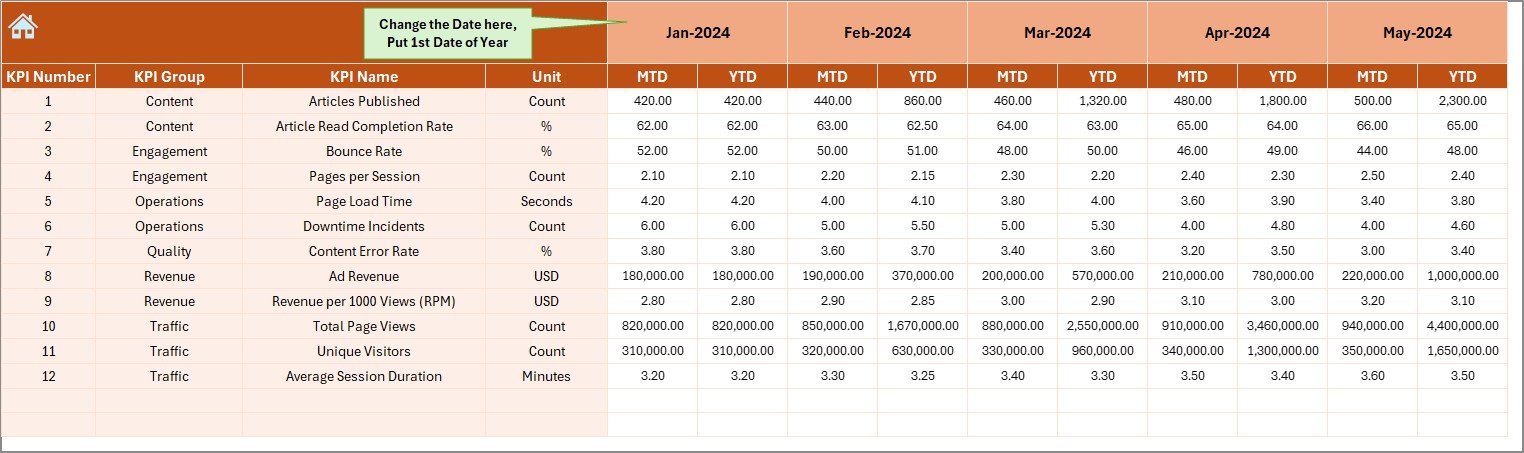
Actual Numbers Input Sheet
This sheet handles data entry for actual performance numbers.
Key Highlights
- Enter MTD and YTD actual values
- Select the starting month of the year in Cell E1
- Change the month dynamically without restructuring data
Because of this setup, users can maintain consistency across months while minimizing errors.
Click to buy News Portals KPI Dashboard in Excel
How Do You Manage KPI Targets?
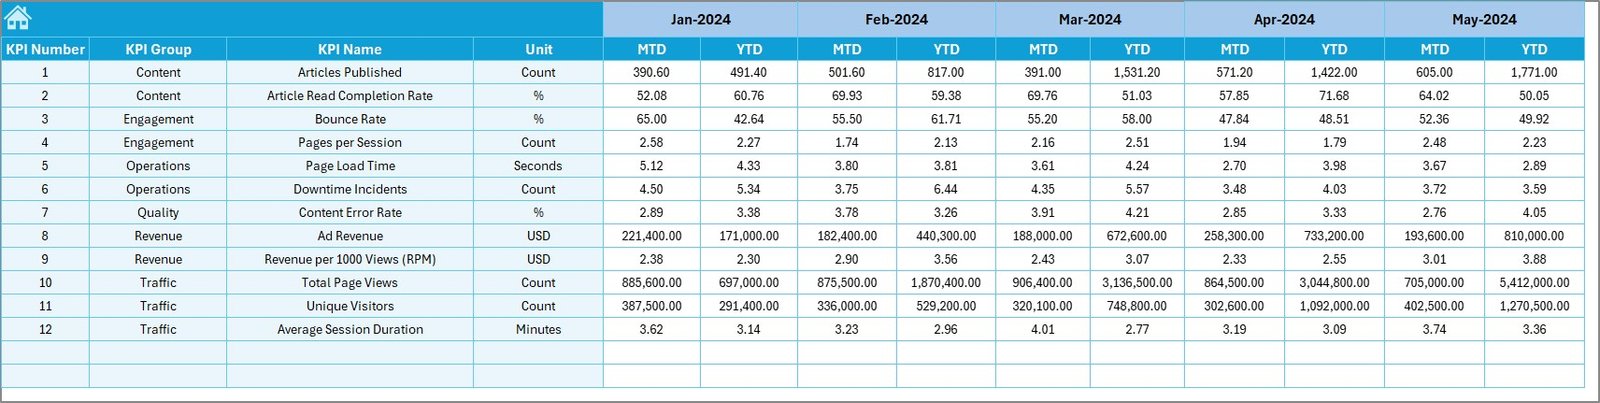
Target Sheet
The Target Sheet stores KPI targets for each month.
Here, users:
- Enter MTD target values
- Enter YTD target values
- Maintain clear performance benchmarks
As a result, teams can compare actual performance against planned goals easily.
Click to buy News Portals KPI Dashboard in Excel
Previous Year
Previous Year Number Sheet
Historical comparison plays a critical role in performance evaluation.
In this sheet:
- Users enter previous year MTD and YTD numbers
- The dashboard automatically compares current performance against last year
Therefore, growth trends and declines become visible immediately.
Click to buy News Portals KPI Dashboard in Excel
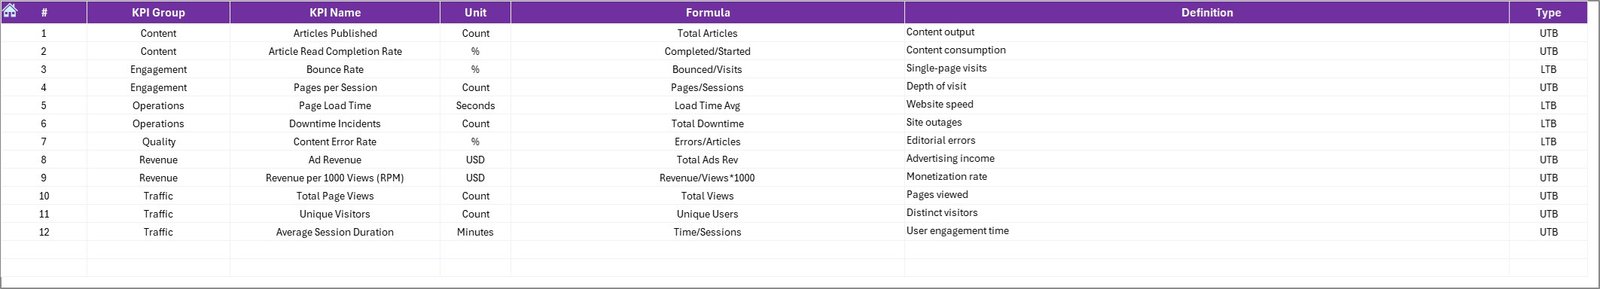
What Is the Role of the KPI Definition Sheet?
KPI Definition Sheet
This sheet ensures data clarity and consistency.
It includes:
- KPI Name
- KPI Group
- Unit of Measurement
- KPI Formula
- KPI Definition
Because everyone refers to the same definitions, confusion reduces significantly across teams.
Click to buy News Portals KPI Dashboard in Excel
What KPIs Can You Track Using a News Portals KPI Dashboard?
A News Portals KPI Dashboard in Excel can track multiple KPI categories, such as:
Traffic KPIs
- Page Views
- Unique Visitors
- Sessions
- Bounce Rate
Engagement KPIs
- Average Time on Page
- Pages per Session
- Scroll Depth
- Return Visitors
Content Performance KPIs
- Articles Published
- Top Performing Articles
- Content Engagement Rate
Revenue KPIs
- Ad Revenue
- Subscription Revenue
- Revenue per Visitor
- CPM
Operational KPIs
- Publishing Frequency
- Editorial Productivity
- Content Turnaround Time
Advantages of a News Portals KPI Dashboard in Excel
Why Should You Use This Dashboard?
Using a News Portals KPI Dashboard in Excel offers multiple advantages.
Key Advantages
- Centralized Reporting
All KPIs stay in one structured workbook. - Time Savings
Automated calculations reduce manual work. - Clear Performance Visibility
Visual indicators highlight trends instantly. - Target Tracking
Compare actual results against defined goals. - Historical Comparison
Analyze growth using previous year data. - Decision Support
Enable data-driven editorial and business decisions.
Because of these benefits, media organizations improve efficiency and accountability.
Best Practices for the News Portals KPI Dashboard in Excel
To get the maximum value, follow these best practices.
- Define KPIs Clearly
Always document KPI formulas and definitions in the KPI Definition Sheet.
- Update Data Regularly
Ensure teams update actual, target, and previous year data on a fixed schedule.
- Use Consistent Units
Maintain consistent units across months to avoid reporting errors.
- Review Trends Monthly
Analyze the Trend Sheet every month to identify patterns early.
- Limit KPIs to What Matters
Track only actionable KPIs instead of overwhelming users.
- Protect Input Sheets
Lock formula cells to prevent accidental changes.
How Does This Dashboard Support Decision-Making?
This dashboard supports decision-making by:
- Highlighting underperforming KPIs early
- Showing which content drives engagement
- Identifying revenue growth opportunities
- Tracking editorial efficiency
- Aligning teams with performance goals
As a result, leadership makes faster and more confident decisions.
Who Can Use a News Portals KPI Dashboard in Excel?
This dashboard works well for:
- Digital news portals
- Online magazines
- Media publishing companies
- Editorial teams
- Marketing and analytics teams
- Business and revenue managers
Because Excel remains widely accessible, adoption remains easy.
Conclusion: Why a News Portals KPI Dashboard in Excel Is Essential
A News Portals KPI Dashboard in Excel transforms scattered data into meaningful insights. Instead of guessing performance, teams rely on structured metrics. Moreover, the dashboard improves transparency, accountability, and efficiency across departments.
By using well-designed worksheets, dynamic dropdowns, trend charts, and conditional formatting, this dashboard becomes a powerful decision-support tool. Therefore, any news organization aiming for growth and clarity should adopt a KPI dashboard approach.
Frequently Asked Questions (FAQs)
What is the main purpose of a News Portals KPI Dashboard in Excel?
The main purpose is to track, analyze, and visualize news portal performance metrics in a single interactive Excel file.
Can non-technical users use this dashboard?
Yes, the dashboard uses dropdowns, buttons, and simple inputs, making it user-friendly for non-technical users.
How often should I update the dashboard?
You should update actual and target data monthly for accurate MTD and YTD analysis.
Can I customize KPIs in the dashboard?
Yes, you can add, remove, or modify KPIs easily using the KPI Definition Sheet.
Does this dashboard support historical comparison?
Yes, it includes a Previous Year sheet for year-over-year performance comparison.
Why use Excel instead of BI tools?
Excel offers flexibility, low cost, and ease of customization without requiring advanced technical infrastructure.
Click to buy News Portals KPI Dashboard in Excel
Visit our YouTube channel to learn step-by-step video tutorials
Watch the step-by-step video tutorial: