Relocating an office is one of the most challenging projects for any organization. From managing budgets and coordinating departments to ensuring that deadlines are met, the process involves countless moving parts. A minor delay in one area can create a chain reaction that impacts the entire relocation.
To simplify this complex process, businesses can use the Office Relocation Dashboard in Power BI. This ready-to-use dashboard provides a centralized platform for monitoring tasks, analyzing progress, and ensuring that the move happens on time and within budget.
In this article, we will explore everything about the Office Relocation Dashboard in Power BI—its structure, features, advantages, best practices, and real-world applications.
Click to Purchases Office Relocation Dashboard in Power BI
What Is an Office Relocation Dashboard in Power BI?
An Office Relocation Dashboard is a data-driven solution built in Power BI that helps organizations manage the end-to-end relocation process. It connects to Excel-based data sources and converts raw numbers into meaningful visual insights.
With interactive visuals, slicers, and drill-down capabilities, the dashboard enables managers to track:
-
Task completion percentages
-
Budget variance
-
Delayed tasks
-
Department-level performance
-
Location-level progress
-
Monthly trends
Instead of juggling spreadsheets, emails, and scattered reports, the dashboard consolidates all information into a single, interactive file.
Key Features of the Office Relocation Dashboard in Power BI
This dashboard includes five pages in the Power BI Desktop application, each designed for a specific purpose. Let’s explore them one by one:
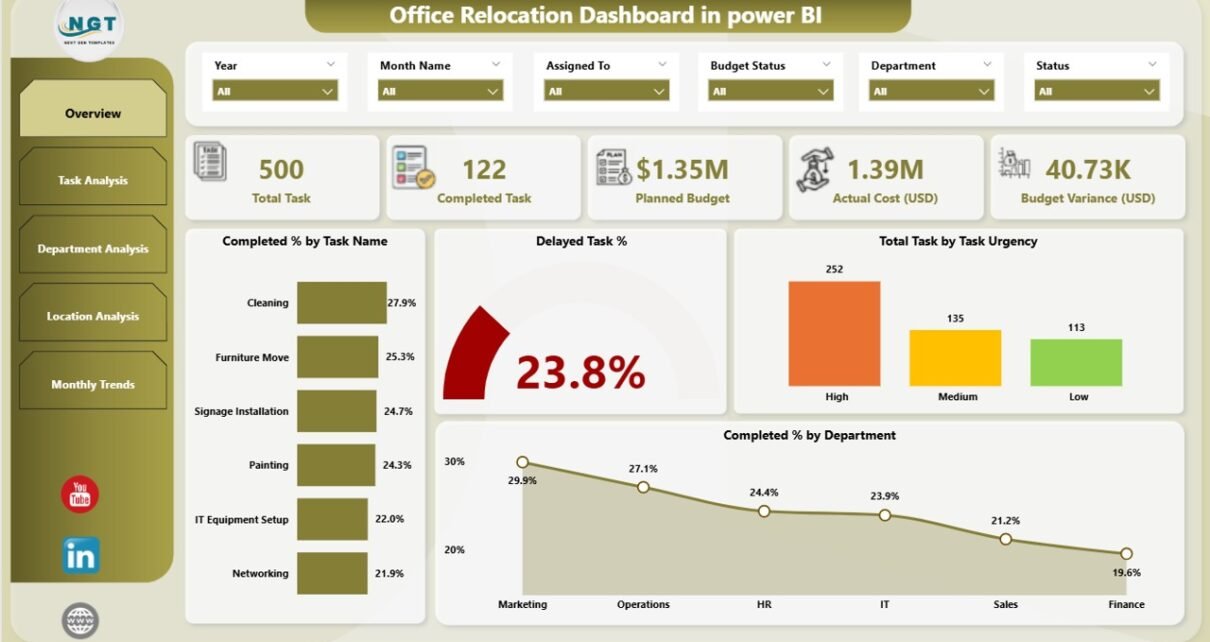
Overview Page
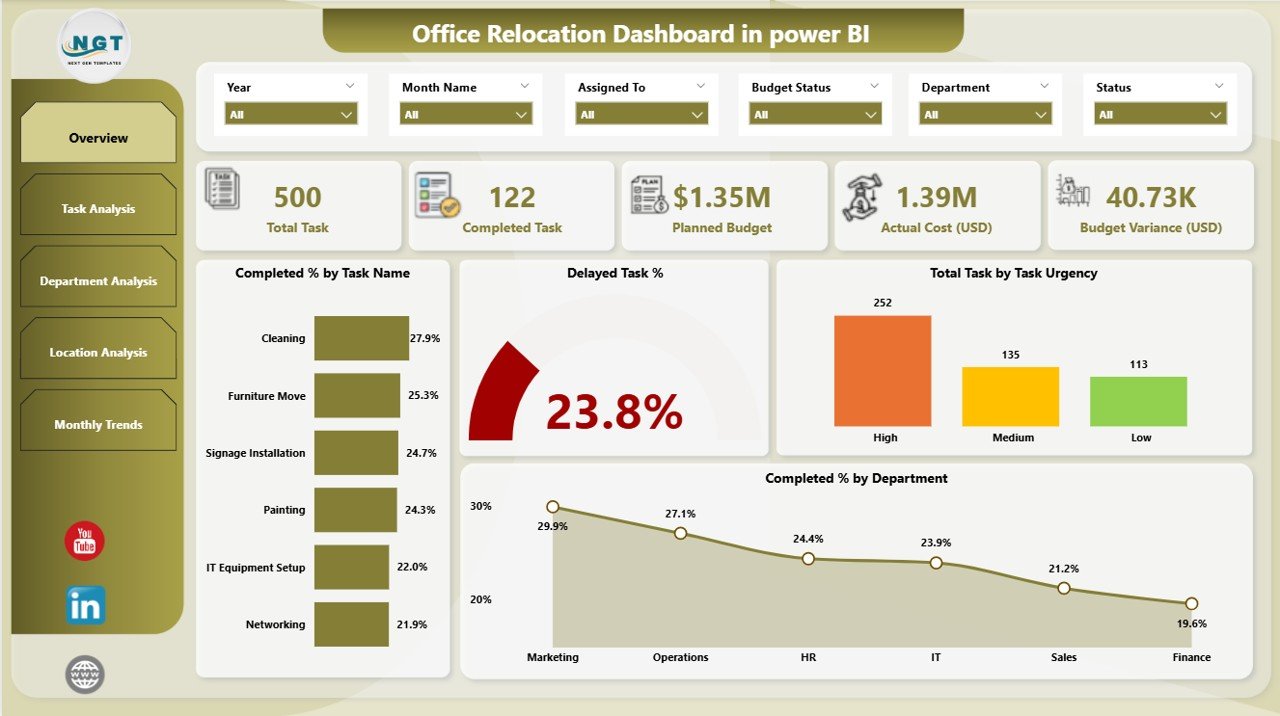
The Overview Page acts as the central hub of the dashboard.
-
Slicers: Allow users to filter data by department, task name, location, or urgency.
-
Cards: Provide quick insights such as Total Tasks, Completed Tasks %, Delayed Tasks %, Remaining Budget, and Overall Progress.
Charts:
- Completed % by Task Name
- Delayed Task %
- Total Tasks by Urgency
- Completed % by Department
- This page gives a bird’s-eye view of the entire relocation project and helps decision-makers quickly identify areas of concern.
Click to Purchases Office Relocation Dashboard in Power BI
Task Analysis Page
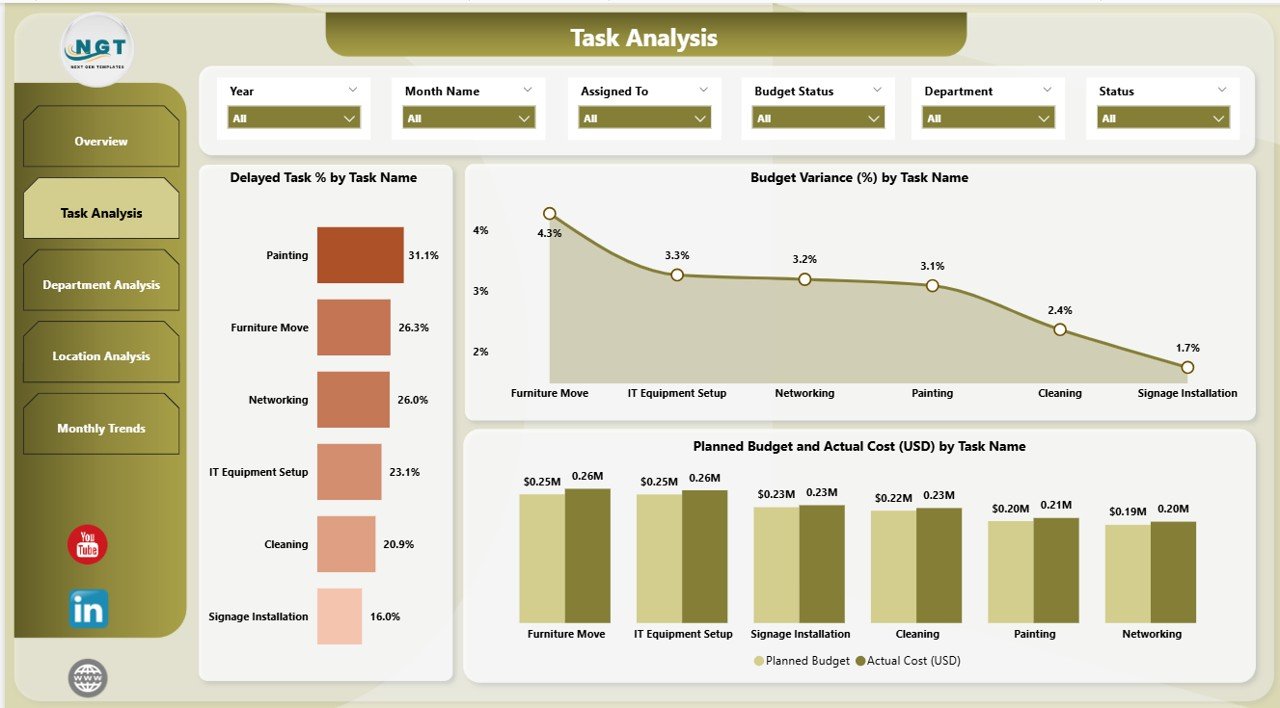
- The Task Analysis Page dives deeper into specific tasks.
-
Slicers for easy filtering by date or task type.
Charts:
- Delayed Task % by Task Name
- Budget Variance (%) by Task Name
- Planned Budget vs Actual Cost (USD) by Task Name
- This page answers questions such as:
-
Which tasks are causing delays?
-
Are we overspending on certain activities?
-
How closely do actual costs match the planned budget?
- It provides actionable insights to keep the project on track.
Department Analysis Page
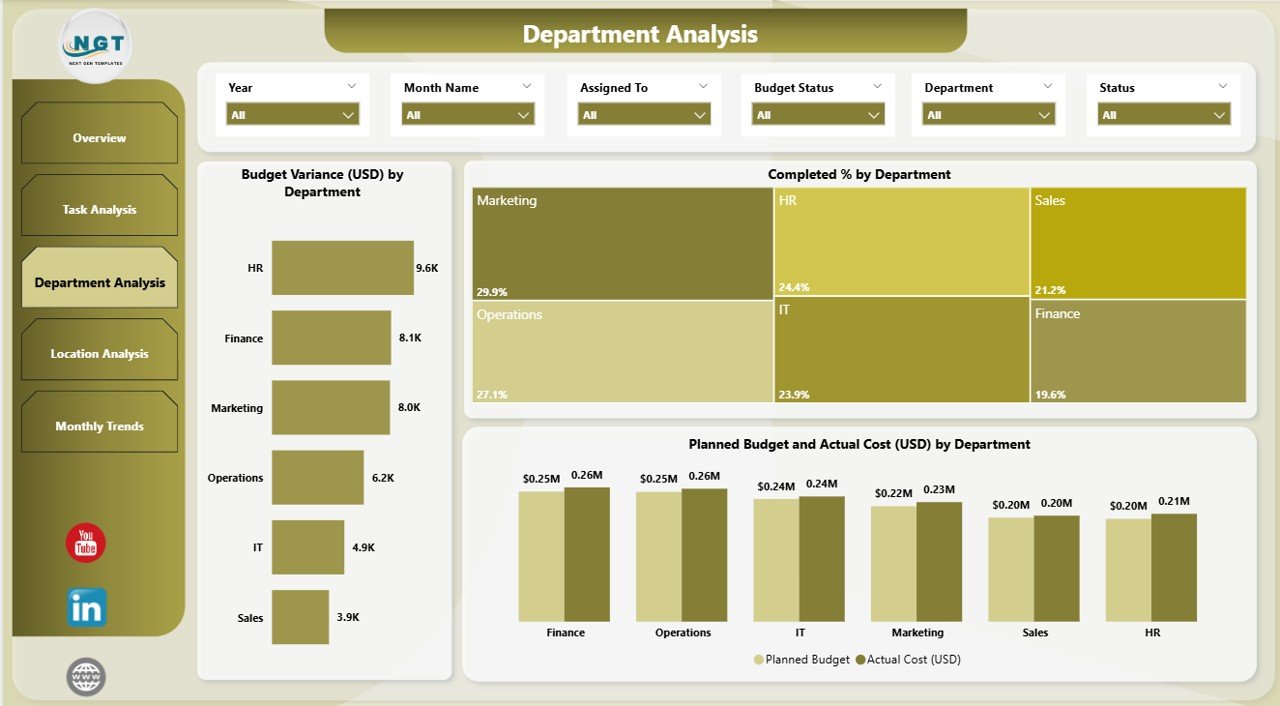
- Departments often handle different responsibilities during relocation. The Department Analysis Page ensures accountability and transparency.
Charts:
- Total Budget Variance (USD) by Department
- Completed % by Department
- Planned Budget vs Actual Cost (USD) by Department
- This page helps managers identify:
-
Which departments are meeting deadlines.
-
Where the budget is being exceeded.
-
How resources are being allocated.
Location Analysis Page
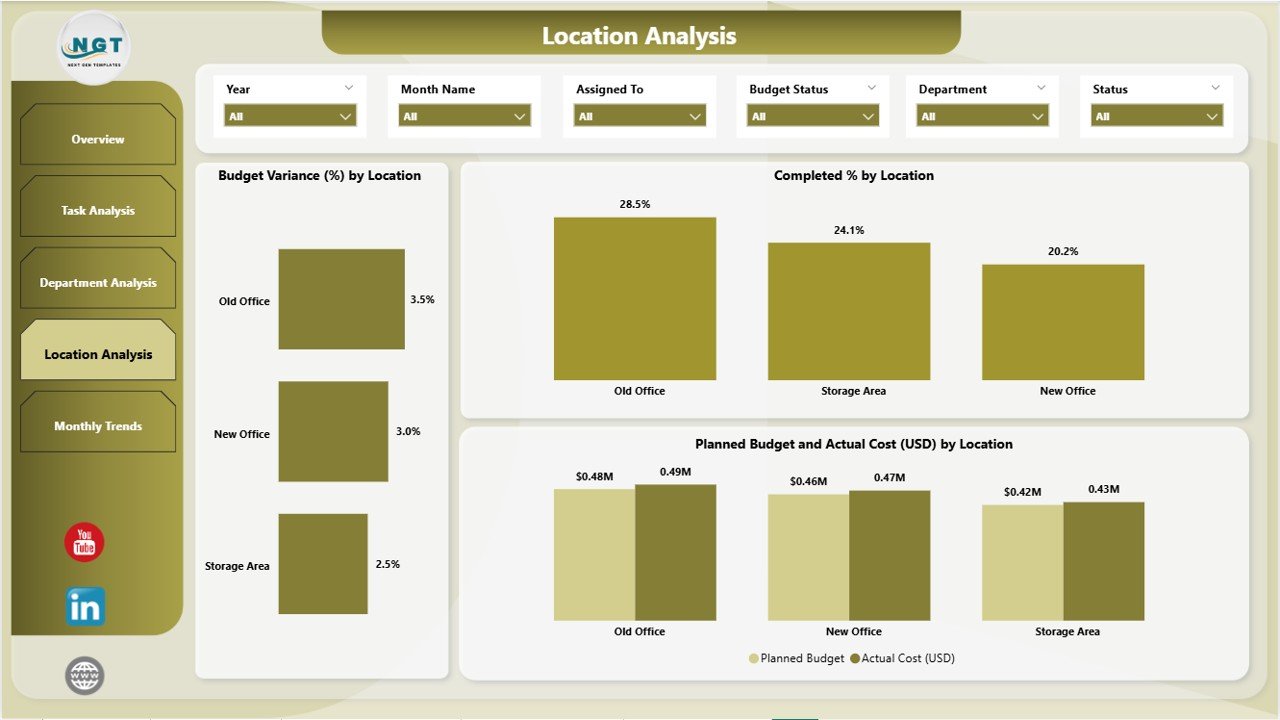
- When relocating to multiple sites or managing moves across regions, the Location Analysis Page becomes essential.
Charts:
- Budget Variance (USD) by Location
- Completed % by Location
- Planned Budget vs Actual Cost (USD) by Location
- This page allows organizations to compare progress across different sites and make location-specific improvements.
Monthly Trends Page
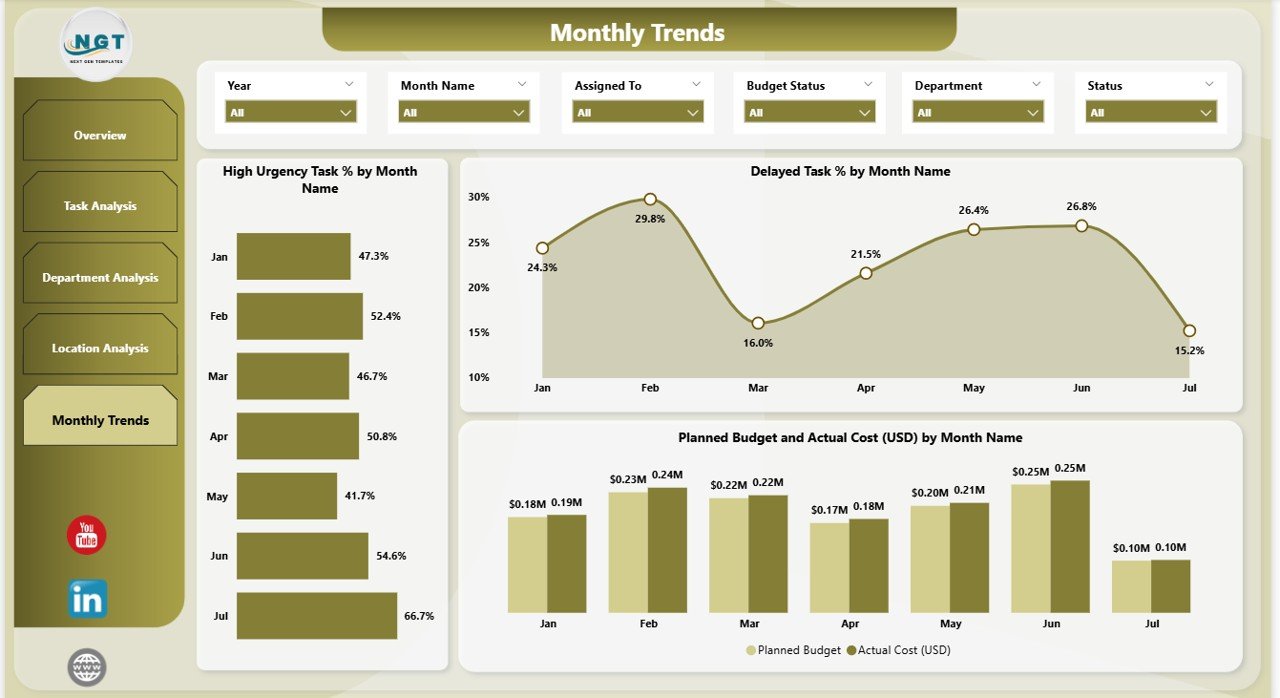
- The Monthly Trends Page focuses on time-based progress.
Charts:
- High Urgency Task % by Month
- Delayed Task % by Month
- Planned Budget vs Actual Cost (USD) by Month
- This helps organizations:
-
Spot patterns in delays.
-
Track urgent tasks over time.
-
Monitor budget performance monthly.
Click to Purchases Office Relocation Dashboard in Power BI
Why Do Businesses Need an Office Relocation Dashboard?
- Relocating an office involves tasks such as infrastructure setup, IT migration, furniture installation, employee coordination, and compliance checks. Tracking all of this manually is overwhelming.
- With this dashboard, businesses can:
-
Save time by centralizing data.
-
Reduce delays by tracking dependencies.
-
Manage budgets with real-time insights.
-
Improve accountability across teams.
-
Make smarter decisions using visual analysis.
✅ Advantages of Office Relocation Dashboard in Power BI
- Here are the key benefits of using this dashboard:
-
📌 Centralized View – Access all project data in one place.
-
📌 Real-Time Monitoring – Track updates as soon as data changes.
-
📌 Budget Control – Compare planned vs actual expenses instantly.
-
📌 Improved Accountability – Departments and teams can be measured on progress.
-
📌 Enhanced Decision-Making – Managers can identify risks early.
-
📌 Customizable – Adjust slicers and visuals to suit organizational needs.
Best Practices for Using the Office Relocation Dashboard
- To maximize value from the dashboard, follow these practices:
-
Maintain Clean Data
-
Keep the Excel source file updated regularly.
-
Ensure consistency in task names and departments.
-
-
Use Slicers Effectively
-
Apply filters to drill down into problem areas quickly.
-
Compare data across time, department, or location.
-
-
Review Trends Monthly
-
Use the Monthly Trends page to forecast potential risks.
-
Plan corrective measures early.
-
-
Align Budget and Progress
-
Regularly check the Budget Variance visuals.
-
Reallocate funds when needed to avoid overruns.
-
-
Engage Stakeholders
-
Share the dashboard with department heads.
-
Use insights for collaborative decision-making.
-
Real-World Applications
- Companies of all sizes can benefit from this dashboard:
-
Small Businesses – Relocating to new offices can track expenses tightly.
-
Large Enterprises – Multiple departments and locations can coordinate more easily.
-
IT Firms – Track equipment migration and setup.
-
Construction & Real Estate – Monitor project phases during office setup.
-
Consultancies – Provide relocation management as a service using the dashboard.
Conclusion
- An office relocation project can either run smoothly or spiral into chaos depending on how well it is managed. The Office Relocation Dashboard in Power BI ensures structure, clarity, and control throughout the process.
- By offering interactive visuals, real-time tracking, and department-level insights, it helps organizations move with confidence. Whether the move is across the city or to multiple global offices, this dashboard empowers decision-makers to keep everything on schedule and within budget.
Frequently Asked Questions (FAQs)
1. What is an Office Relocation Dashboard in Power BI?
It is a ready-to-use dashboard that helps businesses track tasks, budgets, and progress during office relocation projects.
2. Can I customize the dashboard for my organization?
Yes. Power BI allows you to modify visuals, slicers, and data connections to fit your specific needs.
3. Do I need advanced Power BI skills to use it?
Not at all. Once the dashboard is set up, users can interact with slicers and visuals easily without technical expertise.
4. How does this dashboard save time?
It consolidates multiple reports into one file, reducing the need for manual tracking and improving decision-making speed.
5. Can this dashboard track budgets for multiple locations?
Yes. The Location Analysis page provides budget variance and completion insights for each location separately.
6. Is this dashboard useful for small businesses?
Absolutely. Even small firms relocating to a new office can benefit by avoiding cost overruns and delays.
7. How often should I update the data?
- Ideally, update the Excel source file weekly or bi-weekly to keep visuals accurate and relevant.
Click to Purchases Office Relocation Dashboard in Power BI
Visit our YouTube channel to learn step-by-step video tutorials