Efficient office space management is one of the biggest challenges organizations face today. With rising rental costs and hybrid work models becoming the norm, companies need to ensure that every square foot of office space is used effectively. This is where an Office Space Utilization Report in Excel becomes a game-changer.
An Excel-based office space utilization report provides a ready-to-use, data-driven template that helps businesses analyze how well their office spaces are being used. From tracking occupancy to understanding booking trends, this report equips facility managers, HR teams, and decision-makers with actionable insights.
In this article, we will explore everything you need to know about creating and using an Office Space Utilization Report in Excel. We will cover its key features, structure, benefits, best practices, and practical use cases to help you get the most out of this tool.
Click to Purchases Office Space Utilization Report in Excel
What Is an Office Space Utilization Report in Excel?
An Office Space Utilization Report in Excel is a structured template that consolidates office occupancy and booking data into visual dashboards, charts, and tables. It enables organizations to:
-
Track usage of meeting rooms, workstations, and collaborative spaces.
-
Monitor space efficiency across departments and locations.
-
Identify underutilized or overbooked spaces.
-
Improve resource allocation and workplace planning.
Unlike manual reports or expensive software, Excel-based solutions are cost-effective, customizable, and user-friendly. With built-in charts, slicers, and formulas, even non-technical users can easily analyze space utilization trends.
Key Features of the Office Space Utilization Report
This report template is designed with multiple pages in the Excel desktop application file. Each page focuses on a specific aspect of utilization data.
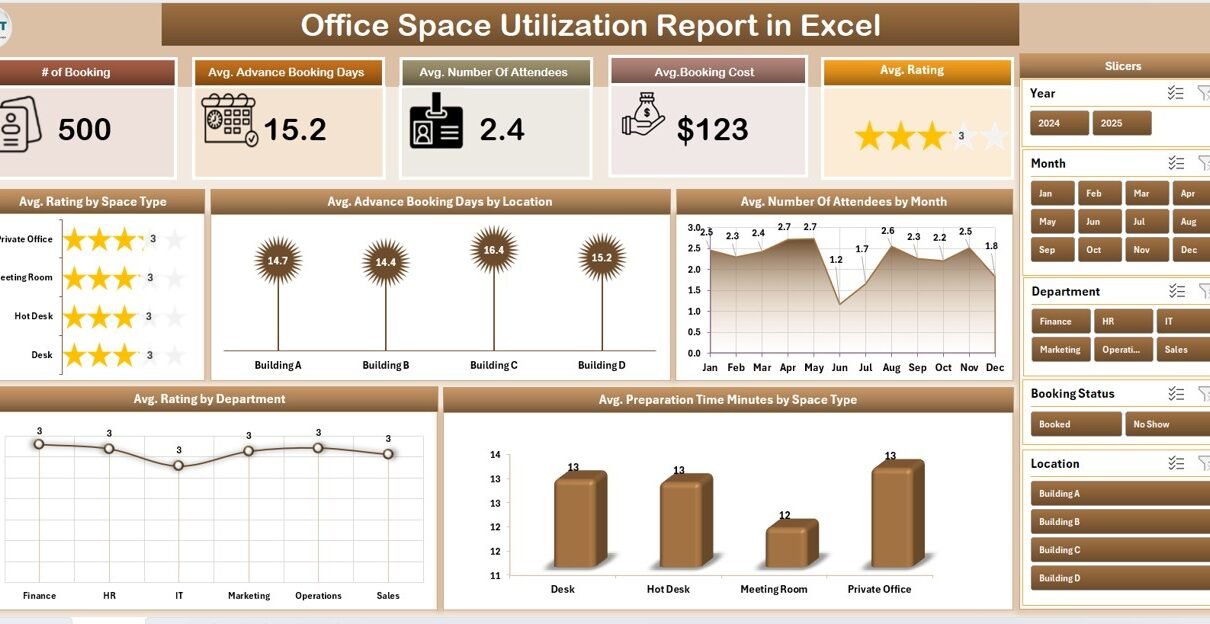
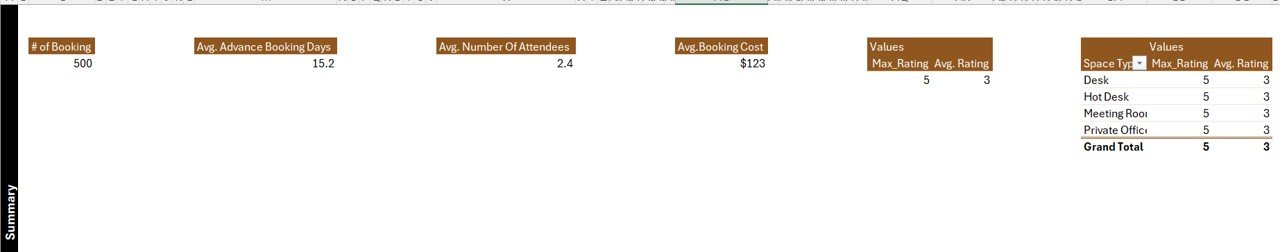
Summary Page
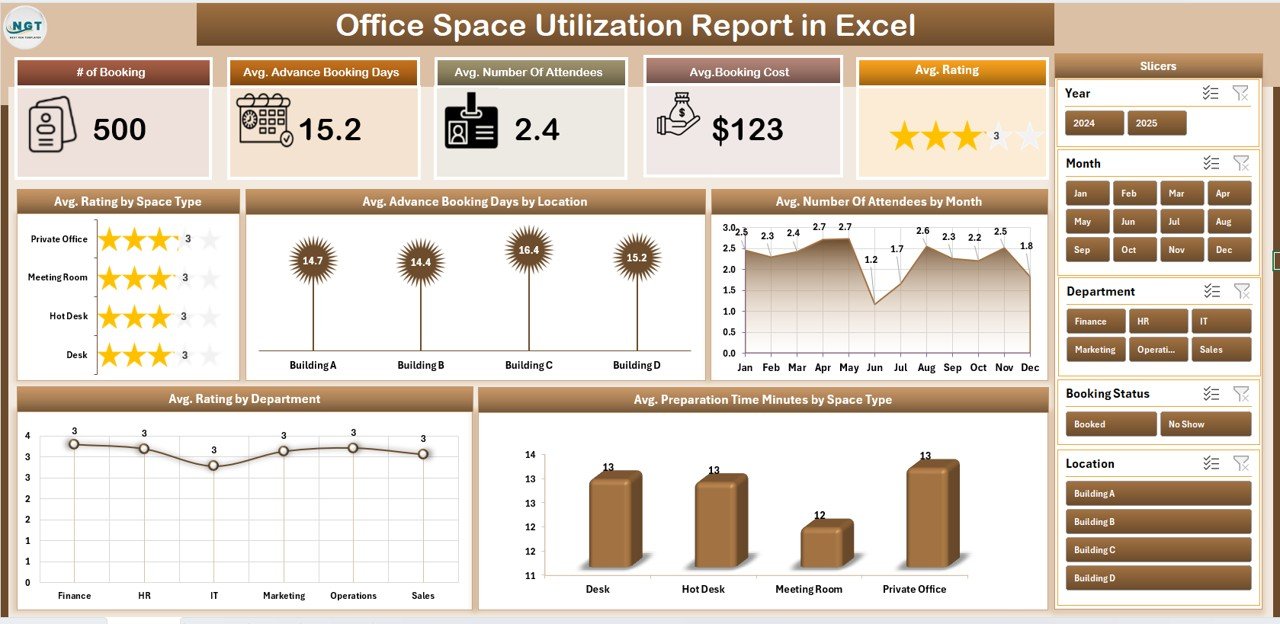
The Summary Page is the main dashboard and provides a quick snapshot of space utilization performance.
-
Top 5 Cards: Display critical KPIs such as total bookings, utilization percentage, and average ratings.
-
Right-Side Slicer: Enables filtering by department, location, or time period for customized analysis.
Charts Included:
- Average Rating by Space Type – Helps measure satisfaction levels of different office spaces.
- Average Advance Booking Days by Location – Shows how early employees book office spaces across branches.
- Average Number of Attendees by Month – Tracks trends in meeting participation over time.
- Average Rating by Department – Highlights department-specific feedback on spaces.
- Average Preparation Time (Minutes) by Space Type – Monitors how much setup time different spaces require.
Report Page
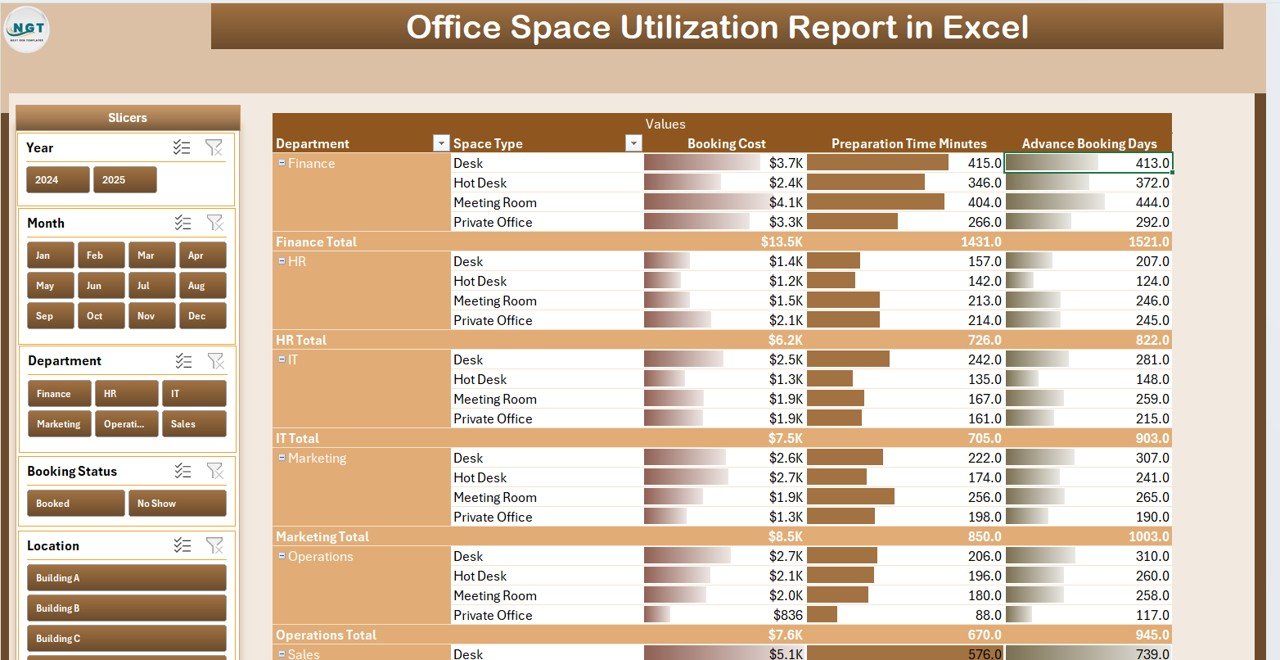
The Report Page is a more detailed view, focusing on tabular data and slicer-based filtering.
-
Left-Side Slicer: Provides flexibility to drill down data by team, location, or space type.
-
Information Table: Displays granular data such as booking dates, duration, attendees, and space usage details.
Data Sheet
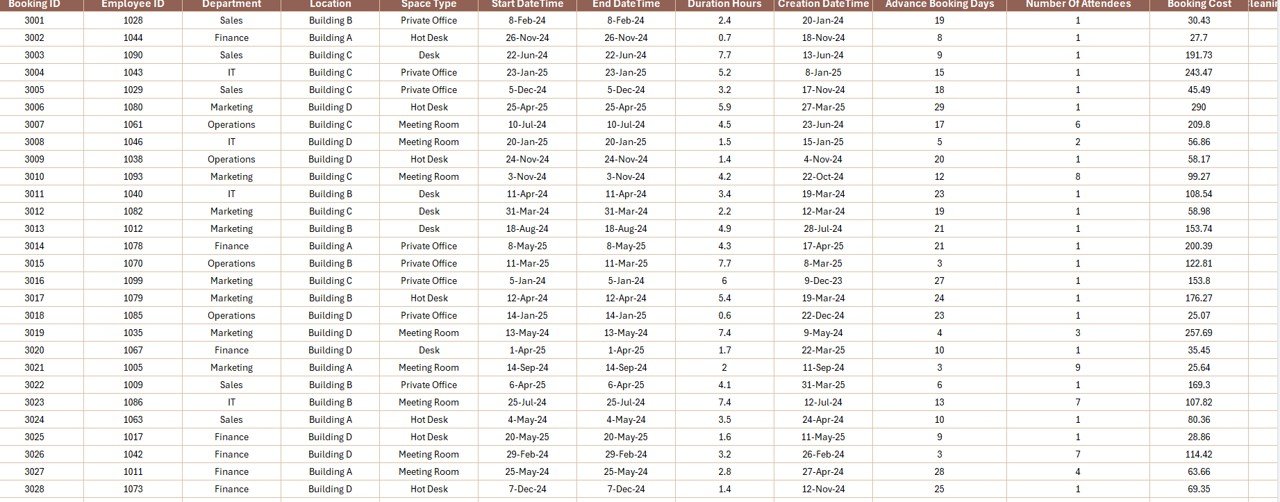
The Data Sheet is the foundation of the report. All raw booking and utilization data is captured here.
-
Includes fields such as booking ID, space type, department, location, attendees, rating, preparation time, and more.
-
Ensures that all charts and reports remain automatically updated when new data is added.
Support Sheet
The Support Sheet contains reference data such as lists of departments, space types, and rating categories.
-
Used to populate drop-down lists in slicers and ensure data consistency.
-
Helps reduce manual entry errors.
Click to Purchases Office Space Utilization Report in Excel
Why Do You Need an Office Space Utilization Report?
Modern offices are dynamic, with employees shifting between remote and on-site work. Without proper tracking, companies risk wasting resources or creating overcrowded workspaces.
An Office Space Utilization Report in Excel helps organizations:
-
Identify unused spaces that can be repurposed.
-
Optimize meeting room allocation by understanding booking behaviors.
-
Reduce costs by eliminating underutilized areas.
-
Enhance employee satisfaction by ensuring easy access to resources.
-
Plan future space needs based on actual usage data.
Advantages of Office Space Utilization Report in Excel
Using this Excel-based report offers several benefits:
✅ Cost-Effective Solution – No need to invest in expensive workplace software.
✅ Customizable – Tailor charts, metrics, and slicers as per business needs.
✅ User-Friendly – Anyone with basic Excel knowledge can navigate and update it.
✅ Data-Driven Decisions – Provides reliable insights for workplace planning.
✅ Centralized Information – All utilization data stored in one file.
✅ Scalability – Works for small businesses as well as large enterprises.
Best Practices for the Office Space Utilization Report
To make the most of this report, organizations should follow some best practices:
📊 Regular Data Updates: Keep the data sheet current to maintain accuracy.
🔍 Use Slicers Effectively: Apply filters to analyze utilization by department, space type, or month.
🏢 Focus on Key Metrics: Track utilization %, ratings, and booking patterns to uncover trends.
🛠️ Automate Where Possible: Use formulas and pivot tables to reduce manual work.
📈 Review Trends Monthly: Identify seasonal peaks and low-usage periods.
👥 Involve Stakeholders: Share the report with HR, admin, and facility managers for collaboration.
Opportunities for Improvement
While Excel is powerful, there are areas where organizations can enhance the utilization reporting process:
🔄 Integration with Booking Systems: Automating data input from online booking tools.
📱 Mobile Accessibility: Making reports available on mobile devices for managers on the move.
🌐 Cloud Sharing: Using Excel Online or OneDrive for real-time collaboration.
📊 Advanced Analytics: Adding predictive models to forecast space demand.
How to Use the Office Space Utilization Report
Using this report is straightforward.
-
Input Data: Enter booking and utilization details into the Data Sheet.
-
Navigate with Slicers: Use slicers on the Summary and Report pages to filter data.
-
Analyze Charts: Review key metrics such as average ratings, booking patterns, and attendee numbers.
-
Identify Trends: Look for underutilized spaces or frequently overbooked areas.
-
Take Action: Reallocate, repurpose, or redesign office spaces based on insights.
Real-World Use Cases
Here are a few practical scenarios where businesses use an Excel-based space utilization report:
-
Corporate Offices: Monitor meeting room usage across multiple branches.
-
Educational Institutions: Track classroom and training room utilization.
-
Healthcare Facilities: Optimize consultation room allocations.
-
Coworking Spaces: Understand peak usage hours and customer satisfaction.
-
Manufacturing Plants: Manage shared spaces like training halls and briefing rooms.
Conclusion
The Office Space Utilization Report in Excel is a simple yet powerful solution for businesses that want to make the most of their office spaces. It helps organizations reduce costs, improve resource allocation, and create better work environments.
With its Summary Page dashboards, detailed Report Page, and raw Data Sheet, this Excel tool is both flexible and actionable. By following best practices and regularly updating data, companies can unlock valuable insights and plan for the future.
Frequently Asked Questions (FAQs)
1. What is an office space utilization report?
It is a structured Excel template that tracks how effectively office spaces like meeting rooms, desks, and collaborative areas are being used.
2. Why should businesses track office space utilization?
Tracking utilization helps reduce wasted resources, lower costs, improve employee satisfaction, and plan future space needs more accurately.
3. What data is included in the Office Space Utilization Report in Excel?
It includes booking details, space types, departments, locations, ratings, attendees, and preparation times.
4. Can this Excel report be customized?
Yes, the template is fully customizable. Businesses can add or remove metrics, create new charts, or integrate it with booking systems.
5. Who should use this report?
Facility managers, HR teams, admin staff, and decision-makers who want to optimize workspace allocation and utilization.
6. How often should the report be updated?
Ideally, update the data sheet weekly or monthly to ensure accurate and timely insights.
7. Can small businesses also use this report?
Absolutely. This Excel template works for both small businesses and large enterprises.
Visit our YouTube channel to learn step-by-step video tutorials