Modern offices generate waste every single day. Employees print documents. Cafeterias produce food waste. Packaging materials pile up. Electronic waste increases each quarter. Therefore, organizations must track, measure, and control waste carefully.
However, many offices still depend on manual logs or scattered Excel sheets. As a result, managers cannot see waste trends clearly. They fail to control disposal costs. They also miss sustainability targets.
So, how can you track recycled waste %, reused waste %, composted waste %, disposal costs, department performance, and vendor efficiency in one interactive system?
Click to buy Office Waste Management Dashboard in Power BI
You need an Office Waste Management Dashboard in Power BI.
In this detailed guide, you will learn:
- What an Office Waste Management Dashboard in Power BI is
- Why modern offices need it
- Detailed explanation of all 5 dashboard pages
- Key KPIs included in the dashboard
- Advantages of Office Waste Management Dashboard in Power BI
- Best Practices for the Office Waste Management Dashboard
- Frequently Asked Questions with Answers
What Is an Office Waste Management Dashboard in Power BI?
An Office Waste Management Dashboard in Power BI is a ready-to-use business intelligence solution that helps organizations track, analyze, and improve waste handling processes.
It collects waste data such as:
- Waste type (paper, plastic, food, e-waste, etc.)
- Quantity in KG
- Disposal method
- Vendor details
- Department information
- Monthly cost in USD
- Recycling and reuse percentages
Then, it converts this raw data into powerful visual insights.
Instead of reviewing multiple reports, managers can:
- Monitor waste cost in real time
- Track disposal vs reuse vs recycle percentages
- Analyze department performance
- Evaluate vendor efficiency
- Identify monthly waste trends
As a result, decision-makers gain full visibility into sustainability and cost performance.
Why Does Every Office Need a Waste Management Dashboard?
Offices focus heavily on revenue and productivity. However, they often ignore waste costs and sustainability performance. That approach creates long-term financial and environmental risks.
Here is why every office needs this dashboard:
- Waste Costs Increase Quietly
Disposal costs add up quickly. Therefore, without tracking, organizations overspend without realizing it.
- Sustainability Goals Require Data
Companies promise eco-friendly operations. However, without data, they cannot measure progress.
- Departments Perform Differently
Some departments recycle more. Others generate higher disposal waste. Therefore, comparison becomes essential.
- Vendor Performance Impacts Results
Some vendors recycle efficiently. Others rely more on landfill disposal. Therefore, vendor analysis helps improve contracts.
- Monthly Monitoring Prevents Surprises
If waste suddenly increases in one month, managers must know immediately. This dashboard makes that possible.
Detailed Explanation of All 5 Dashboard Pages
This Office Waste Management Dashboard in Power BI includes 5 powerful analytical pages. Each page focuses on a specific dimension of waste management.
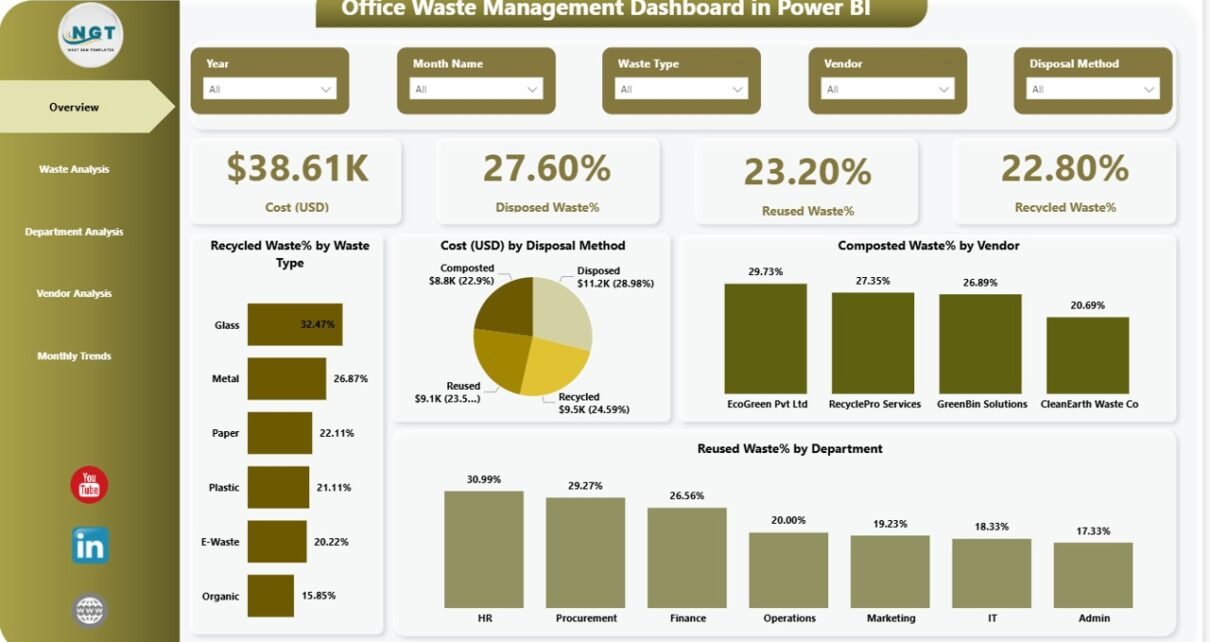
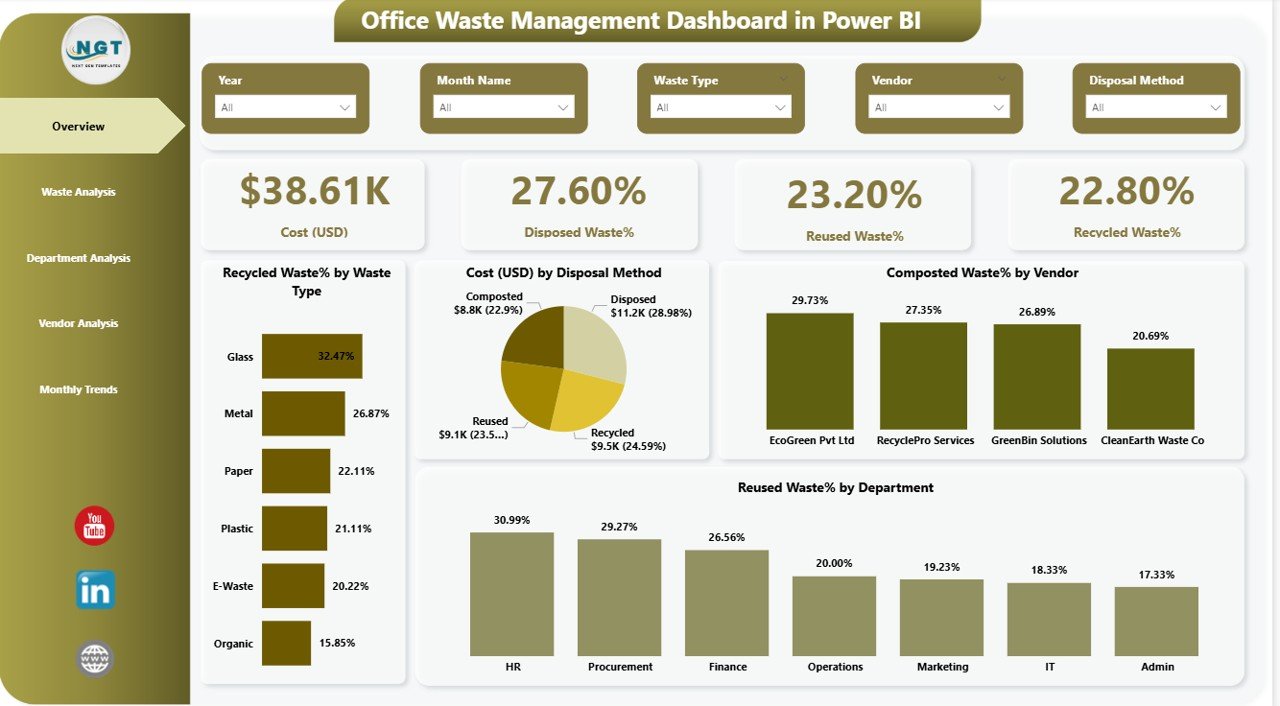
Overview Page – What Is the Big Picture?
The Overview Page acts as the command center of the dashboard.
It provides a snapshot of overall waste performance.
Key KPI Cards:
- Cost (USD)
- Disposed Waste %
- Reused Waste %
- Recycled Waste %
These four cards immediately show financial and sustainability performance.
Additional Visuals:
- Recycled Waste % by Waste Type
- Cost (USD) by Disposal Method
- Composted Waste %
- Reused Waste % by Department
Why Is This Page Important?
Because executives need a quick summary. Therefore, they can instantly see:
- Whether recycling improves
- Whether disposal costs increase
- Whether composting percentage meets targets
- Which departments reuse waste effectively
As a result, leadership can take immediate action.
Click to buy Office Waste Management Dashboard in Power BI
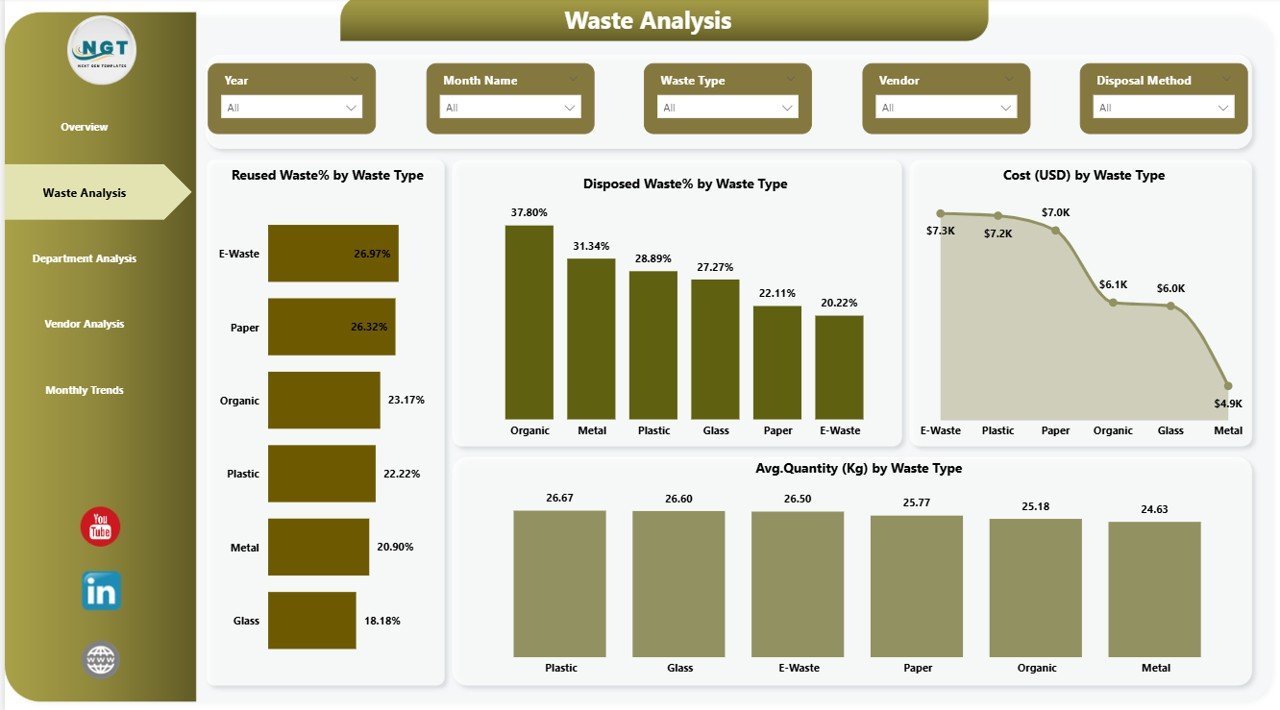
Waste Analysis – Which Waste Type Impacts the Most?
The Waste Analysis page dives deeper into waste categories.
Charts Included:
- Reused Waste % by Waste Type
- Disposed Waste % by Waste Type
- Cost (USD) by Waste Type
- Average Quantity (KG) by Waste Type
What Insights Can You Get?
- Which waste type generates the highest cost?
- Which waste type shows poor recycling performance?
- Which waste type produces the highest quantity?
Click to buy Office Waste Management Dashboard in Power BI
Department Analysis – Which Department Performs Best?
Different departments create different types of waste.
The Department Analysis page compares waste performance across teams.
Charts Included:
- Recycled Waste % by Department
- Disposed Waste % by Department
- Cost (USD) by Department
- Average Quantity (KG) by Department
Why Is This Important?
Because accountability improves performance.
When departments see their metrics:
- They compete positively
- They improve recycling behavior
- They reduce waste generation
Moreover, management can:
- Identify departments with high disposal cost
- Conduct awareness training
- Set departmental waste targets
Therefore, this page encourages responsible waste culture.

Click to buy Office Waste Management Dashboard in Power BI
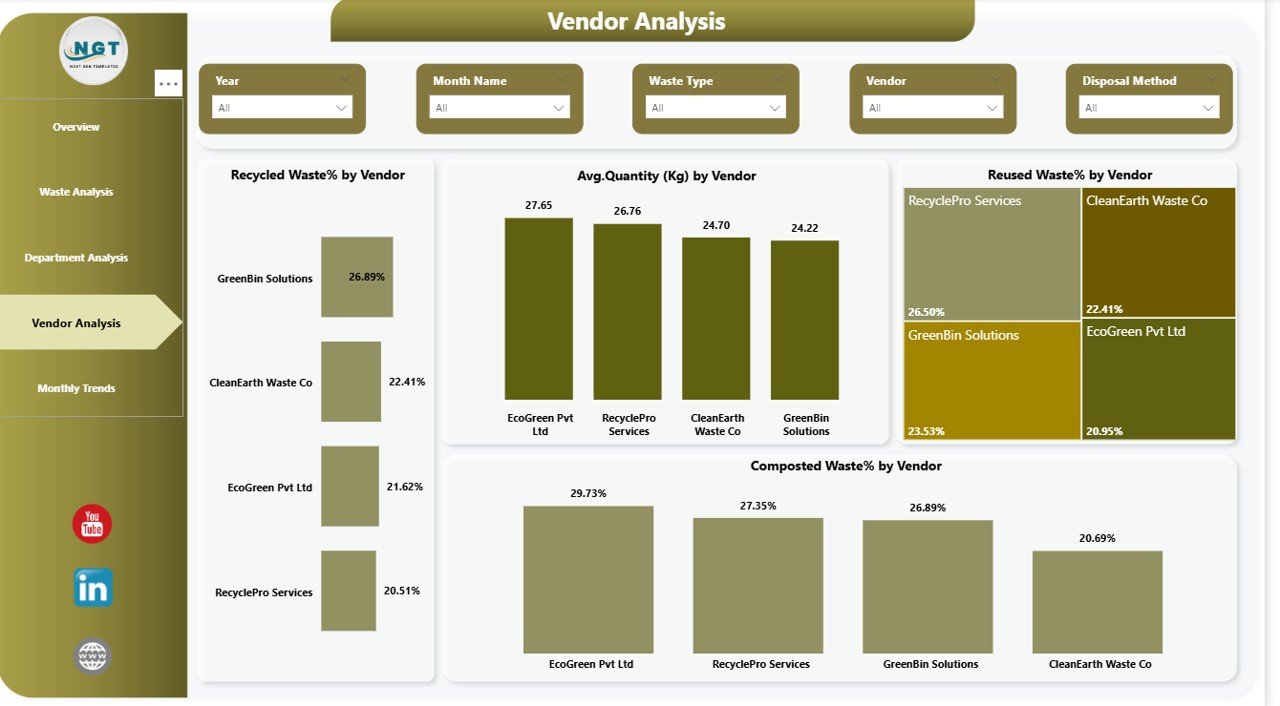
Vendor Analysis – Are Your Vendors Efficient?
Waste vendors play a major role in sustainability success.
The Vendor Analysis page measures vendor performance clearly.
Charts Included:
- Recycled Waste % by Vendor
- Average Quantity (KG) by Vendor
- Reused Waste % by Vendor
- Composted Waste % by Vendor
What Can You Discover?
- Which vendor recycles the highest percentage?
- Which vendor relies heavily on disposal?
- Which vendor handles maximum quantity?
If one vendor shows poor recycling results, management can renegotiate or switch contracts.
Therefore, vendor analysis supports better decision-making.
Click to buy Office Waste Management Dashboard in Power BI
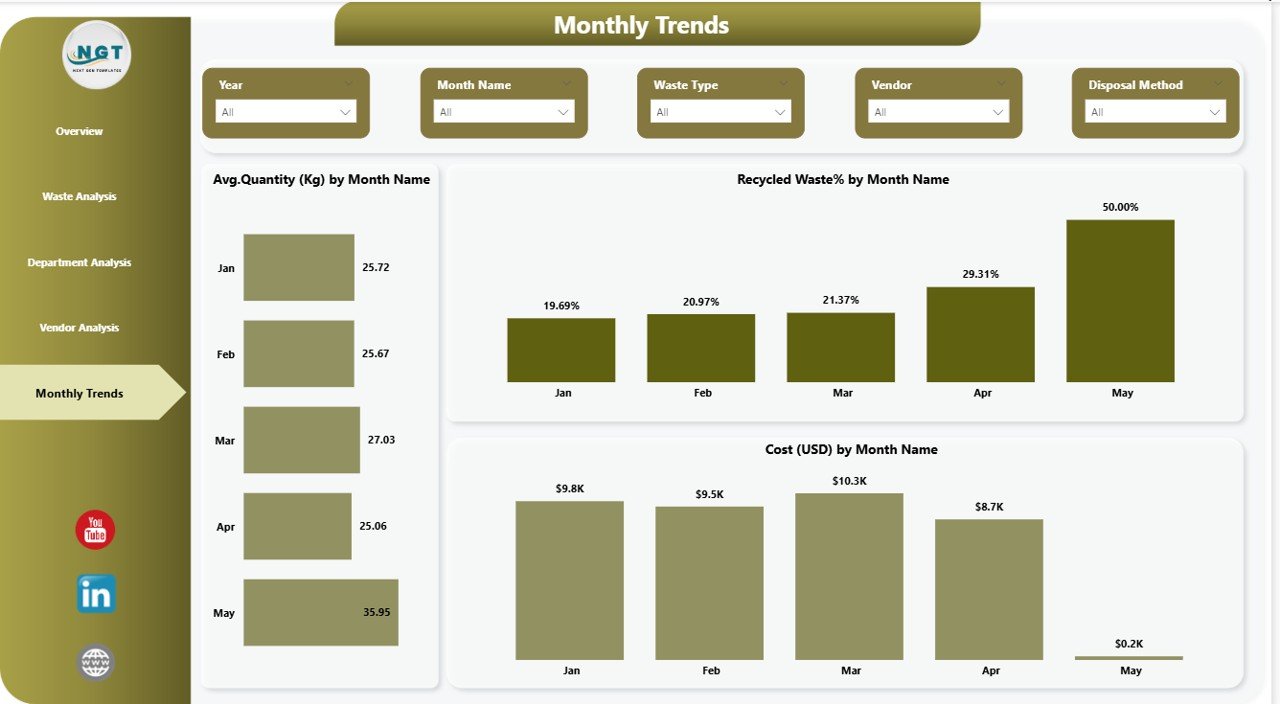
Monthly Trends – How Does Waste Change Over Time?
Waste patterns change month by month.
The Monthly Trends page captures time-based performance.
Charts Included:
- Average Quantity (KG) by Month Name
- Recycled Waste % by Month Name
- Cost (USD) by Month Name
Why Is This Page Powerful?
Because trends reveal hidden patterns.
For example:
- Waste may increase during audit months.
- Food waste may rise during event seasons.
- Disposal cost may spike in year-end cleaning months.
Therefore, managers can plan preventive measures.
Click to buy Office Waste Management Dashboard in Power BI
Key KPIs Included in the Office Waste Management Dashboard
This dashboard focuses on measurable performance indicators.
Financial KPIs
- Total Waste Cost (USD)
- Cost by Disposal Method
- Cost by Waste Type
- Cost by Department
Sustainability KPIs
- Recycled Waste %
- Reused Waste %
- Disposed Waste %
- Composted Waste %
Operational KPIs
- Average Quantity (KG)
- Quantity by Waste Type
- Quantity by Vendor
- Monthly Quantity Trends
Because Power BI updates visuals dynamically, users can filter by:
- Department
- Waste Type
- Vendor
- Month
As a result, analysis becomes interactive and simple.
Advantages of Office Waste Management Dashboard in Power BI
Now let us explore the major benefits.
- Improves Cost Control
Managers can track waste cost daily. Therefore, they can quickly identify cost leakage.
- Supports Sustainability Goals
Organizations can measure recycling % accurately. As a result, they can report ESG metrics confidently.
- Enhances Department Accountability
Department-wise analysis promotes responsibility. Therefore, waste reduction improves naturally.
- Strengthens Vendor Evaluation
Vendor comparison improves negotiation power. Consequently, companies can choose eco-friendly vendors.
- Provides Real-Time Insights
Power BI refreshes data easily. Therefore, leaders always see updated performance.
- Encourages Data-Driven Decisions
Instead of assumptions, managers use numbers. That improves planning accuracy.
- Simplifies Reporting
Instead of manual monthly reports, users can export dashboard visuals instantly.
How Does This Dashboard Improve Corporate Sustainability?
Corporate sustainability depends on measurable action.
This dashboard helps in multiple ways:
- Tracks recycling improvement month by month
- Highlights departments that need awareness training
- Reduces landfill dependency
- Encourages composting programs
- Monitors vendor compliance
Therefore, organizations can align waste management with environmental strategy.
Moreover, companies can use dashboard data in:
- ESG reports
- CSR presentations
- Sustainability audits
- Internal management reviews
Best Practices for the Office Waste Management Dashboard
To maximize results, follow these best practices:
- Ensure Accurate Data Entry
Always record:
- Correct waste type
- Accurate quantity in KG
- Proper disposal method
- Correct vendor details
Without clean data, insights lose accuracy.
- Update Data Monthly
Regular updates maintain dashboard reliability. Therefore, schedule monthly data refresh.
- Define Waste Categories Clearly
Use consistent waste type labels such as:
- Paper
- Plastic
- Metal
- Organic
- E-waste
This improves analysis quality.
- Set Targets for Recycling %
Instead of just tracking numbers, define goals. For example:
- 60% recycling target
- 20% reuse target
- Less than 10% disposal target
Targets drive action.
- Conduct Department Reviews
Review department metrics quarterly. Discuss improvement plans openly.
- Evaluate Vendors Annually
Use vendor performance data during contract renewal discussions.
- Use Filters for Deep Analysis
Encourage managers to use slicers. They can analyze specific months or departments easily.
How Can Organizations Implement This Dashboard Successfully?
Implementation requires structured planning.
Step 1: Collect Historical Waste Data
Gather at least 6–12 months of past waste records.
Step 2: Standardize Data Format
Ensure consistent columns:
- Date
- Waste Type
- Department
- Vendor
- Quantity (KG)
- Cost (USD)
- Disposal Method
Step 3: Import Data into Power BI
Load the data into Power BI Desktop.
Step 4: Create Relationships
Link tables correctly if multiple datasets exist.
Step 5: Design Interactive Visuals
Use cards, bar charts, and line charts for clear representation.
Step 6: Test with Real Users
Let department managers review dashboard accuracy.
Step 7: Schedule Regular Updates
Keep data current to maintain trust.
Conclusion
Office waste management no longer remains just an operational task. Instead, it plays a strategic role in cost control and sustainability performance.
The Office Waste Management Dashboard in Power BI transforms scattered waste records into structured insights.
It helps organizations:
- Reduce waste cost
- Improve recycling percentage
- Monitor department accountability
- Evaluate vendor performance
- Track monthly trends
Therefore, companies gain both financial and environmental benefits.
If your organization wants smarter waste tracking, improved sustainability reporting, and better cost control, then this dashboard provides the perfect solution.
Frequently Asked Questions with Answers
- What data do I need to build this dashboard?
You need:
- Waste Type
- Department
- Vendor
- Quantity in KG
- Cost in USD
- Disposal Method
- Date
With these fields, you can build all visuals.
- Can small offices use this dashboard?
Yes. Even small offices generate waste. Therefore, they can benefit from tracking recycling and disposal cost.
- How often should we update the data?
You should update it monthly. However, large organizations may update weekly.
- Can this dashboard support ESG reporting?
Yes. Because it tracks recycling %, disposal %, and composting %, it supports sustainability reporting.
- Does Power BI allow filtering by department and month?
Yes. Power BI supports interactive slicers. Therefore, users can filter data easily.
- Can we customize KPIs?
Yes. You can add additional KPIs such as:
- Carbon footprint
- Waste reduction rate
- Vendor compliance score
Visit our YouTube channel to learn step-by-step video tutorials
Click to buy Office Waste Management Dashboard in Power BI
Watch the step-by-step video tutorial: