Running an online subscription platform demands more than customer acquisition and billing automation. You must track performance daily, compare targets monthly, and analyze trends yearly. However, many subscription businesses still rely on scattered spreadsheets, manual calculations, and delayed reports. As a result, decision-making slows down, churn risks increase, and growth opportunities remain hidden.
That is exactly where an Online Subscription Platforms KPI Dashboard in Excel becomes a powerful solution.
In this detailed and SEO-friendly guide, you will learn what an Online Subscription Platforms KPI Dashboard in Excel is, how it works, why it matters, and how to use it effectively. Moreover, this article explains every worksheet, highlights advantages, shares best practices, and answers the most common questions at the end.
Click to buy Online Subscription Platforms KPI Dashboard in Excel
What Is an Online Subscription Platforms KPI Dashboard in Excel?
An Online Subscription Platforms KPI Dashboard in Excel is a structured performance monitoring tool designed to track, analyze, and visualize key subscription business metrics in one centralized place.
Instead of reviewing multiple files, emails, and reports, you get a single interactive dashboard that shows:
- Month-to-Date (MTD) performance
- Year-to-Date (YTD) performance
- Target vs Actual comparison
- Previous Year (PY) comparison
- KPI trends and performance signals
Because Excel supports formulas, pivot logic, conditional formatting, and drop-down controls, this dashboard delivers real-time insights without expensive BI tools.
Why Do Online Subscription Platforms Need a KPI Dashboard?
Online subscription businesses operate on recurring revenue, which means small performance changes create big financial impact. Therefore, tracking the right KPIs at the right time becomes critical.
An Excel-based KPI dashboard helps because it:
- Centralizes subscription performance data
- Improves visibility into growth and churn
- Enables faster monthly and yearly reviews
- Supports data-driven decision-making
- Reduces manual reporting effort
As a result, founders, managers, analysts, and finance teams gain clarity, control, and confidence.
What KPIs Are Commonly Tracked in Online Subscription Platforms?
Before understanding the dashboard structure, it is important to understand the KPI types commonly used.
Revenue KPIs
- Monthly Recurring Revenue (MRR)
- Annual Recurring Revenue (ARR)
- Average Revenue Per User (ARPU)
Customer KPIs
- Active Subscribers
- New Subscribers
- Churn Rate
- Retention Rate
Growth & Efficiency KPIs
- Net Revenue Growth
- Upgrade and Downgrade Rate
- Customer Lifetime Value (CLTV)
Operational KPIs
- Failed Payments
- Subscription Renewals
- Trial-to-Paid Conversion
This dashboard structure supports all these KPI categories in a flexible and scalable format.
How Is the Online Subscription Platforms KPI Dashboard Structured in Excel?
This KPI dashboard is designed with seven well-organized worksheets, each serving a specific business purpose. Let us explore each one in detail.
Summary Page
The Summary Page acts as the navigation hub of the entire dashboard.
Key Features of the Summary Page
- Acts as an index sheet
- Contains six interactive navigation buttons
- Allows instant movement between sheets
- Improves usability and speed
Because users can jump directly to any section, this page improves workflow efficiency and reduces confusion.

Click to buy Online Subscription Platforms KPI Dashboard in Excel
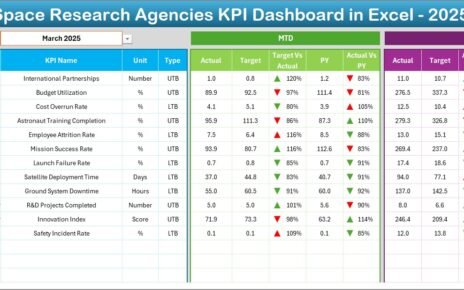
Dashboard Sheet
The Dashboard Sheet Tab serves as the main analytical page of the KPI dashboard.
Key Functional Highlights
- Month selection available in cell D3
- Automatic refresh of all KPIs when the month changes
- Displays both MTD and YTD performance
KPI Comparisons Shown on the Dashboard
- MTD Actual vs Target
- MTD Actual vs Previous Year
- YTD Actual vs Target
- YTD Actual vs Previous Year
Visual Enhancements
- Conditional formatting arrows
- Up arrows for improvement
- Down arrows for decline
As a result, users can instantly identify strong KPIs and underperforming metrics.

Click to buy Online Subscription Platforms KPI Dashboard in Excel
Trend Sheet
The Trend Sheet Tab focuses on deep KPI analysis over time.
How Does the Trend Sheet Work?
- Select KPI Name from drop-down in cell C3
Automatically displays KPI details:
KPI Group
Unit
KPI Type (Upper the Better or Lower the Better)
Formula
Definition
Trend Analysis Visuals
- MTD trend chart for Actual, Target, and PY
- YTD trend chart for Actual, Target, and PY
Because trends reveal patterns, this sheet supports forecasting, planning, and strategy alignment.

Click to buy Online Subscription Platforms KPI Dashboard in Excel
Actual Numbers Input Sheet
The Actual Numbers Input Sheet captures current-year performance data.
Key Data Entry Rules
- Enter MTD and YTD actual values
- Change month selection in cell E1
- Input the first month of the year in E1
- Maintain consistency across months
This structured input method ensures data accuracy and dashboard stability.

Click to buy Online Subscription Platforms KPI Dashboard in Excel
the Target Sheet
The Target Sheet Tab defines business goals for each KPI.
What Do You Enter Here?
- Monthly MTD targets
- Monthly YTD targets
- KPI-wise performance goals
Because targets drive accountability, this sheet helps teams measure success objectively.

Click to buy Online Subscription Platforms KPI Dashboard in Excel
Previous Year Number Sheet Tab
The Previous Year Number Sheet Tab stores historical KPI data.
Benefits of This Sheet
- Enables year-over-year comparison
- Highlights growth or decline patterns
- Supports strategic review meetings
When businesses compare current performance with the previous year, they gain valuable context.

Click to buy Online Subscription Platforms KPI Dashboard in Excel
KPI Definition Sheet Tab
The KPI Definition Sheet Tab acts as a single source of truth.
Information Stored Here
- KPI Name
- KPI Group
- Unit of measurement
- KPI Formula
- KPI Definition
Because everyone refers to the same definitions, this sheet ensures consistency, clarity, and alignment across teams.

Advantages of Online Subscription Platforms KPI Dashboard in Excel
Using this KPI dashboard delivers several practical advantages.
- Centralized Performance Monitoring
- All KPIs available in one place
- No dependency on multiple reports
- Faster reviews and audits
- Real-Time Decision Support
- Instant monthly updates
- Immediate performance signals
- Faster corrective actions
- Target vs Actual Visibility
- Clear gap analysis
- Performance accountability
- Improved goal tracking
- Cost-Effective Analytics Solution
- No expensive BI tools required
- Uses existing Excel skills
- Easy to deploy and maintain
- Scalable and Customizable Design
- Add or remove KPIs easily
- Modify formulas and targets
- Adapt dashboard to business growth
How Does This Dashboard Improve Subscription Business Decisions?
This dashboard supports smarter decisions because it:
- Identifies churn risks early
- Highlights revenue growth opportunities
- Tracks performance trends clearly
- Improves communication with stakeholders
- Aligns teams with measurable goals
As a result, subscription platforms can grow sustainably and profitably.
Best Practices for Online Subscription Platforms KPI Dashboard in Excel
To maximize value, follow these proven best practices.
- Define KPIs Clearly Before Building
- Avoid vague metrics
- Align KPIs with business goals
- Keep KPI definitions simple
- Maintain Consistent Data Entry
- Update actual numbers monthly
- Validate inputs regularly
- Avoid overwriting formulas
- Review Trends Monthly
- Analyze MTD and YTD trends
- Identify anomalies early
- Adjust strategies quickly
- Keep Targets Realistic
- Base targets on historical data
- Adjust targets quarterly
- Communicate changes clearly
- Use Conditional Formatting Wisely
- Highlight performance gaps
- Avoid visual clutter
- Focus on actionable insights
Who Can Use an Online Subscription Platforms KPI Dashboard in Excel?
This dashboard benefits a wide range of users:
- Subscription business owners
- SaaS founders
- Finance and revenue teams
- Growth and retention managers
- Business analysts
- Operations managers
Because Excel is widely used, adoption becomes fast and frictionless.
How Does This Dashboard Compare to BI Tools?
While BI tools offer advanced features, Excel dashboards remain popular because they:
- Require no additional software cost
- Allow faster customization
- Work offline
- Support quick ad-hoc analysis
For many subscription businesses, Excel delivers more than enough analytical power.
Conclusion: Why Should You Use an Online Subscription Platforms KPI Dashboard in Excel?
An Online Subscription Platforms KPI Dashboard in Excel transforms raw subscription data into clear, actionable insights. It eliminates guesswork, improves accountability, and supports smarter decisions.
Because the dashboard combines MTD, YTD, Target, Previous Year, and trend analysis, it becomes a complete performance monitoring solution. Moreover, its structured design, flexibility, and cost efficiency make it ideal for growing subscription businesses.
If you want clarity, control, and consistent growth, this KPI dashboard becomes an essential business tool.
Frequently Asked Questions (FAQs)
- What is the main purpose of an Online Subscription Platforms KPI Dashboard in Excel?
The main purpose is to track, analyze, and compare subscription KPIs in a centralized and structured format.
- Can beginners use this KPI dashboard?
Yes, the dashboard uses simple Excel features like drop-downs, formulas, and conditional formatting.
- How often should I update the dashboard?
You should update actual numbers monthly to maintain accurate MTD and YTD analysis.
- Can I customize KPIs in the dashboard?
Yes, you can easily add, remove, or modify KPIs in the KPI Definition sheet.
- Does this dashboard support year-over-year comparison?
Yes, it includes a dedicated Previous Year Number sheet for comparison.
- Is Excel suitable for subscription analytics?
Yes, Excel works well for subscription analytics when dashboards follow a structured design.
- Can this dashboard scale with business growth?
Yes, the dashboard supports scalability through flexible KPI configuration and structured inputs.
Visit our YouTube channel to learn step-by-step video tutorials
Watch the step-by-step video tutorial:
Click to buy Online Subscription Platforms KPI Dashboard in Excel