Managing ophthalmology services requires precision, speed, and continuous performance monitoring. Eye hospitals, clinics, and diagnostic centers handle large volumes of patients, procedures, treatments, and resources every day. However, without a structured analytics system, it becomes difficult to understand performance gaps, service quality, and operational efficiency. That is exactly where the Ophthalmology Services KPI Dashboard in Power BI plays a critical role.
An Ophthalmology Services KPI Dashboard in Power BI converts raw operational and clinical data into meaningful performance insights. Moreover, it allows healthcare leaders to track targets, actual achievements, and historical trends from a single interactive platform. Since the dashboard uses Excel as a data source and Power BI for visualization, it remains both flexible and powerful.
In this article, you will learn everything about the Ophthalmology Services KPI Dashboard in Power BI. You will understand how it works, why it matters, what each dashboard page shows, and how best practices help you get maximum value from it. Additionally, this guide explains how eye care organizations can use the dashboard for smarter, faster, and more data-driven decisions.
Click to Purchases Ophthalmology Services KPI Dashboard in Power BI
What Is an Ophthalmology Services KPI Dashboard in Power BI?
An Ophthalmology Services KPI Dashboard in Power BI is a ready-to-use analytical dashboard designed to monitor, analyze, and compare key performance indicators related to ophthalmology services.
Instead of reviewing multiple reports for patient volume, procedure counts, or service efficiency, this dashboard brings all essential KPIs into one structured and visual environment. As a result, clinicians and administrators get instant clarity on service performance.
The dashboard connects directly to Excel-based data and transforms it into interactive tables, visuals, and trend charts. Therefore, hospitals and clinics can track performance consistently without complex technical setups.
Why Is an Ophthalmology KPI Dashboard Important for Healthcare Organizations?
Ophthalmology services involve both clinical outcomes and operational processes. Without proper KPI tracking, organizations struggle to balance quality care with efficiency.
Here is why this dashboard becomes essential:
-
It centralizes ophthalmology service KPIs in one place
-
It improves visibility across months and years
-
It supports data-driven clinical and operational decisions
-
It highlights target achievements and gaps clearly
-
It saves time by reducing manual reporting
As a result, healthcare providers improve service quality while maintaining operational control.
Click to Purchases Ophthalmology Services KPI Dashboard in Power BI
How Does the Ophthalmology Services KPI Dashboard in Power BI Work?
The dashboard follows a simple and effective workflow:
-
Users enter actual and target data in Excel sheets
-
Power BI connects to these Excel sheets
-
Calculations update automatically for MTD and YTD
-
Visuals refresh instantly after data updates
Therefore, teams focus more on insights and less on data preparation.
What Are the Key Features of the Ophthalmology Services KPI Dashboard in Power BI?
The dashboard includes three thoughtfully designed pages, each serving a specific analytical purpose.
Summary Page: What Does the High-Level Overview Show?
The Summary Page acts as the main landing page of the dashboard. It provides a complete snapshot of ophthalmology service performance.
Slicers on the Summary Page
-
Month Slicer: Filters data by selected month
-
KPI Group Slicer: Filters KPIs by category or functional group
These slicers allow users to focus on relevant performance segments instantly.
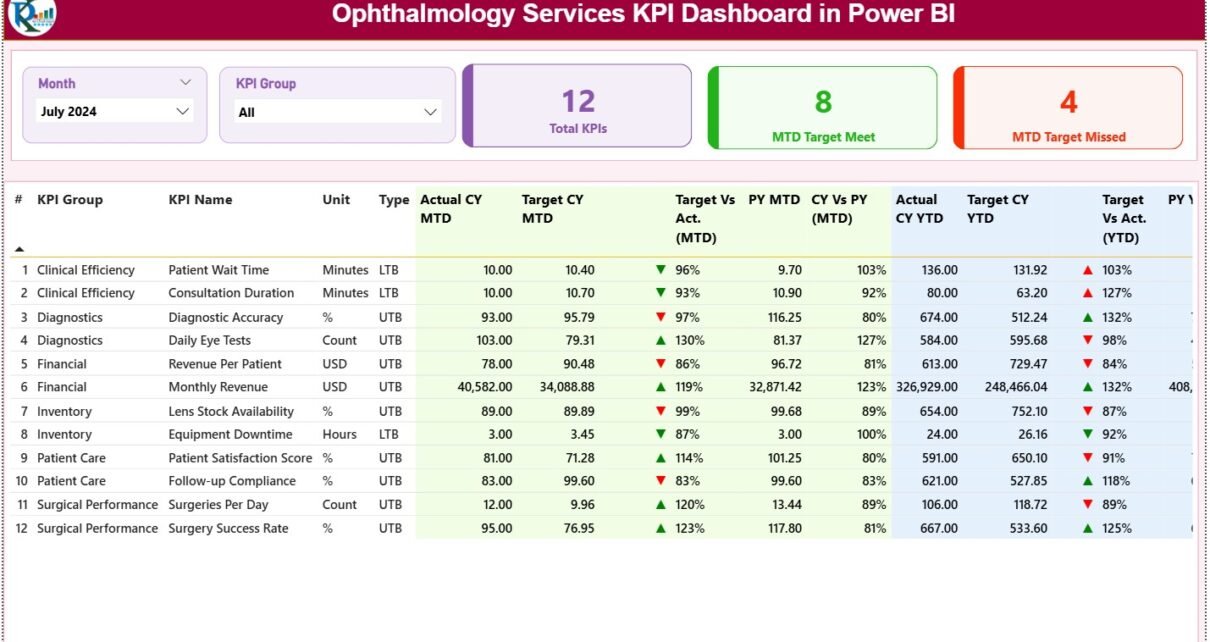
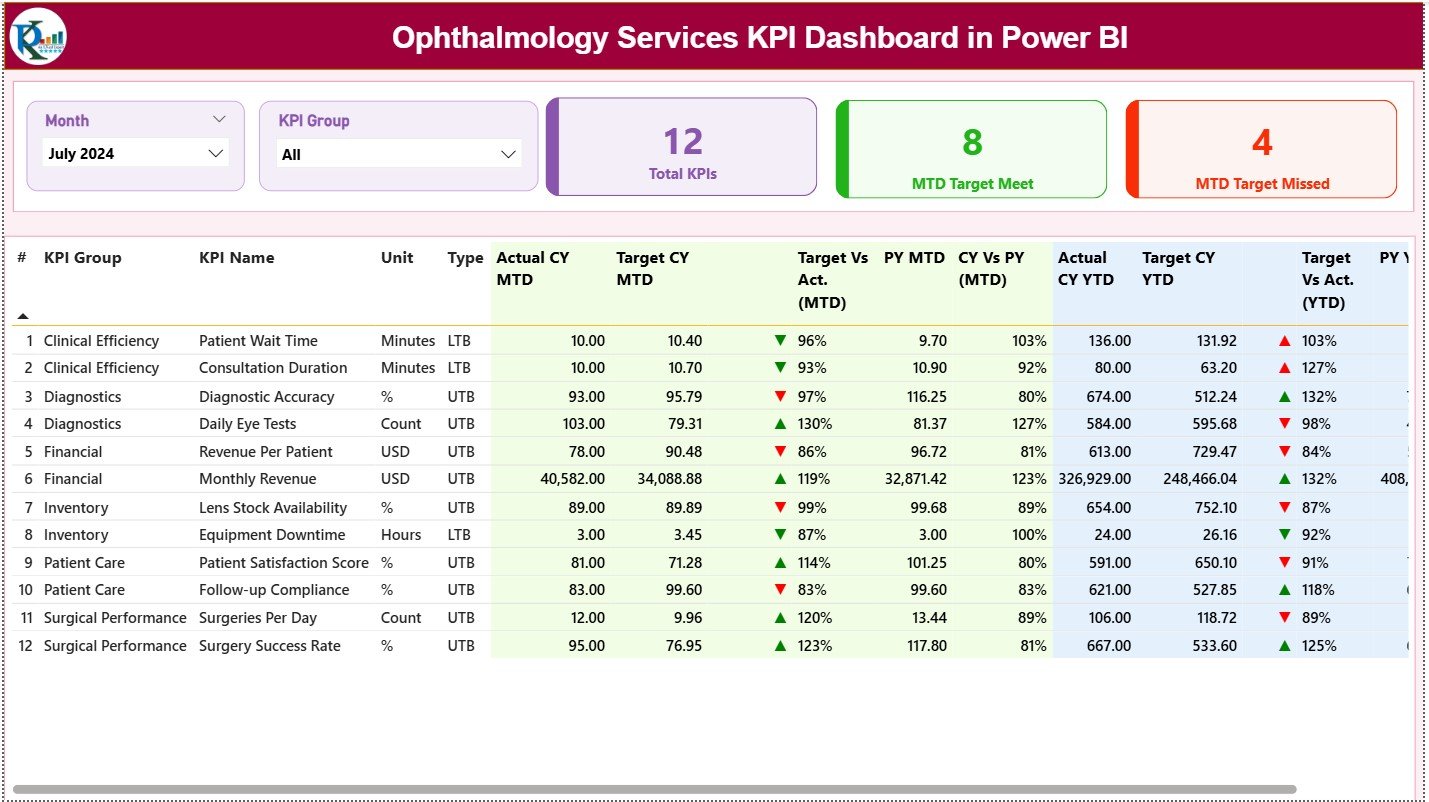
KPI Cards: What Quick Insights Do They Provide?
At the top of the Summary Page, three KPI cards display:
-
Total KPIs Count
-
MTD Target Met Count
-
MTD Target Missed Count
These cards immediately show how well ophthalmology services perform against set targets.
Detailed KPI Performance Table: What Does It Include?
Below the cards, the dashboard displays a detailed KPI table for deeper analysis.
KPI Identification Columns
-
KPI Number: Sequential identifier of KPIs
-
KPI Group: Category or service group of KPIs
-
KPI Name: Name of the ophthalmology KPI
-
Unit: Measurement unit such as %, count, or hours
-
Type: KPI direction type (LTB or UTB)
Monthly Performance Metrics (MTD)
-
Actual CY MTD: Current year actual month-to-date value
-
Target CY MTD: Current year target month-to-date value
-
MTD Icon: Red ▼ or Green ▲ indicator for performance status
-
Target vs Actual (MTD): Actual ÷ Target percentage
-
PY MTD: Previous year MTD value
-
CY vs PY (MTD): Current MTD ÷ Previous MTD comparison
Year-to-Date Performance Metrics (YTD)
-
Actual CY YTD: Current year accumulated performance
-
Target CY YTD: Current year YTD target
-
YTD Icon: Performance indicator for YTD
-
Target vs Actual (YTD): Actual ÷ Target (YTD)
-
PY YTD: Previous year accumulated value
-
CY vs PY (YTD): Year-over-year performance comparison
Because of this structure, users can clearly track short-term and long-term service performance.
Click to Purchases Ophthalmology Services KPI Dashboard in Power BI
KPI Trend Page: How Do You Analyze Trends Over Time?
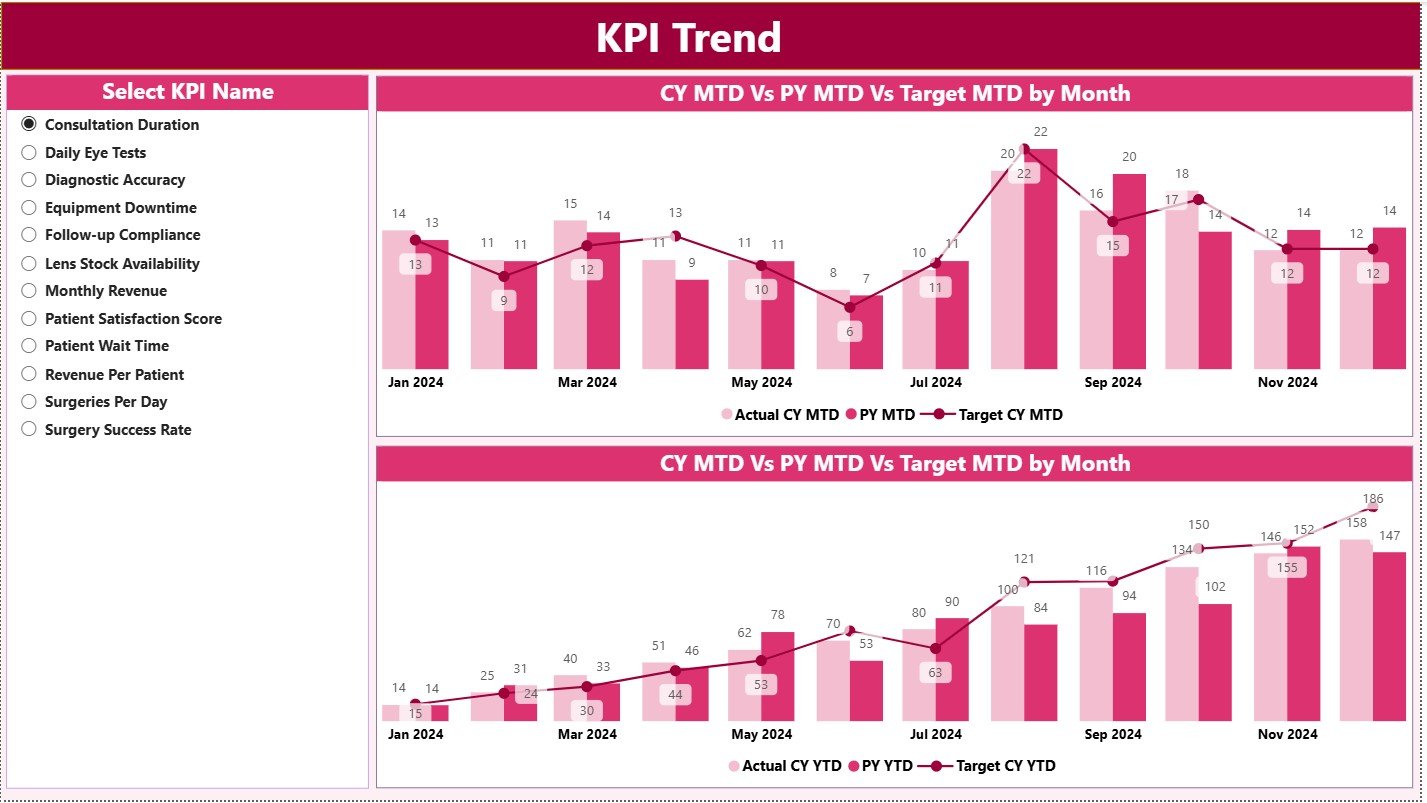
The KPI Trend Page focuses on trend analysis and historical comparison.
What Visuals Appear on This Page?
-
Two combo charts for MTD and YTD trends
-
Current Year Actual values
-
Previous Year Actual values
-
Target values for benchmarking
KPI Selection with Slicer
A slicer on the left allows users to select a specific KPI. As soon as the KPI changes, all trend charts update automatically.
Therefore, users can identify improvement patterns, seasonal fluctuations, and performance gaps effortlessly.
KPI Definition Page: Where Can You Understand KPI Logic?
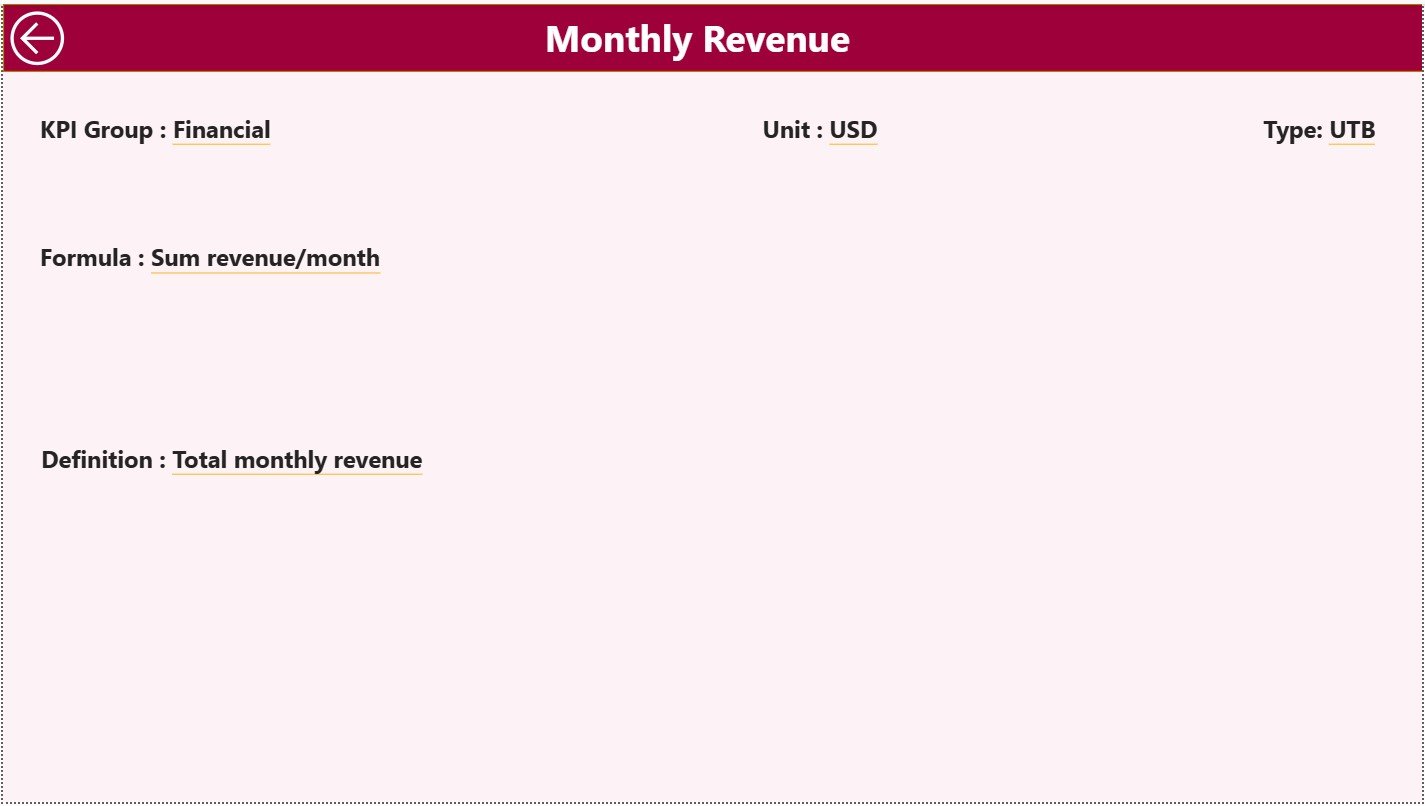
The KPI Definition Page ensures transparency and clarity.
How Does This Page Work?
-
It acts as a drill-through page
-
It remains hidden by default for a clean UI
-
Users drill through from the Summary Page
What Information Does It Show?
-
KPI Formula
-
KPI Definition
-
Meaning and usage of the KPI
A Back button on the top-left helps users return to the Summary Page quickly.
What Excel Data Structure Supports This Dashboard?
The dashboard uses Excel as its data source, which makes it easy to maintain and update.
Required Excel Worksheets
The Excel file consists of three mandatory sheet tabs.
Input_Actual Sheet: How Do You Capture Actual Performance?
This sheet stores real operational or clinical performance data.
Required Fields
- KPI Name
- Month (first date of the month)
- MTD Value
- YTD Value
Users only need to update this sheet regularly.
Input_Target Sheet: How Do You Manage Targets?
This sheet captures performance benchmarks and goals.
Required Fields
- KPI Name
- Month (first date of the month)
- MTD Target
- YTD Target
Since targets remain separate, comparisons stay accurate.
KPI Definition Sheet: Why Is It Critical?
This sheet defines the logic behind each KPI.
Required Columns
-
KPI Number
-
KPI Group
-
KPI Name
-
Unit
-
Formula
-
Definition
-
Type (LTB or UTB)
As a result, KPI tracking stays consistent and standardized.
Click to Purchases Ophthalmology Services KPI Dashboard in Power BI
Advantages of Ophthalmology Services KPI Dashboard in Power BI
Using this dashboard delivers strong operational and clinical benefits.
✅ Centralized monitoring of ophthalmology KPIs
✅ Clear MTD and YTD performance visibility
✅ Instant identification of target achievement and misses
✅ Interactive filtering for focused analysis
✅ Reduced manual reporting effort
✅ Improved accountability across departments
Because of these advantages, healthcare teams make faster and better decisions.
Best Practices for the Ophthalmology Services KPI Dashboard in Power BI
Following best practices ensures long-term dashboard success.
-
Define KPIs clearly and avoid ambiguity
-
Use consistent units of measurement
-
Review targets periodically for relevance
-
Update Excel data on a fixed schedule
-
Monitor MTD and YTD metrics together
-
Keep KPI groups logically organized
When teams follow these practices, insight quality improves significantly.
Common Mistakes to Avoid While Using the Dashboard
Avoiding common mistakes helps maintain dashboard reliability.
-
Avoid incorrect month date formats in Excel
-
Do not mix actual and target data in one sheet
-
Avoid excessive KPIs that dilute focus
-
Do not skip previous year comparisons
-
Avoid unclear KPI definitions
By avoiding these errors, users preserve dashboard accuracy.
Who Should Use the Ophthalmology Services KPI Dashboard?
This dashboard supports a wide range of users.
-
Ophthalmology Clinic Managers
-
Hospital Administrators
-
Clinical Operations Teams
-
Quality Assurance Teams
-
Healthcare Analysts
-
Senior Management
Since the design remains intuitive, both technical and non-technical users can use it confidently.
Conclusion
The Ophthalmology Services KPI Dashboard in Power BI simplifies complex performance tracking into a single, interactive analytical solution. It improves visibility, strengthens accountability, and enables proactive decision-making.
By combining Excel-based inputs with the analytical power of Power BI, ophthalmology organizations gain real-time insight into service efficiency, target achievement, and historical trends. As a result, they can improve patient care and operational outcomes simultaneously.
For any eye care provider aiming to deliver consistent quality and performance excellence, this dashboard becomes an essential tool.
Click to Purchases Ophthalmology Services KPI Dashboard in Power BI
Frequently Asked Questions (FAQs)
What is the main purpose of an Ophthalmology Services KPI Dashboard?
It helps track and analyze ophthalmology service performance against targets and past results.
Can I update data without changing Power BI visuals?
Yes. You only need to update the Excel input sheets and refresh the dashboard.
Does this dashboard support MTD and YTD analysis?
Yes. The dashboard includes detailed MTD and YTD performance metrics.
Can new KPIs be added easily?
Yes. Add new KPIs in the KPI Definition, Input_Actual, and Input_Target sheets.
Is this dashboard suitable for hospitals and clinics?
Yes. It works effectively for both large hospitals and small ophthalmology clinics.
Does using this dashboard require advanced Power BI skills?
No. Basic Excel knowledge and Power BI navigation skills are sufficient.
Click to Purchases Ophthalmology Services KPI Dashboard in Power BI
Visit our YouTube channel to learn step-by-step video tutorials