Farmers manage many activities every day. They monitor soil health, crop growth, fertilizer use, irrigation patterns, and overall farm performance. Because of this, they often struggle with scattered reports and manual calculations. However, the Organic Farming Dashboard in Excel solves this problem. It brings all farming insights into one clean, visual, and interactive dashboard.
In this detailed guide, you will learn everything about this dashboard, including its structure, key pages, features, advantages, best practices, and more. You will also see how Excel helps farmers understand crop performance, cost trends, and profit margins without depending on expensive tools.
Click to Purchases Organic Farming Dashboard in Excel
What Is an Organic Farming Dashboard in Excel?
An Organic Farming Dashboard in Excel is a visual reporting tool that helps farmers track and analyze all farming activities in one single place. It uses your daily or monthly farm data and converts it into charts, summaries, and insights that help you make better decisions. You can understand fertilizer usage, irrigation efficiency, crop health, and total cost trends without doing any manual calculations.
Moreover, this dashboard works as a ready-to-use template. You only enter your farm data in the data sheet, and the dashboard updates automatically. Because of this, farmers save time, reduce errors, and get accurate information every time they need it.
Why Do Farmers Need an Organic Farming Dashboard?
Farm management becomes complex when farms expand. You handle multiple crops, seasons, soil types, and fertilizer combinations. You need to check what works best and what needs improvement. However, manual tracking slows down decisions and creates confusion.
The dashboard solves this challenge because it shows:
-
Which farm type brings the highest profit
-
Which irrigation method increases healthy crop percentage
-
How fertilizer cost changes across regions
-
Which soil type gives better revenue
-
How profits change month by month
Therefore, farmers stay organized, confident, and more productive.
Key Features of the Organic Farming Dashboard in Excel
The dashboard has five well-designed analysis pages and a clean page navigator on the left side. Each page focuses on a specific farming area.
Let’s look at each page in detail.
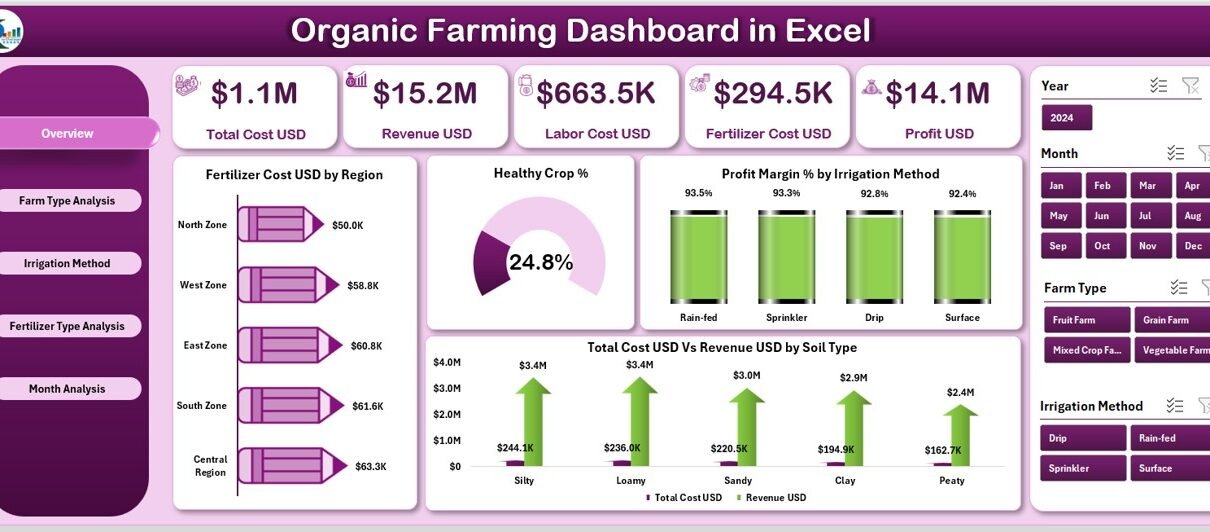
1. Overview Page
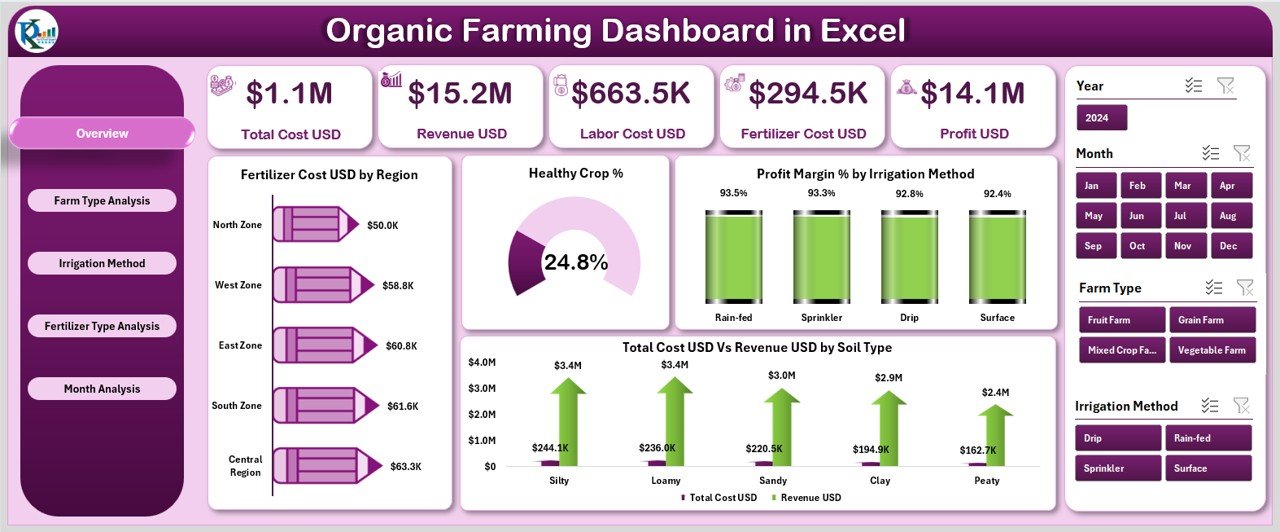
The Overview Page works as the central page of your dashboard. You see a quick summary of your entire farm performance.
Cards on the Overview Page
The top section includes five important cards that highlight key performance indicators (KPIs). These cards help you understand:
-
Total Cost
-
Total Revenue
-
Fertilizer Cost
-
Healthy Crop Percentage
-
Profit Margin
These KPIs change automatically as you update your data.
Charts on the Overview Page
The Overview Page includes four powerful charts:
-
Fertilizer Cost (USD) by Region – Shows which region spends the highest amount on fertilizer.
-
Healthy Crop % – Displays the percentage of crops that grow well under organic methods.
-
Profit Margin % by Irrigation Method – Helps you compare which irrigation technique provides better profit.
-
Total Cost (USD) Vs Revenue (USD) by Soil Type – Shows how different soil types affect your cost and income.
These charts help you compare performance quickly and make confident decisions.
2. Farm Type Analysis Page
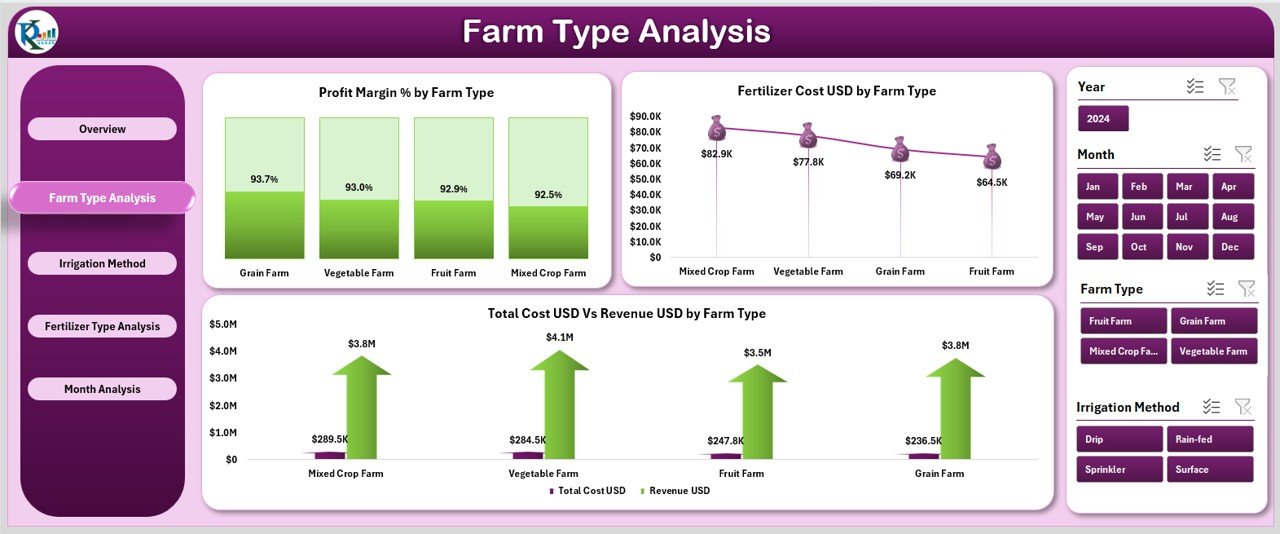
Different farms perform differently. Some farm types have higher fertilizer usage, while others deliver better revenue.
This page helps you understand the performance of each farm type.
Charts in Farm Type Analysis
You get three main charts:
-
Profit Margin % by Farm Type
-
Fertilizer Cost (USD) by Farm Type
-
Total Cost (USD) Vs Revenue (USD) by Farm Type
These charts help you decide:
-
Which farm type delivers higher performance
-
Where you need to reduce cost
-
Which farm type brings better profitability
Farm owners use this page to identify the strongest and weakest farm types and optimize operations.
3. Irrigation Method Analysis Page
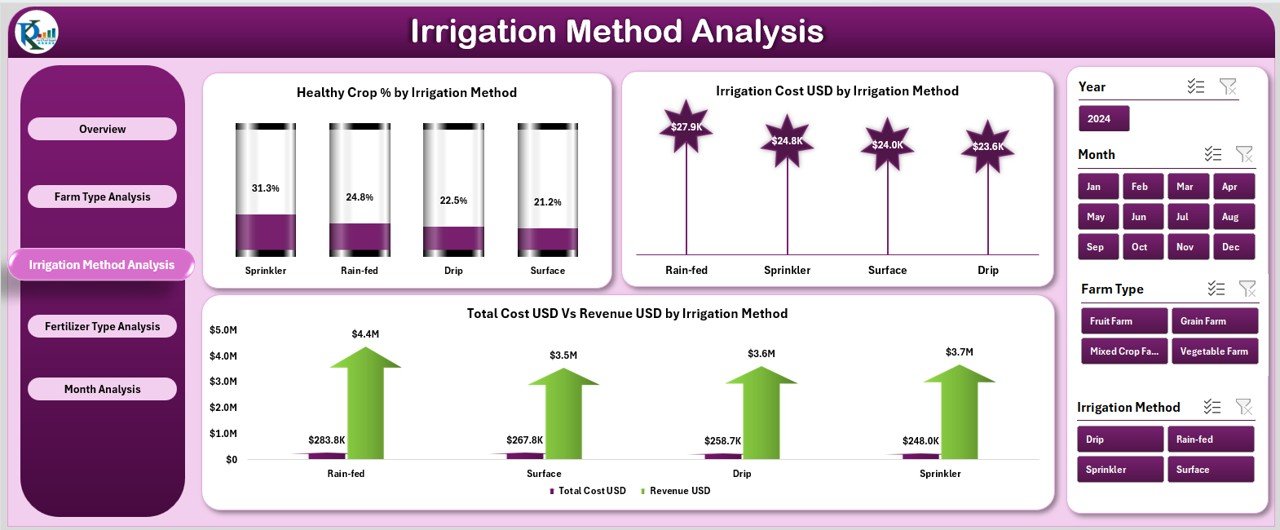
Irrigation plays a major role in organic farming. If you choose the right irrigation method, you can improve crop health and reduce water cost.
This page simplifies irrigation analysis with three useful charts:
-
Healthy Crop % by Irrigation Method
-
Irrigation Cost (USD) by Irrigation Method
-
Total Cost (USD) Vs Revenue (USD) by Irrigation Method
These charts help you answer questions like:
-
Which irrigation method improves crop health the most?
-
Which method reduces water cost?
-
Which irrigation method gives higher profitability?
Farmers use this page to select the best irrigation strategy for long-term growth.
4. Fertilizer Type Analysis Page
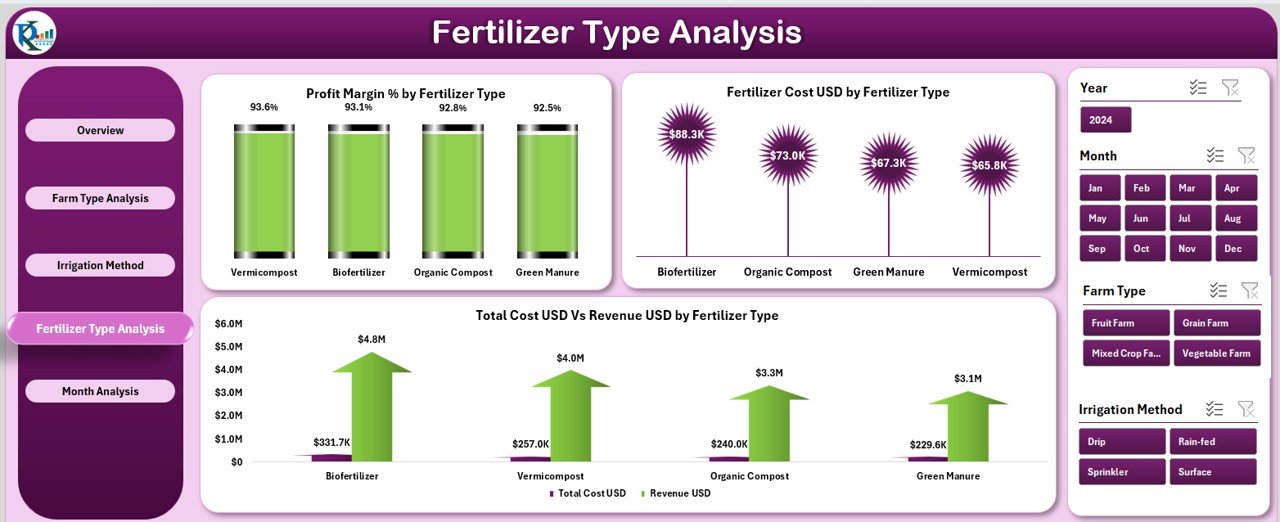
Organic fertilizers come in many types. Each type affects the soil, crop, and cost differently. Because of this, farmers need clarity about which fertilizer gives the best results.
Click to Purchases Organic Farming Dashboard in Excel
This page shows three important charts:
-
Profit Margin % by Fertilizer Type
-
Fertilizer Cost (USD) by Fertilizer Type
-
Total Cost (USD) Vs Revenue (USD) by Fertilizer Type
The charts give clear insights about profitable fertilizer options and cost-heavy products.
5. Month Analysis Page
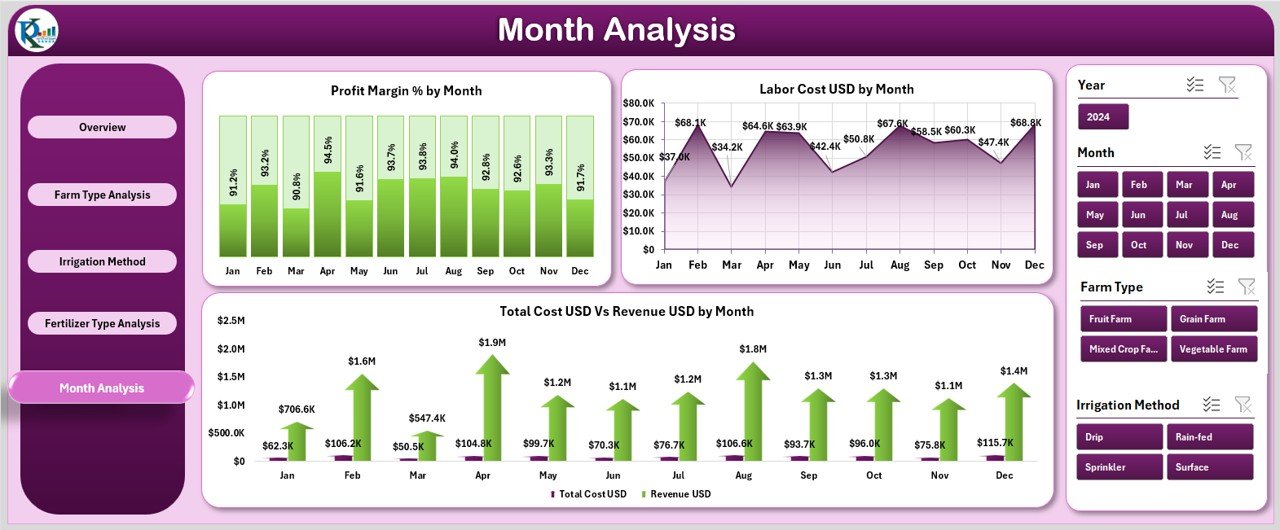
Farming performance changes every month. Both seasonal and environmental conditions influence cost and profit.
This page includes three charts:
-
Profit Margin % by Month
-
Labor Cost (USD) by Month
-
Total Cost (USD) Vs Revenue (USD) by Month
These charts show how performance shifts across the year. Therefore, you can plan better for the next season.
Support Sheet
This sheet contains all additional calculations, lookups, and formulas required for the dashboard. It works in the background and helps the dashboard function smoothly.
Data Sheet
This is the only sheet you need to update regularly. You enter your farming data here. The dashboard reads the data and updates automatically.
The data sheet includes fields such as:
-
Region
-
Farm Type
-
Irrigation Method
-
Fertilizer Type
-
Soil Type
-
Cost Data
-
Revenue Data
-
Crop Health Data
-
Month and Year
Because of this structured layout, Excel processes information faster and delivers accurate results.
Advantages of Using an Organic Farming Dashboard in Excel
Farmers get many benefits when they use this dashboard. Here are the most important advantages:
1. Better Farm Planning
The dashboard shows trends, seasonal behavior, cost patterns, and revenue insights. Farmers use this information to plan better and improve efficiency.
2. Higher Profitability
The dashboard highlights which farm types, fertilizers, and irrigation methods generate more profit. As a result, farmers make smarter investment decisions.
3. Faster Decision-Making
Since all charts update automatically, farmers do not waste time on manual calculations. They get instant answers based on real data.
4. Cost Control
Dashboard charts help identify areas where cost increases. Farmers optimize labor, fertilizer use, and irrigation cost with more clarity.
5. Improved Crop Health Monitoring
Healthy Crop % charts guide farmers toward better cultivation practices. They understand what improves crop quality and what damages it.
6. Simple and Easy to Use
The dashboard uses Excel only, which means:
-
No expensive software
-
No training required
-
Easy customization
-
Automatic calculations
This makes it highly useful for farmers and consultants.
How to Use the Organic Farming Dashboard Effectively
You can use this dashboard easily. Follow these steps:
-
Open the dashboard
-
Go to the Data Sheet
-
Enter your farm details
-
Check the Overview Page
-
Explore each analysis page
-
Compare charts and insights
-
Make decisions based on trends
Because everything updates automatically, you save time and effort.
Best Practices for Using the Organic Farming Dashboard in Excel
To get the best results, follow these best practices:
1. Enter Data Consistently
Use the same units when you enter data such as cost, revenue, or crop health percentage. Consistent data leads to accurate results.
2. Update Data Regularly
Do not wait for several months. Update your data weekly or monthly to track performance accurately.
3. Avoid Empty Fields
Fill all important fields such as farm type, fertilizer type, and cost data so that charts remain accurate.
4. Use Filters and Slicers
Filters help you compare different regions, soil types, seasons, and farm types instantly.
5. Review Trends Before Decisions
Check month-wise and category-wise trends before investing in fertilizers, machinery, or irrigation systems.
6. Customize the Dashboard
Add new fields, charts, or slices based on your farm requirements. Excel allows full customization.
Conclusion
Organic farming becomes simpler when farmers understand their complete farm performance in one place. The Organic Farming Dashboard in Excel gives you that clarity. It shows cost trends, profit margins, irrigation performance, fertilizer impact, and crop health with clean and interactive charts.
Because of this dashboard, farmers save time, reduce errors, manage cost, and improve crop quality. It empowers every farm owner to make smart decisions and grow their farming business confidently.
This dashboard works for small farms, large farms, consultants, agriculture departments, and agribusiness teams. With this single Excel tool, you analyze your farming performance and take your farm productivity to a higher level.
Frequently Asked Questions (FAQs)
1. What is an Organic Farming Dashboard in Excel?
It is a visual reporting tool that helps farmers track farm cost, revenue, crop health, fertilizer usage, and irrigation performance in an Excel-based dashboard.
2. Who can use this dashboard?
Farmers, agriculture consultants, farm managers, research teams, and agribusiness planners can use it.
3. Do I need advanced Excel skills to use this dashboard?
No. You only update the data sheet. The dashboard updates automatically.
4. Can I customize the dashboards and charts?
Yes, Excel allows full customization. You can add new fields, charts, or filters anytime.
5. How often should I update the data?
You should update it weekly or monthly, depending on how frequently your farm activities change.
6. Does this dashboard support multiple farm locations?
Yes, you can track multiple regions, soil types, irrigation methods, and farm types in one file.
7. Can I track profit and cost monthly?
Yes, the Month Analysis page helps you track monthly cost, revenue, and profit margin trends.
Visit our YouTube channel to learn step-by-step video tutorials