Modern agriculture changes very fast. Farmers manage crops, land, labor, soil health, irrigation, and production every day. Because of this, they need a simple way to see how their farms perform. As a result, the Organic Farming KPI Dashboard in Power BI has become one of the most powerful tools for farm owners, farm managers, and agriculture analysts.
This dashboard offers a clean and clear view of all organic farming activities. It also converts complex data into simple visuals. Therefore, farmers can track their performance, improve decisions, and increase profitability without any confusion.
In this article, you will learn everything about the Organic Farming KPI Dashboard in Power BI, including features, benefits, working structure, best practices, and real examples.
Click to Purchases Organic Farming KPI Dashboard in Power BI
What Is an Organic Farming KPI Dashboard in Power BI?
An Organic Farming KPI Dashboard in Power BI is a visual reporting tool that collects farming data from Excel or other sources and displays it in charts, cards, and tables. It shows farm KPIs like crop health, fertilizer use, irrigation performance, revenue, cost, and soil indicators.
Because the dashboard is interactive, users can filter data by month, group, or KPI name. Therefore, it becomes very easy to compare performance over time.
This dashboard contains three main pages:
✔ Summary Page
✔ KPI Trend Page
✔ KPI Definition Page
Each page offers a different level of detail so users get a complete picture of farming operations.
Click to Purchases Organic Farming KPI Dashboard in Power BI
Why Do You Need an Organic Farming KPI Dashboard?
Farm data grows every day. Without a dashboard, farmers often rely on manual reports or scattered spreadsheets. This slows down decision-making and increases mistakes. However, with a Power BI dashboard, the entire workflow becomes smooth.
You need this dashboard because:
-
It provides real-time visibility.
-
It highlights problem areas quickly.
-
It helps compare current performance with past performance.
-
It ensures better financial and operational decisions.
-
It simplifies data tracking across multiple farming activities.
In short, the dashboard helps farmers run their business with clarity and confidence.
Key Features of the Organic Farming KPI Dashboard in Power BI
Now, let’s explore each feature of the dashboard in detail.
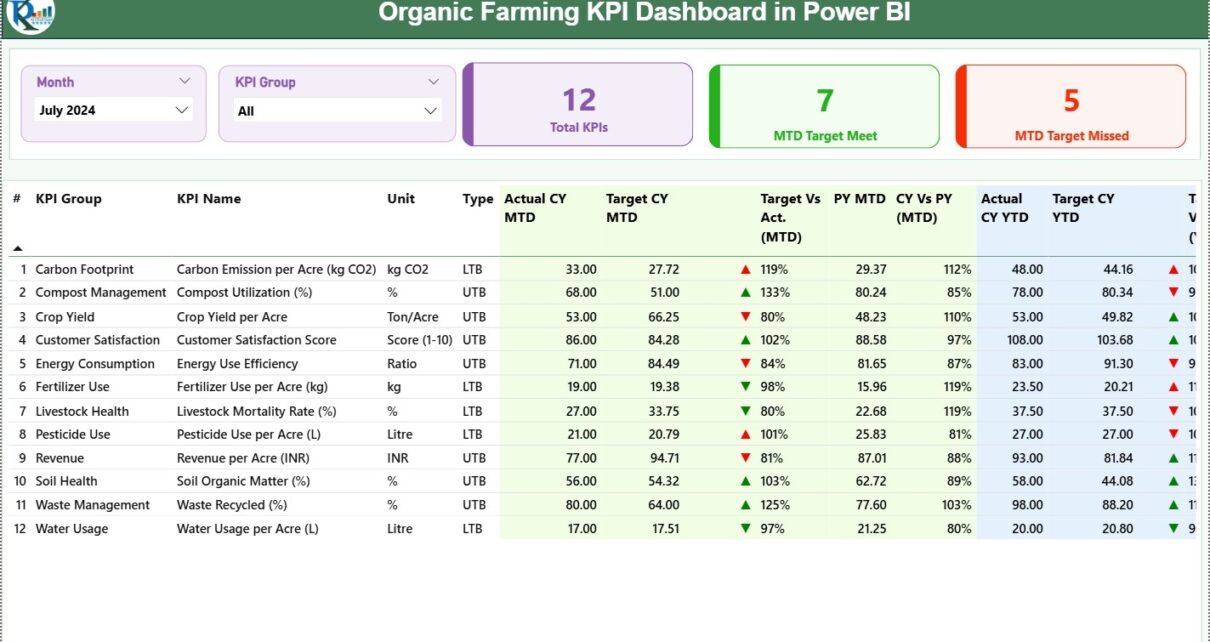
1. Summary Page – The Main Control Center

The Summary Page works like the main hub of your dashboard. Users can understand the overall farm performance without clicking anywhere else.
Important Elements on the Summary Page
✔ Month Slicer
Users select the month they want to analyze. This helps with MTD and YTD performance review.
✔ KPI Group Slicer
Users filter KPIs by category such as Soil, Irrigation, Production, Fertilizer, Labor, or Profitability.
✔ Three KPI Cards
These cards give an instant performance snapshot:
-
Total KPIs Count
-
MTD Target Met Count
-
MTD Target Missed Count
These numbers help identify how the farm performs at a high level.
Detailed KPI Table – Full Transparency in One Place
The table displays complete KPI details with actual numbers, targets, and comparison values. It includes:
-
KPI Number
-
KPI Group
-
KPI Name
-
Unit
-
Type (LTB or UTB)
-
Actual CY MTD
-
Target CY MTD
-
MTD Icon (▲ or ▼)
-
Target vs Actual % (MTD)
-
PY MTD
-
CY vs PY % (MTD)
-
Actual CY YTD
-
Target CY YTD
-
YTD Icon (▲ or ▼)
-
Target vs Actual % (YTD)
-
PY YTD
-
CY vs PY % (YTD)
The up/down icon shows the KPI status. Green ▲ means the KPI performs well. Red ▼ means it needs improvement.
This level of clarity helps managers respond faster.
Click to Purchases Organic Farming KPI Dashboard in Power BI
2. KPI Trend Page – Easy Performance Comparison

The KPI Trend page displays two combo charts that show:
-
Actual CY Values
-
Target Values
-
Previous Year Values
-
Line visual for trend clarity
Users select the KPI name from the slicer. Then the charts update instantly.
Charts on the KPI Trend Page
⭐ MTD Trend Combo Chart
Shows monthly performance of the selected KPI.
⭐ YTD Trend Combo Chart
Shows cumulative yearly progress.
With trend visuals, users catch declines, improvements, or unusual spikes quickly.
3. KPI Definition Page – Clear Details for Every KPI

This is a hidden drill-through page. Users click on any KPI from the Summary Page to see:
-
KPI Name
-
KPI Group
-
KPI Number
-
Unit
-
Formula
-
Type (LTB or UTB)
-
Detailed KPI Definition
This ensures that every user understands how KPIs work. No confusion. No wrong interpretation.
To return, users click the Back Button on the top-left corner.
How the Excel Data Structure Works
This dashboard uses an Excel file with three sheets. Each sheet has a clear role.
1. Input_Actual Sheet
Users enter:
-
KPI Name
-
Month (use first date of month)
-
MTD Actual
-
YTD Actual
This sheet stores real performance values.
2. Input_Target Sheet
Users enter:
-
KPI Name
-
Month (use first date of month)
-
MTD Target
-
YTD Target
This sheet stores target performance values.
3. KPI_Definition Sheet
Users enter:
-
KPI Number
-
KPI Group
-
KPI Name
-
Unit
-
Formula
-
Definition
-
Type (LTB or UTB)
This data feeds the drill-through page.
With this structured Excel data, the Power BI dashboard becomes dynamic and accurate.
Click to Purchases Organic Farming KPI Dashboard in Power BI
Advantages of the Organic Farming KPI Dashboard in Power BI
Farmers get many benefits when they use this dashboard.
1. Better Visibility of Farming Operations
The dashboard shows all farming KPIs at one place. As a result, users understand what works and what needs attention.
2. Faster Decision-Making
Because the visuals are simple, managers act quickly. They do not waste time searching for numbers.
3. Easy Month-to-Month and Year-to-Year Comparison
The dashboard shows both MTD and YTD values. It also compares them with previous year numbers.
This helps identify growth patterns.
4. Real-Time Performance Monitoring
Users update the Excel file. Power BI refreshes the dashboard. Everything becomes real-time.
5. Better Productivity and Cost Control
When farmers track KPIs like fertilizer cost, irrigation cost, crop health, or production output, they use resources more wisely.
6. Simple and Clean User Experience
The slicers, cards, combo charts, drill-through page, and smart color coding make the dashboard user friendly.
How to Build an Organic Farming KPI Dashboard in Power BI?
Let’s break down the simple steps to build this dashboard.
Step 1: Prepare the KPI Definition Sheet
Add:
-
KPI Number
-
KPI Name
-
KPI Group
-
Unit
-
Formula
-
Type
-
Definition
This sheet becomes the base of your dashboard.
Step 2: Fill the Input Actual Sheet
Add Actual values for each KPI for MTD and YTD.
Step 3: Fill the Input Target Sheet
Add Target values for MTD and YTD.
Step 4: Load Data Into Power BI
Import the Excel file into Power BI Desktop.
Step 5: Build Relationships
Use KPI Name as the key connection.
Step 6: Create Measures for MTD and YTD Calculations
These include:
-
Actual MTD
-
Target MTD
-
Actual YTD
-
Target YTD
-
CY vs PY Comparison
Step 7: Create Summary Page Visuals
Add:
-
Cards
-
Table
-
Slicers
-
Icons
-
Conditional formatting
Step 8: Create KPI Trend Page
Add combo charts with three values:
-
Actual
-
Target
-
Previous Year
Step 9: Add Drill-Through Functionality
Link the KPI definition page with “KPI Name”.
Click to Purchases Organic Farming KPI Dashboard in Power BI
Best Practices for the Organic Farming KPI Dashboard in Power BI
Follow these best practices to get the best output from your dashboard.
1. Keep Your KPI Definitions Clear
Use simple KPI names and clear formulas. This avoids confusion.
2. Use Consistent Units
If you track fertilizer use, irrigation, or production, keep the units consistent.
3. Update Data Every Month
Fresh data gives more accurate analysis.
4. Use Clear Icons and Colors
Green ▲ for positive results
Red ▼ for negative results
This makes the dashboard easy to read.
5. Avoid Too Many KPIs on One Page
Focus on important KPIs only. Do not overload the page.
6. Refresh Power BI Regularly
Refreshing helps the dashboard show the latest numbers.
Conclusion
The Organic Farming KPI Dashboard in Power BI gives farmers and farm managers a strong and simple way to track farm performance. The dashboard makes complex data easy to understand. It also helps compare performance across months and years.
Because of its clean visuals, trend charts, slicers, icons, and drill-through page, users get full visibility of their farm KPIs. As a result, they take faster decisions, reduce costs, and improve productivity.
If you want real-time analytics for your organic farm, this dashboard is the smartest tool you can use.
Click to Purchases Organic Farming KPI Dashboard in Power BI
Frequently Asked Questions (FAQs)
1. What is an Organic Farming KPI Dashboard?
It is a Power BI dashboard that tracks the performance of organic farming activities using KPIs like crop health, irrigation efficiency, production, and cost.
2. How many pages does the dashboard have?
The dashboard has three pages: Summary Page, KPI Trend Page, and KPI Definition Page.
3. What type of data does the dashboard use?
The dashboard uses three Excel sheets: Input Actual, Input Target, and KPI Definition.
4. Can I track both MTD and YTD values?
Yes, the dashboard tracks both Month-to-Date (MTD) and Year-to-Date (YTD) values.
5. Can I add new KPIs to this dashboard?
Yes, you can add new KPIs by updating the Excel data file.
6. Does the dashboard show comparisons with the previous year?
Yes, it compares CY MTD/YTD with PY MTD/YTD.
7. Can beginners use this dashboard?
Yes, the dashboard has a very simple and clean layout. Even beginners can use it easily.
Click to Purchases Organic Farming KPI Dashboard in Power BI
Visit our YouTube channel to learn step-by-step video tutorials