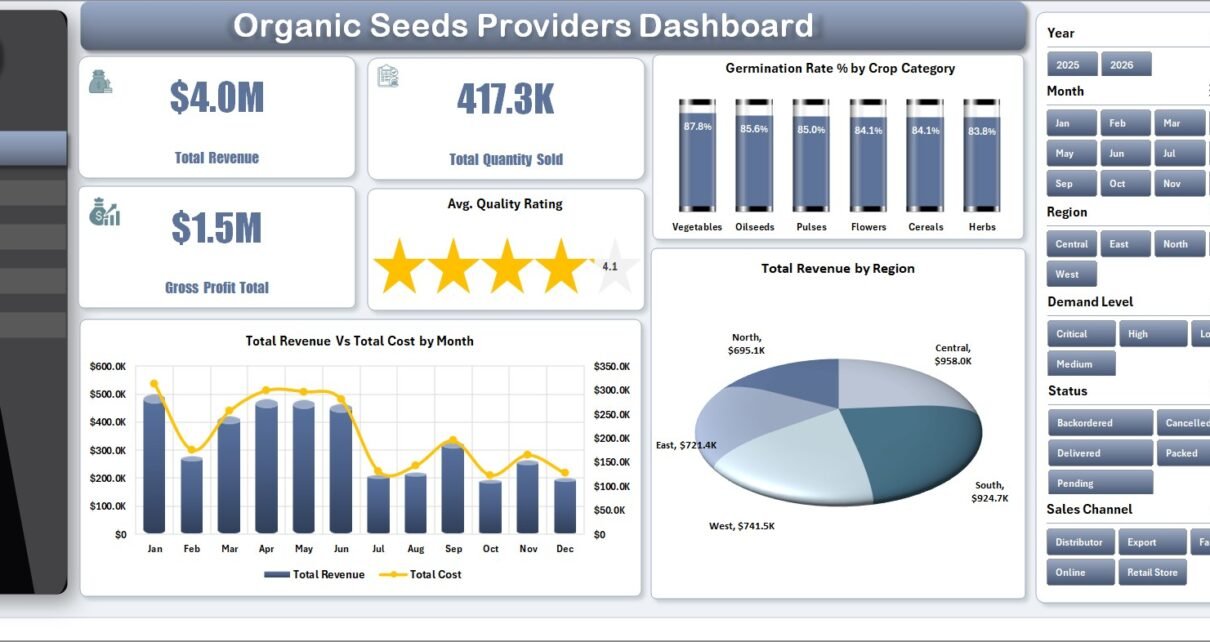
Organic Seeds Providers Dashboard in Excel helps organic seed suppliers, distributors, procurement managers, sales leaders, and agribusiness analysts turn provider, product, quality, channel, and fulfillment records into a clear Excel dashboard. Seed businesses often track 100+ order rows across crop category, seed variety, certification, provider, country, region, sales channel, demand level, and status. Without a reporting layer, it becomes difficult to answer basic management questions quickly: Which crop category has the best germination rate? Which provider has the highest rejection rate? Which region brings the most revenue? Which certification contributes the strongest margin?
This ready-to-use Excel dashboard includes 5 analysis pages, 4 KPI cards, slicers, charts, a structured Data sheet, and a pivot-backed Support sheet. Users can replace the sample records, click Refresh All from the Excel Data ribbon, and review the updated dashboard without building charts from scratch. For general Microsoft guidance on refreshing data and pivots, see Microsoft Support on refreshing PivotTable data. You can view the product here: Organic Seeds Providers Dashboard in Excel.
Organic Seeds Providers Dashboard in Excel
Key Features of Organic Seeds Providers Dashboard in Excel
- 5 dashboard pages: Overview, Provider, Product Mix, Channels, and Fulfillment.
- 4 KPI cards: Total Revenue, Total Quantity Sold, Gross Profit Total, and Avg. Quality Rating.
- Quality analytics: Germination rate, rejection rate, rejected seeds, certification, crop category, and seed variety views.
- Provider review: Lead time by country, revenue versus cost by provider, and order count by status.
- Product mix insights: Revenue by crop category, germination by variety, rejected seeds by demand level, and gross margin by certification.
- Channel reporting: Revenue by sales channel, quantity sold by customer segment, germination by region, and rejection by country.
- Fulfillment tracking: Lead time, provider rejection rate, and monthly gross profit analysis.
- Refreshable Excel structure: Update the Data sheet and refresh pivots to update cards, slicers, and charts.
Dashboard Pages Explanation
1. Overview Page
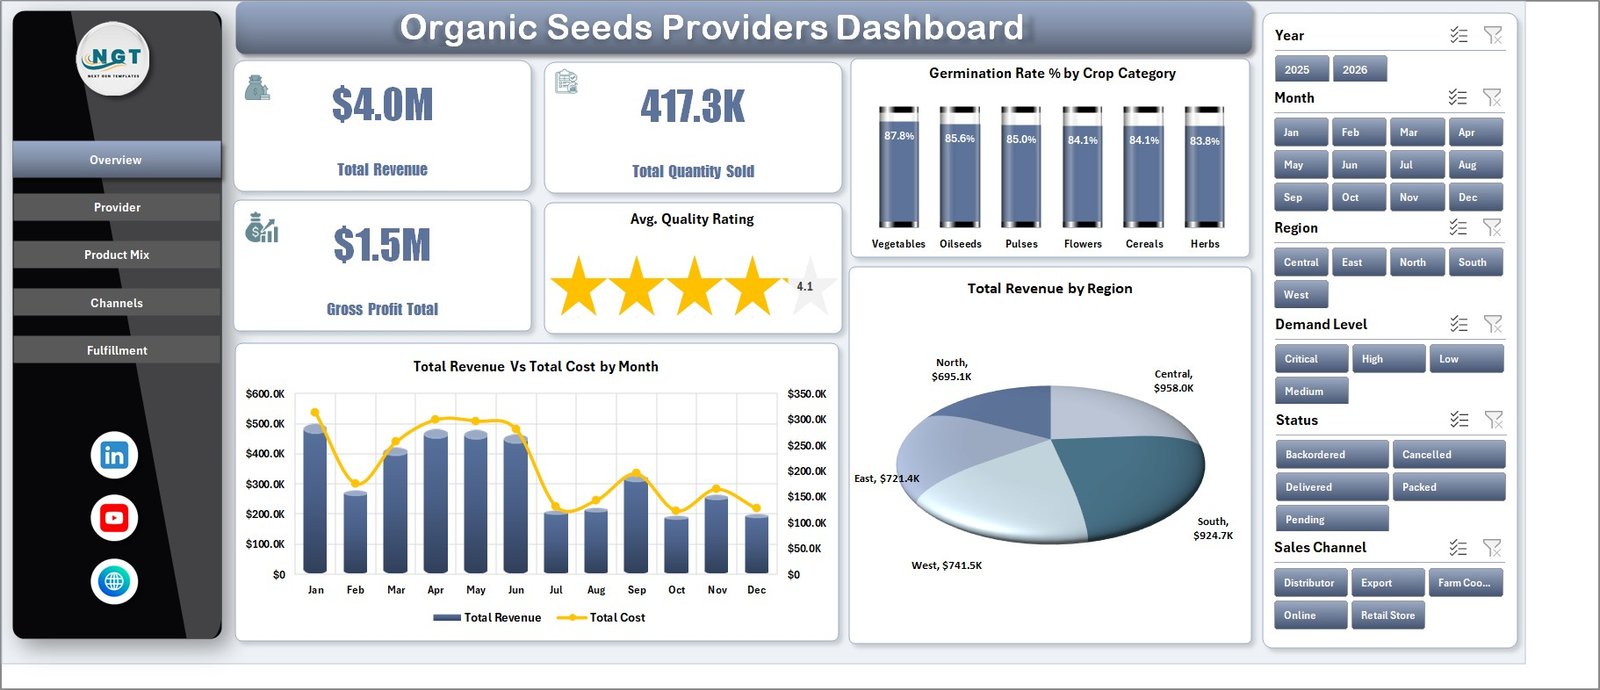
The Overview page works as the executive summary of the workbook. The top cards show Total Revenue, Total Quantity Sold, Gross Profit Total, and Avg. Quality Rating, giving leaders a quick view of sales scale, product movement, profit, and seed quality before moving into detailed tabs.
Germination Rate % by Crop Category: This chart compares germination performance across crop categories. It helps quality teams see which seed groups are producing stronger viable-seed results.
Total Revenue Vs Total Cost by Month: This chart compares monthly revenue with monthly cost. It helps managers see whether sales growth is translating into healthier profitability or being reduced by rising cost.
Total Revenue by Region: This visual shows revenue contribution by region. It helps sales teams identify markets that are driving stronger organic seed demand.
Overview Page
2. Provider
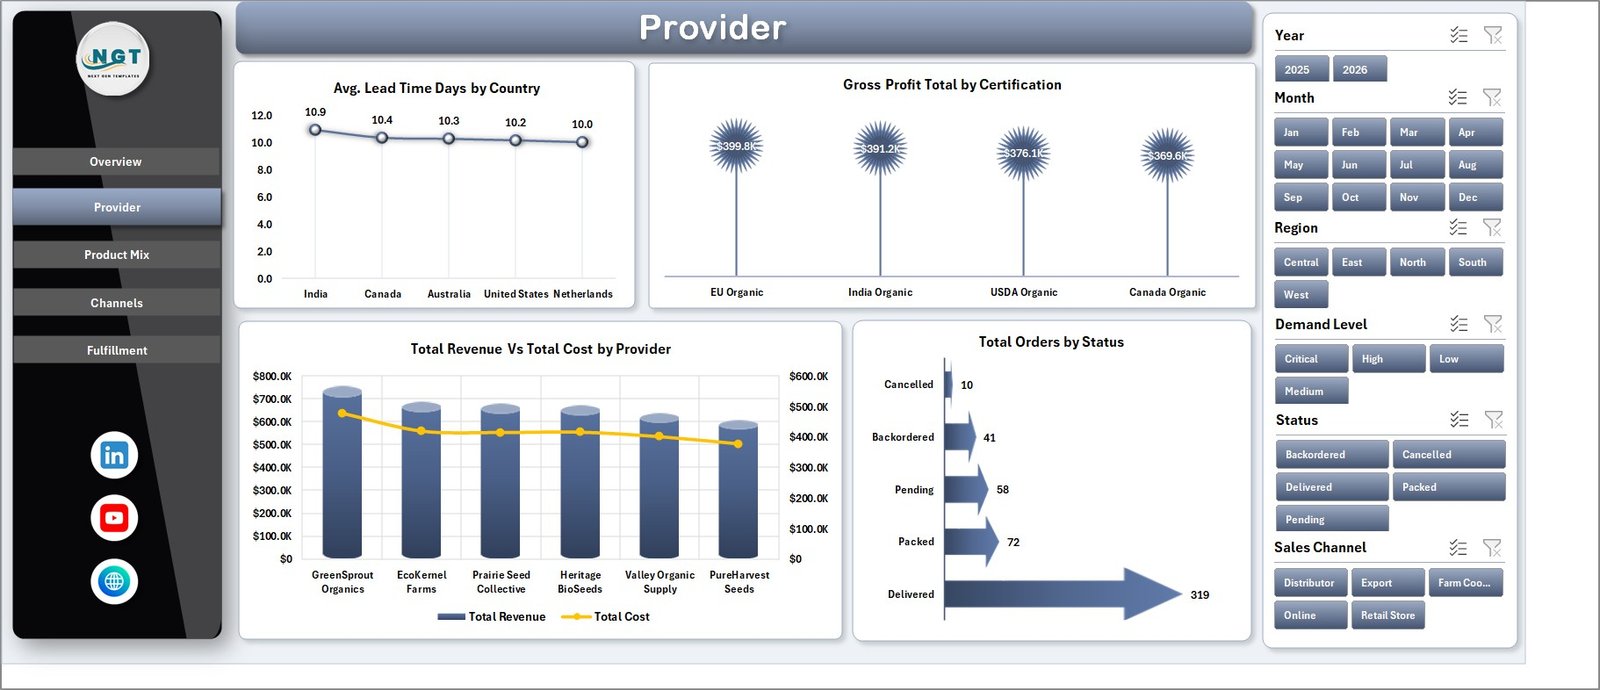
The Provider page focuses on suppliers, countries, certifications, and order movement. Avg. Lead Time Days by Country highlights geography-level fulfillment speed, helping procurement teams understand where delivery timing may need attention.
Gross Profit Total by Certification shows which certification types contribute more profit. Total Revenue Vs Total Cost by Provider compares provider economics, while Total Orders by Status helps teams review pending, completed, delayed, or cancelled order volumes.
Provider
3. Product Mix
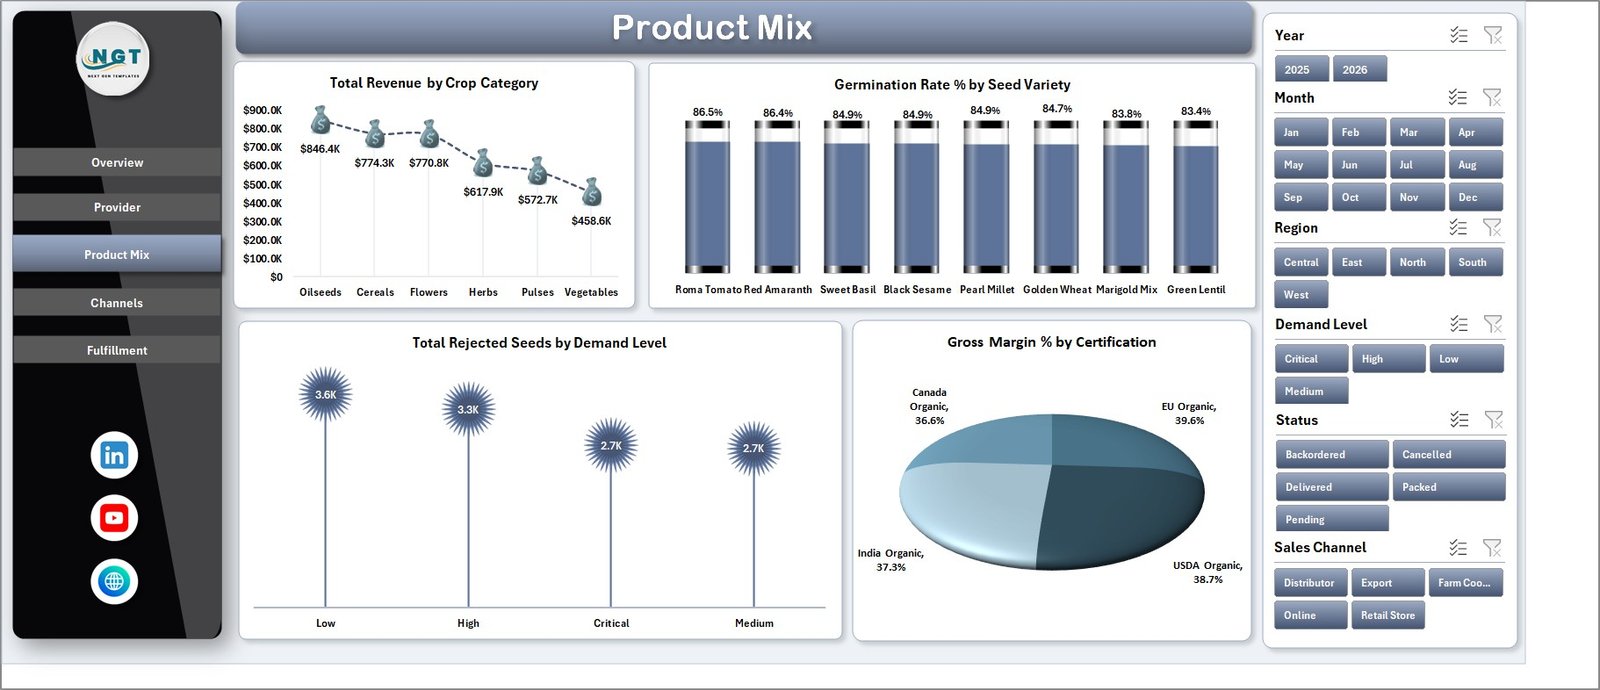
The Product Mix page explains how crop categories, seed varieties, demand levels, and certifications contribute to sales and quality outcomes. Total Revenue by Crop Category identifies the seed groups that generate the most revenue.
Germination Rate % by Seed Variety compares quality by variety. Total Rejected Seeds by Demand Level helps teams identify whether high-demand items also create quality loss, and Gross Margin % by Certification compares profitability by certification class.
Product Mix
4. Channels
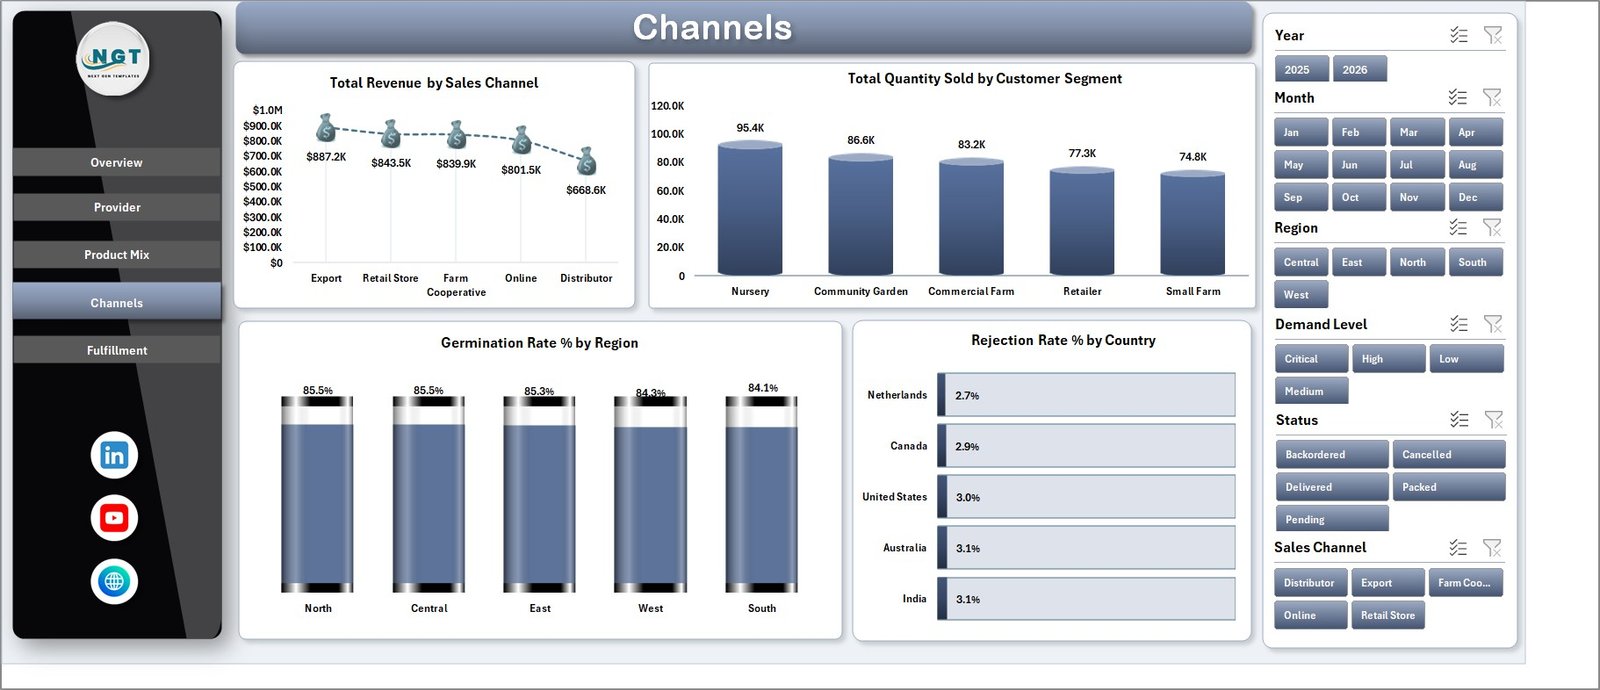
The Channels page is useful for sales and market review. Total Revenue by Sales Channel compares performance across channels such as wholesale, retail, direct, marketplace, or distributor-led sales depending on the user’s data.
Total Quantity Sold by Customer Segment shows which buyer groups are driving seed movement. Germination Rate % by Region and Rejection Rate % by Country connect commercial channels with quality outcomes so users can review both demand and performance.
Channels
5. Fulfillment
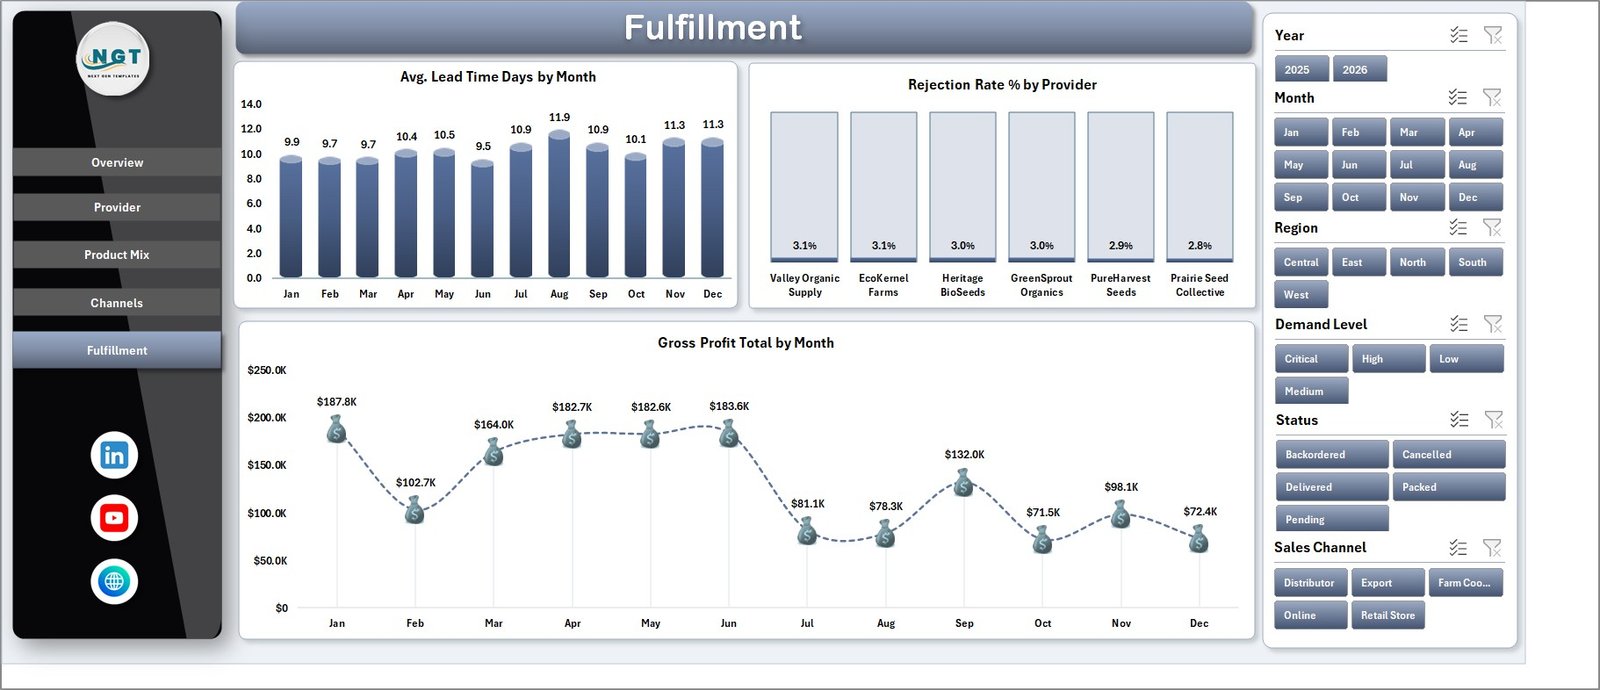
The Fulfillment page gives operations teams a focused view of speed, quality, and profit over time. Avg. Lead Time Days by Month helps detect whether fulfillment is improving or slowing as the year progresses.
Rejection Rate % by Provider highlights providers that may need quality review, packaging checks, or process follow-up. Gross Profit Total by Month shows whether monthly operations are creating consistent financial results.
Fulfillment
6. Data Sheet Tab
The Data sheet is the input layer. Users should add records in the same structure as the sample data so the dashboard formulas, pivots, slicers, and charts continue to refresh correctly. This makes the workbook easier to maintain month after month.

Data Sheet tab
7. Support Sheet
The Support sheet contains pivot tables used to create the dashboard dynamically. After updating the Data sheet, go to the Data tab in the Excel ribbon and click Refresh All. The pivots and charts refresh together, and the Support sheet can be hidden from normal dashboard users.

Support sheet tab
Organic Seeds Providers Dashboard in Excel vs. Google Sheets vs. Paid CRM/SaaS – Feature Comparison
| Feature | Organic Seeds Providers Dashboard in Excel | Google Sheets alternative | Paid farm SaaS |
|---|---|---|---|
| Cost | $17.99 one-time template | Low software cost, but dashboard build is manual | Monthly or annual subscription |
| Platform | Microsoft Excel | Browser spreadsheet | Vendor cloud platform |
| Setup time | Replace data and refresh | Build formulas, pivots, charts, and slicers | Implementation and onboarding |
| Real-time team collaboration | Possible through OneDrive or SharePoint | Native collaboration | Usually included by plan |
| Mobile access | Limited depending on workbook features | Available in browser or mobile app | Usually included |
| Customizable fields | Edit workbook, data columns, pivots, and charts | Editable but manually maintained | Limited by vendor settings |
| Share with link | Possible with cloud storage permissions | Built in | Usually login controlled |
| Year-1 cost at 5 users | $17.99 plus any Microsoft licensing | Low license cost plus build time | Often hundreds or thousands |
| Seed provider metrics | Revenue, cost, quantity, profit, germination, rejection, lead time, certification, channel, and status | Must be designed manually | Depends on vendor module |
Who Should Use This Template
This template is built for organic seed providers, seed distributors, agribusiness sales teams, seed procurement managers, farm supply companies, quality teams, fulfillment coordinators, channel managers, and consultants who already use Excel for regular business reporting.
It is especially useful when a team wants to review sales, provider performance, seed quality, product mix, fulfillment, and channels from one workbook. It is not designed to replace a live ERP, inventory system, certification filing platform, barcode system, lab testing database, CRM automation tool, or farm IoT platform.
Real-World Use Cases
Anika, seed provider owner: Anika opens the Overview page before monthly planning meetings to review revenue, quantity sold, gross profit, and average quality rating.
Rohan, procurement manager: Rohan uses the Provider and Fulfillment pages to compare lead time by country and rejection rate by provider, then follows up with suppliers that need process review.
Meera, agribusiness consultant: Meera uses Product Mix and Channels pages to explain which crop categories, varieties, certifications, customer segments, and regions are driving results for her client.
Advantages of Organic Seeds Providers Dashboard in Excel
- Faster monthly reporting: Start from a ready dashboard instead of building charts manually.
- Clear provider visibility: Review lead time, order status, provider revenue, provider cost, and rejection rate.
- Quality and revenue together: Analyze germination and rejection alongside revenue, cost, margin, and quantity.
- Product mix clarity: See which crop categories, seed varieties, and certifications deserve more attention.
- Excel flexibility: Customize labels, colors, formulas, pivots, and layouts as the business process changes.
Opportunities for Improvement
Advanced users can extend the workbook with additional fields for seed batch ID, supplier lot, lab test date, packaging type, inventory level, customer location, season, expected harvest window, or complaint status. Teams with more mature data systems can also connect cleaned exports from ERP, CRM, or inventory tools into the Data sheet structure before refreshing the pivots.
Best Practices
- Keep provider names, country names, crop categories, seed varieties, certifications, demand levels, and status values consistent.
- Use one row per order, shipment, product transaction, or reporting record depending on your source data design.
- Review germination rate and rejection rate together so quality issues are not hidden behind revenue growth.
- Refresh the workbook after every Data sheet update.
- Keep the Support sheet protected or hidden for end users who only need the dashboard pages.
- Review Provider and Fulfillment pages together before supplier performance meetings.
Explore Relevant Templates
You can purchase the Organic Seeds Providers Dashboard in Excel from NextGenTemplates. You may also want to review the Indoor Farming Systems Dashboard in Excel, Indoor Farming Systems Dashboard in Power BI, and the full Excel Dashboard Templates category.
Frequently Asked Questions
What is the Organic Seeds Providers Dashboard in Excel?
It is an Excel dashboard template for tracking organic seed provider revenue, cost, quantity sold, gross profit, quality rating, germination rate, rejection rate, provider performance, product mix, channels, and fulfillment.
What pages are included?
The workbook includes Overview, Provider, Product Mix, Channels, Fulfillment, Data sheet, and Support sheet tabs.
Can I add my own data?
Yes. Replace the sample records in the Data sheet using the same column format, then click Refresh All from the Excel Data ribbon.
Do I need advanced Excel skills?
No. The main workflow is data replacement and refresh. Advanced users can customize pivots, charts, formulas, slicers, and workbook design.
Can the Support sheet be hidden?
Yes. The Support sheet contains pivot tables used by the dashboard and can be hidden after setup.
Is this a full seed inventory system?
No. It is a reporting dashboard for prepared Excel data. It does not replace inventory sync, certification filing, ERP, CRM automation, or compliance systems.
About the Author
Built by PK – Microsoft Certified Professional with 15+ years of Excel, Google Sheets, and Power BI experience. Founder of NextGenTemplates, reaching 300K+ subscribers across YouTube channels. Every template is hand-built and tested before release.
Conclusion
The Organic Seeds Providers Dashboard in Excel gives seed providers and agribusiness teams a practical way to review revenue, cost, quantity, profit, quality, germination, rejection, provider lead time, certifications, sales channels, customer segments, regions, and fulfillment performance in one workbook. It is a strong starting point for teams that want faster Excel reporting before investing in larger custom systems.
Visit our YouTube channel for step-by-step Excel and dashboard tutorials: Youtube.com/@PKAnExcelExpert.
Click here to purchase Organic Seeds Providers Dashboard in Excel