In today’s healthcare industry, orthopedic centers must manage patient care, surgical outcomes, and operational efficiency with precision. However, many organizations still rely on manual reporting and scattered data sources. As a result, decision-making becomes slow and less effective.
Therefore, healthcare providers now adopt smart analytics tools to improve performance. One of the most powerful solutions is the Orthopedic Centers KPI Dashboard in Power BI. This dashboard provides a centralized platform to monitor key performance indicators (KPIs), track trends, and compare performance against targets.
In this detailed guide, you will learn everything about this dashboard, including its features, structure, advantages, best practices, and FAQs.
Click to Purchases Orthopedic Centers KPI Dashboard in Power BI
What is an Orthopedic Centers KPI Dashboard in Power BI?
An Orthopedic Centers KPI Dashboard in Power BI is an interactive reporting tool designed to track and analyze the performance of orthopedic departments.
Instead of reviewing multiple Excel sheets, users can view all important KPIs in one place. Moreover, the dashboard connects with Excel data, which makes updates simple and efficient.
With this dashboard, healthcare professionals can:
-
Monitor clinical and operational KPIs
-
Compare actual performance with targets
-
Analyze Month-to-Date (MTD) and Year-to-Date (YTD) metrics
-
Evaluate performance against previous year data
As a result, decision-makers gain clear insights and take faster actions.
Why Do Orthopedic Centers Need KPI Dashboards?
Orthopedic centers handle surgeries, rehabilitation, and patient care daily. Therefore, tracking performance manually becomes challenging.
However, a KPI dashboard simplifies this process.
Key Reasons to Use KPI Dashboards:
-
Improve patient care quality
-
Increase operational efficiency
-
Reduce manual errors
-
Enable faster and smarter decisions
In addition, Power BI dashboards provide interactive visuals, which make data easy to understand.
Key Features of Orthopedic Centers KPI Dashboard in Power BI
This dashboard includes three well-structured pages. Each page serves a specific purpose and enhances data analysis.
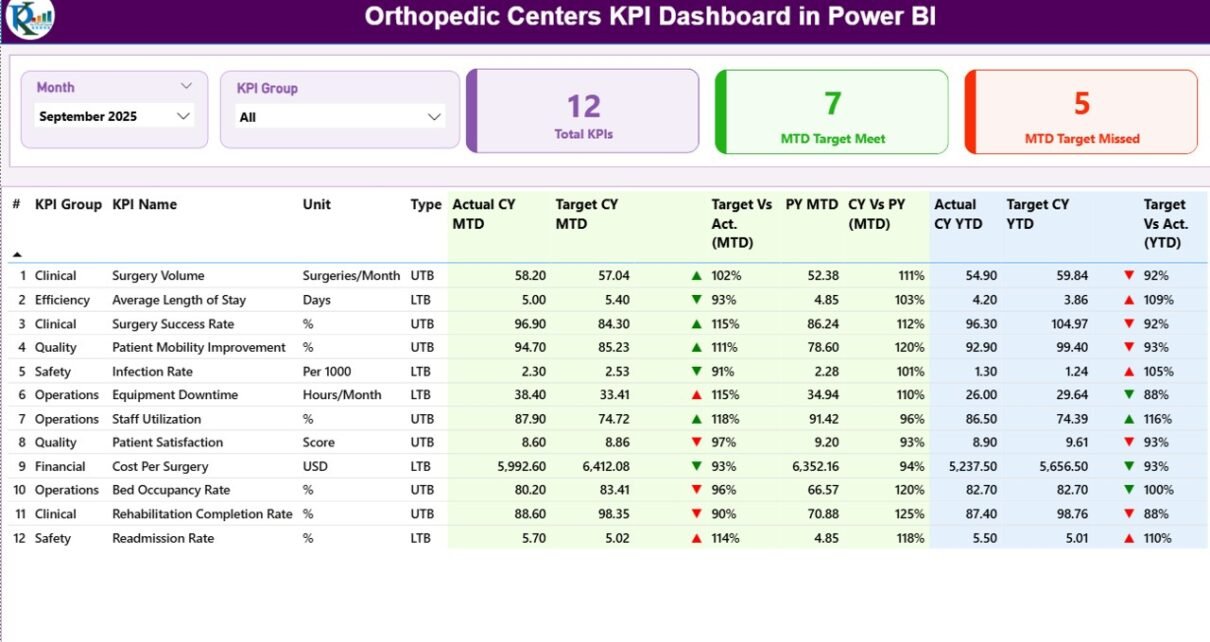
1. Summary Page – Complete KPI Overview
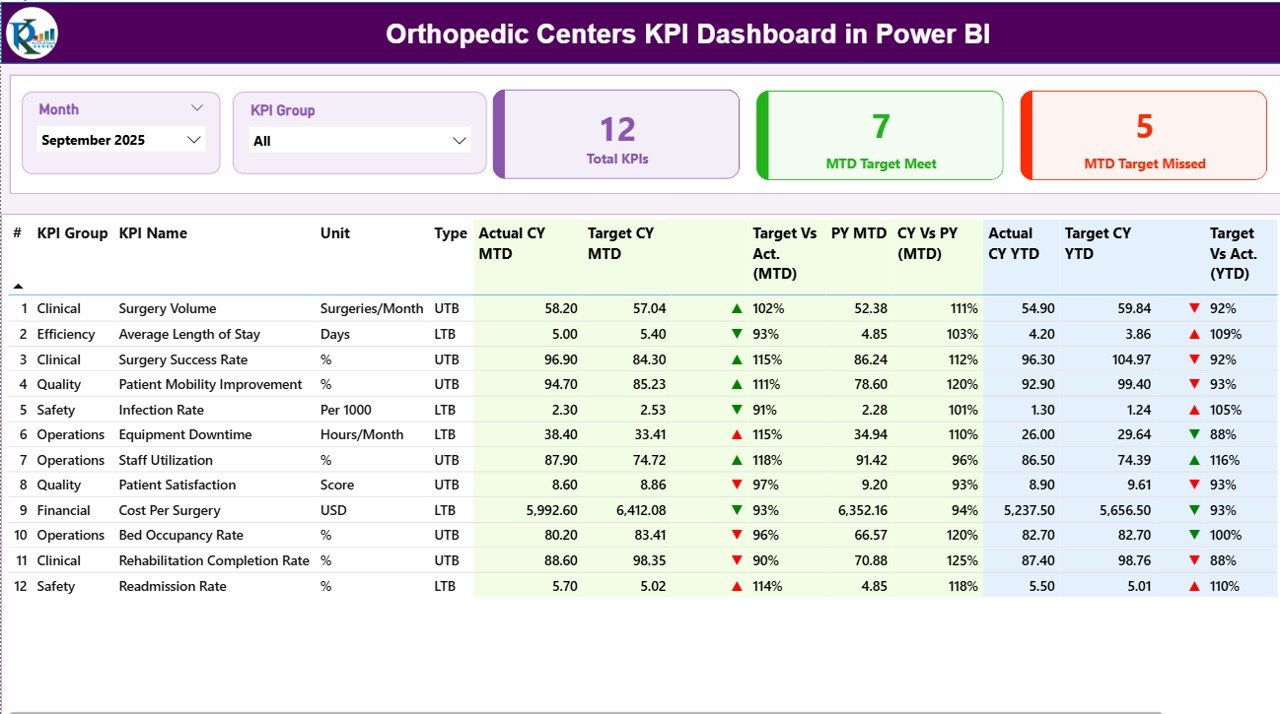
The Summary Page acts as the main dashboard view. It provides a complete snapshot of all KPIs.
🔹 Top-Level Filters
-
Month Slicer – Select any month to update the dashboard
-
KPI Group Slicer – Filter KPIs by category
🔹 KPI Cards
The dashboard displays three key cards:
-
Total KPIs Count
-
MTD Target Met Count
-
MTD Target Missed Count
These cards give instant performance insights.
Click to Purchases Orthopedic Centers KPI Dashboard in Power BI
🔹 Detailed KPI Table
The table provides detailed KPI-level information:
-
KPI Number – Unique sequence number
-
KPI Group – Category of KPI
-
KPI Name – Name of the KPI
-
Unit – Measurement unit
-
Type (LTB/UTB) – Lower the Better or Upper the Better
🔹 MTD Performance Metrics
The dashboard includes:
-
Actual CY MTD
-
Target CY MTD
-
Target vs Actual (MTD %)
-
Previous Year MTD
-
CY vs PY (MTD %)
-
Performance indicators (▲ ▼ with colors)
These metrics help users evaluate monthly performance.
🔹 YTD Performance Metrics
Similarly, the dashboard shows:
-
Actual CY YTD
-
Target CY YTD
-
Target vs Actual (YTD %)
-
Previous Year YTD
-
CY vs PY (YTD %)
-
KPI performance icons
Because of this structure, users can easily compare long-term performance.
2. KPI Trend Page – Performance Visualization
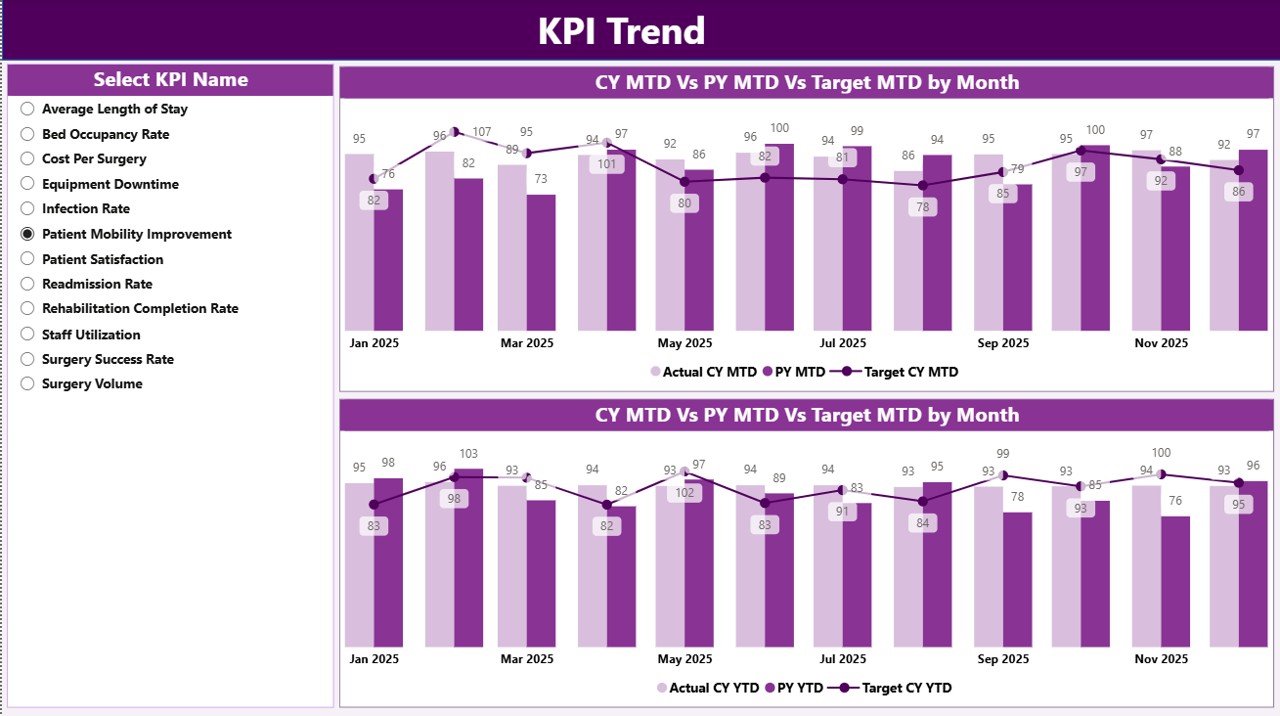
The KPI Trend Page provides graphical insights into KPI performance.
🔹 Key Features:
-
Two combo charts for MTD and YTD
-
Displays Actual, Target, and Previous Year values
-
KPI Name slicer for dynamic selection
With this page, users can:
-
Identify performance trends
-
Compare historical data
-
Detect growth or decline
Therefore, it supports better planning and forecasting.
Click to Purchases Orthopedic Centers KPI Dashboard in Power BI
3. KPI Definition Page – Detailed KPI Insights
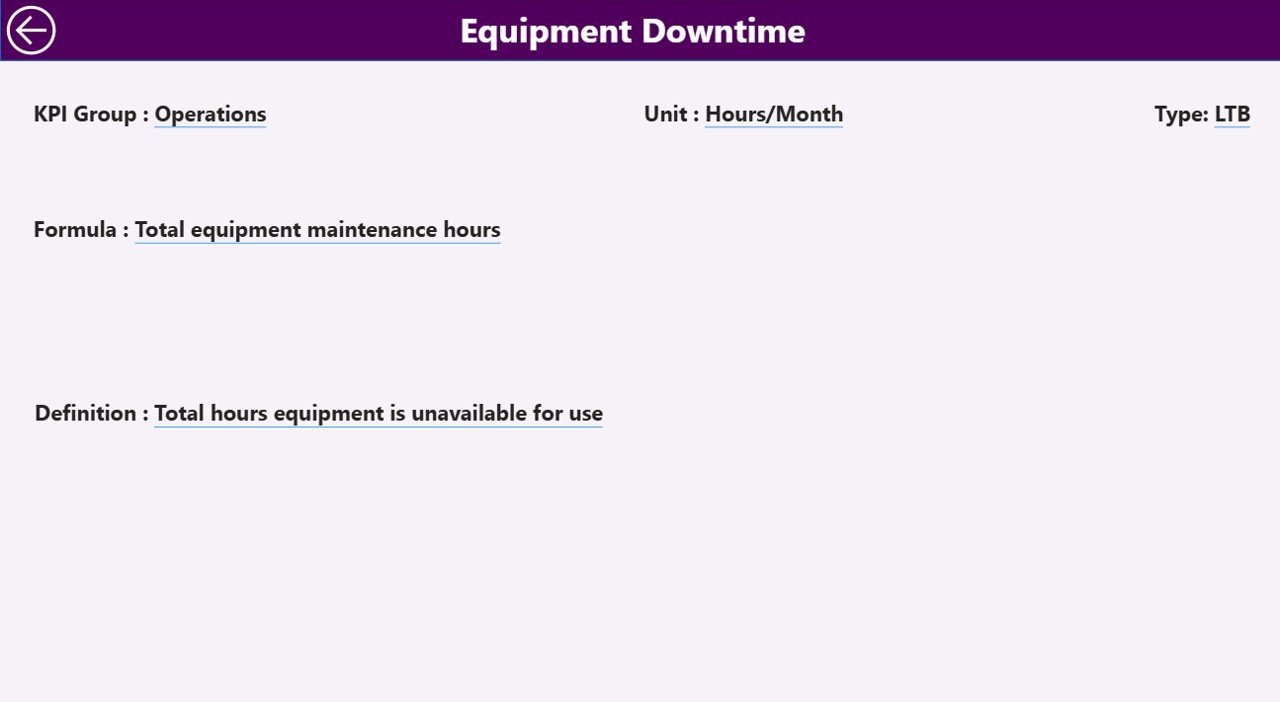
This page works as a drill-through feature.
🔹 What You Can Analyze:
-
KPI Formula
-
KPI Definition
-
KPI Type
Users can navigate from the Summary Page to this page for detailed KPI understanding. After reviewing, they can return using the back button.
As a result, the dashboard ensures both high-level and detailed analysis.
Excel Data Structure for the Dashboard
The dashboard uses an Excel file as its data source. This makes data entry simple and flexible.
📊 Required Worksheets
1. Input_Actual Sheet
In this sheet, users must enter:
-
KPI Name
-
Month (first date of the month)
-
MTD values
-
YTD values
2. Input_Target Sheet
Here, users must enter:
-
KPI Name
-
Month
-
Target MTD values
-
Target YTD values
3. KPI Definition Sheet
This sheet includes:
-
KPI Number
-
KPI Group
-
KPI Name
-
Unit
-
Formula
-
Definition
-
Type (LTB or UTB)
Because of this structured format, users can easily maintain and update the dashboard.
Advantages of Orthopedic Centers KPI Dashboard in Power BI
Using this dashboard provides several powerful benefits.
🚀 Better Decision-Making
Managers can analyze real-time data and take quick actions. Therefore, they can improve operational efficiency.
📊 Centralized Data View
All KPIs are available in one dashboard. As a result, users do not need multiple reports.
⏱ Time-Saving Reporting
The dashboard updates automatically when data changes. Hence, it reduces manual effort.
📈 Improved Performance Tracking
Users can compare:
-
Actual vs Target
-
Current Year vs Previous Year
Therefore, they can quickly identify performance gaps.
🔍 Easy Data Visualization
Charts, icons, and colors make data easy to understand. So, even non-technical users can analyze insights.
Click to Purchases Orthopedic Centers KPI Dashboard in Power BI
How to Use the Orthopedic KPI Dashboard in Power BI?
To use the dashboard effectively, follow these steps:
Step 1: Prepare Excel Data
-
Enter accurate data in all sheets
-
Maintain consistent formats
Step 2: Load Data into Power BI
-
Connect the Excel file
-
Refresh the data
Step 3: Apply Filters
-
Select Month
-
Choose KPI Group
Step 4: Analyze KPI Performance
-
Review KPI cards
-
Check detailed table
Step 5: Track Trends
-
Use KPI Trend Page
-
Compare historical data
By following these steps, users can maximize dashboard efficiency.
Best Practices for the Orthopedic Centers KPI Dashboard in Power BI
To get the best results, follow these best practices:
✅ Use Accurate Data
Always verify data before uploading. Incorrect data leads to wrong insights.
✅ Update Data Regularly
Keep data updated to ensure accurate reporting.
✅ Define KPIs Clearly
Each KPI must have a clear definition and formula.
✅ Group KPIs Properly
Organize KPIs into logical categories such as clinical, operational, and financial.
✅ Monitor Both MTD and YTD
Track both short-term and long-term performance.
✅ Train Your Team
Ensure that users understand how to use the dashboard effectively.
Common KPIs for Orthopedic Centers
To build a strong dashboard, include relevant KPIs.
🏥 Clinical KPIs
-
Surgery Success Rate
-
Infection Rate
-
Patient Recovery Time
⚙️ Operational KPIs
-
Bed Occupancy Rate
-
Average Length of Stay
-
Appointment Turnaround Time
💰 Financial KPIs
-
Revenue per Patient
-
Cost per Surgery
-
Profit Margin
These KPIs provide a complete performance overview.
Challenges Without a KPI Dashboard
Without a proper dashboard, organizations face several issues:
-
Delayed reporting
-
Data inconsistency
-
Limited visibility
-
Poor decision-making
However, using Power BI solves these problems effectively.
Future of Orthopedic Analytics with Power BI
Click to Purchases Orthopedic Centers KPI Dashboard in Power BI
Healthcare analytics continues to evolve. Power BI plays a major role in this transformation.
In the future, orthopedic centers will:
-
Use predictive analytics
-
Integrate AI-based insights
-
Automate reporting
Therefore, adopting dashboards today ensures future readiness.
Conclusion
The Orthopedic Centers KPI Dashboard in Power BI is a powerful solution for healthcare performance tracking. It provides clear insights, improves decision-making, and enhances operational efficiency.
Moreover, its Excel integration and interactive visuals make it easy to use. Therefore, healthcare organizations can quickly adopt this dashboard.
If you want to improve performance and gain better insights, this dashboard is the perfect choice.
Frequently Asked Questions (FAQs)
What is an Orthopedic KPI Dashboard?
An Orthopedic KPI Dashboard is a tool that tracks and analyzes key performance indicators related to orthopedic services.
Can beginners use this dashboard?
Yes, beginners can easily use it because of its simple design and Excel integration.
What is MTD and YTD in this dashboard?
-
MTD (Month-to-Date) shows performance for the current month
-
YTD (Year-to-Date) shows performance from the start of the year
How often should I update the data?
You should update data regularly, preferably monthly.
Can I customize KPIs?
Yes, you can modify KPIs based on your organization’s requirements.
Does this dashboard support real-time data?
Yes, Power BI supports real-time data if connected to live sources.
What is the use of the KPI Definition Page?
It provides detailed information such as KPI formula and definition.
Is Power BI better than Excel for dashboards?
Power BI offers better visualization and interactivity, while Excel works well for data storage.
Visit our YouTube channel to learn step-by-step video tutorials