Retail businesses operate in a fast-moving and highly competitive environment. Outlet stores especially face constant pressure to increase sales, manage operational costs, and understand customer behavior across multiple locations. Therefore, managers need accurate insights to make quick decisions. However, many businesses still depend on manual reports and disconnected spreadsheets, which often create confusion instead of clarity.
To solve this challenge, businesses increasingly adopt smart analytical tools. One of the most practical and powerful solutions is the Outlet Stores Dashboard in Excel — a ready-to-use system designed to transform raw retail data into meaningful business insights.
In this comprehensive guide, you will learn everything about the Outlet Stores Dashboard in Excel, including its structure, features, advantages, best practices, and implementation strategies. Moreover, this article explains how retailers can use Excel dashboards to improve performance and profitability.
Click to Purchases Outlet Stores Dashboard in Excel
What Is an Outlet Stores Dashboard in Excel?
An Outlet Stores Dashboard in Excel is an interactive reporting and analytics tool that helps retail businesses monitor sales, profitability, targets, and operational performance across multiple outlet locations.
Instead of reviewing multiple reports separately, users analyze all important KPIs in one centralized dashboard. As a result, decision-making becomes faster and more accurate.
This dashboard allows businesses to:
-
Track sales performance across outlets
-
Compare regions and product categories
-
Monitor profit margins
-
Analyze monthly trends
-
Evaluate store manager performance
-
Measure targets versus actual results
Because Excel provides dynamic visuals and filtering options, users quickly explore data from different perspectives.
Why Do Outlet Stores Need a Dashboard?
Retail operations generate large volumes of data daily. However, without structured analysis, data alone does not help business growth.
Common Challenges Retailers Face
-
Difficulty tracking multiple store performances
-
Lack of real-time profitability insights
-
Manual sales reporting errors
-
Slow decision-making processes
-
Poor visibility into regional performance
-
Inconsistent target monitoring
Therefore, a dashboard becomes essential rather than optional.
An Excel dashboard organizes data visually so managers instantly understand what works and what needs improvement.
Key Features of the Outlet Stores Dashboard in Excel
This ready-to-use dashboard includes a structured and user-friendly design. Additionally, it provides powerful analytics across multiple pages.
Page Navigator
The dashboard includes a Page Navigator located on the left side. This feature allows users to switch between analytical pages quickly. Consequently, navigation becomes smooth and efficient.
How Is the Dashboard Structured?
The Excel file contains five analytical pages, each designed to answer specific business questions.
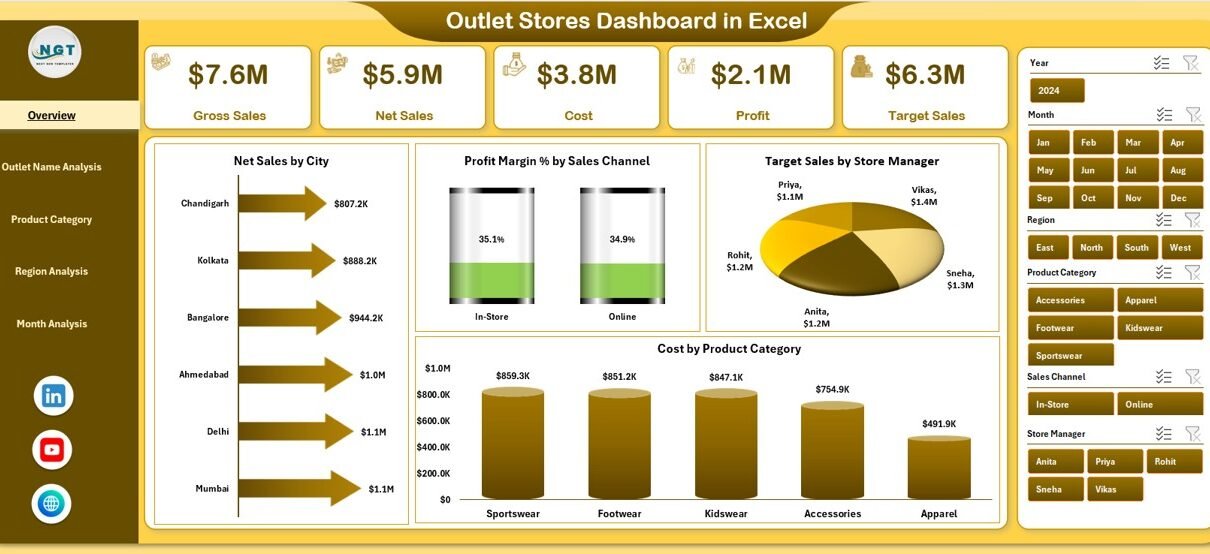
1️⃣ Overview Page – What Is Happening Across All Stores?
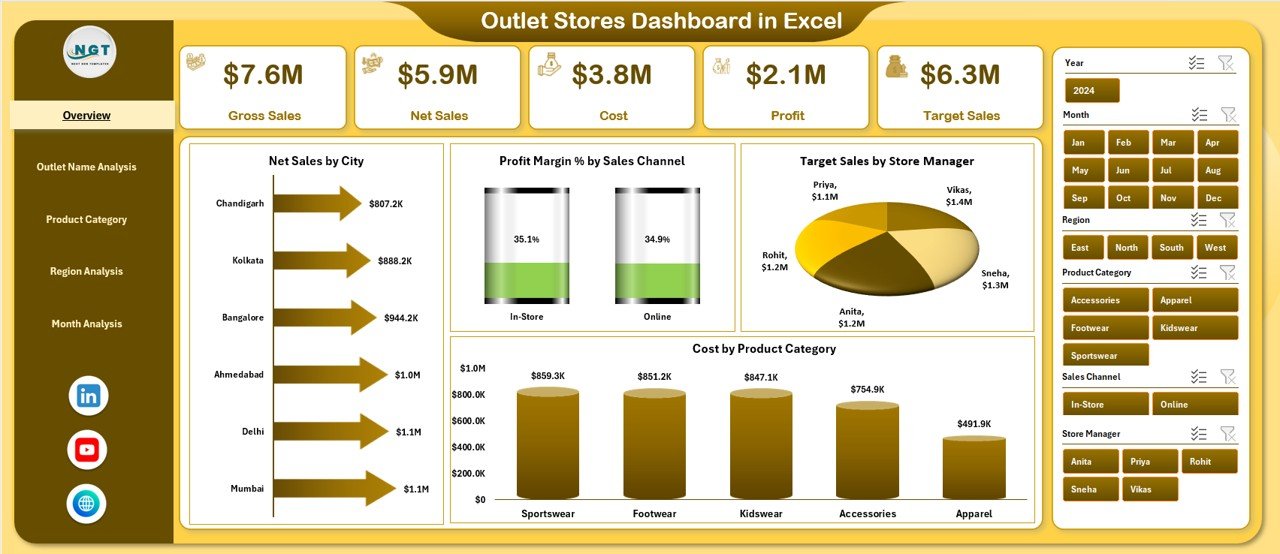
The Overview Page acts as the central control panel of the dashboard.
Key Elements
-
Right-side slicers for filtering data
-
KPI summary cards
-
Interactive charts
Charts Included
-
Net Sales by City
-
Profit Margin % by Sales Channel
-
Target Sales by Store Manager
-
Cost by Product Category
This page provides a high-level business summary. Therefore, executives quickly understand overall performance without diving into detailed reports.
2️⃣ Outlet Name Analysis – Which Store Performs Best?
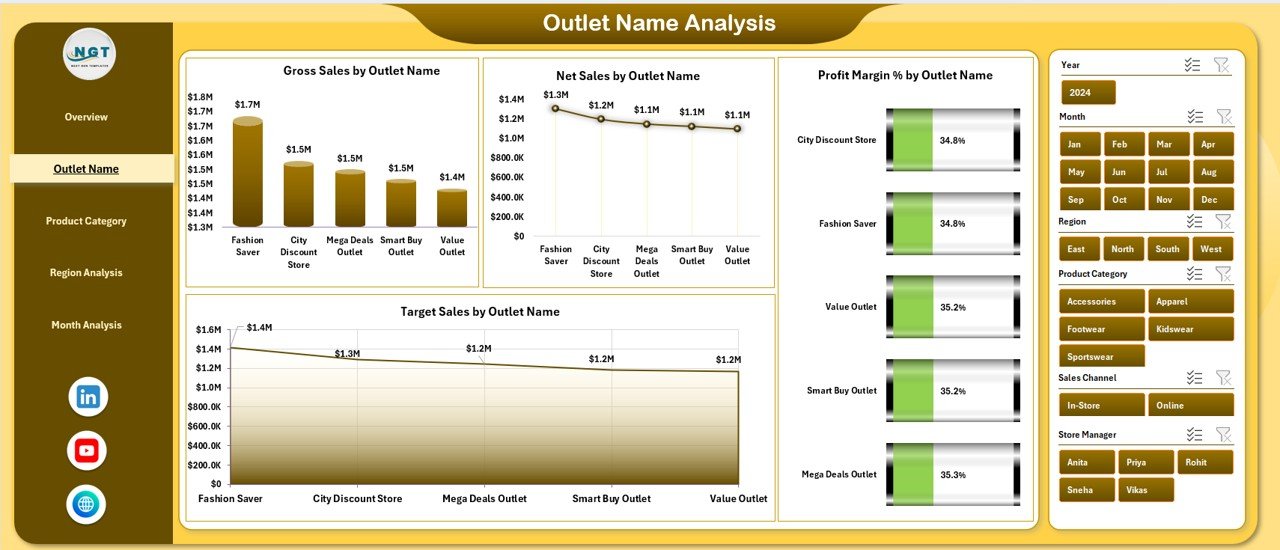
Retail managers often need store-level insights. The Outlet Name Analysis page focuses entirely on outlet performance comparison.
Charts Available
-
Gross Sales by Outlet Name
-
Net Sales by Outlet Name
-
Profit Margin % by Outlet Name
-
Target Sales by Outlet Name
Because this page highlights individual store metrics, businesses easily identify:
-
Top-performing outlets
-
Underperforming locations
-
Profitability gaps
-
Target achievement levels
As a result, management can take corrective actions faster.
Click to Purchases Outlet Stores Dashboard in Excel
3️⃣ Product Category Analysis – Which Products Drive Profit?
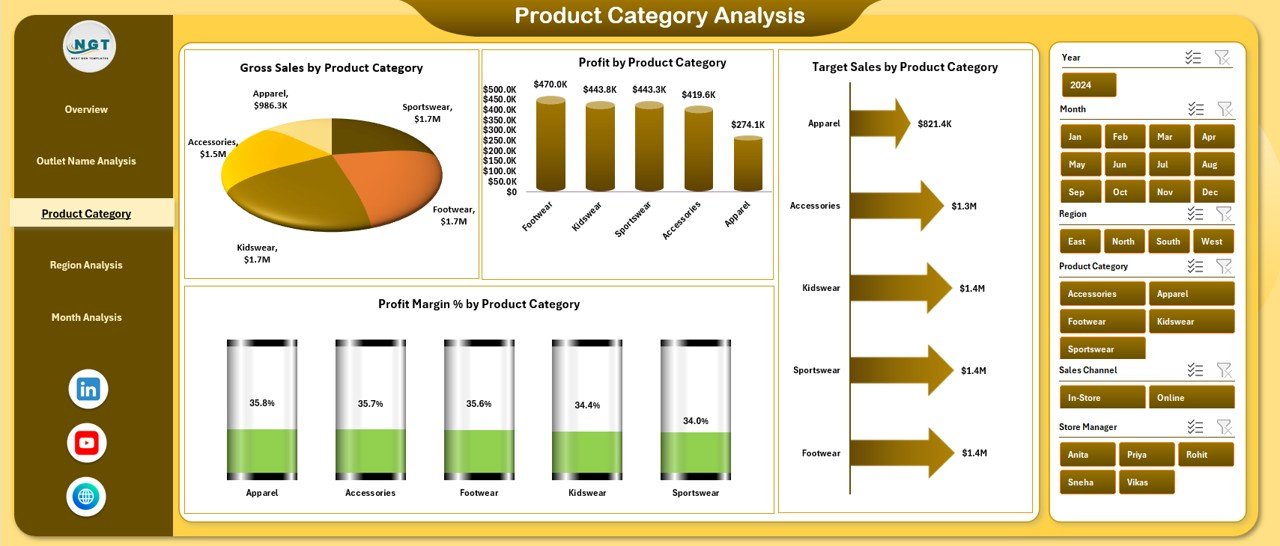
Product performance directly impacts revenue and profitability. Therefore, analyzing categories becomes essential.
Visuals Included
-
Gross Sales by Product Category
-
Target Sales by Product Category
-
Profit Margin % by Product Category
-
Profit by Product Category
This analysis helps retailers:
-
Identify best-selling categories
-
Optimize inventory decisions
-
Improve pricing strategies
-
Reduce low-margin products
Consequently, businesses maximize profit while minimizing unnecessary costs.
4️⃣ Region Analysis – Where Does Revenue Come From?
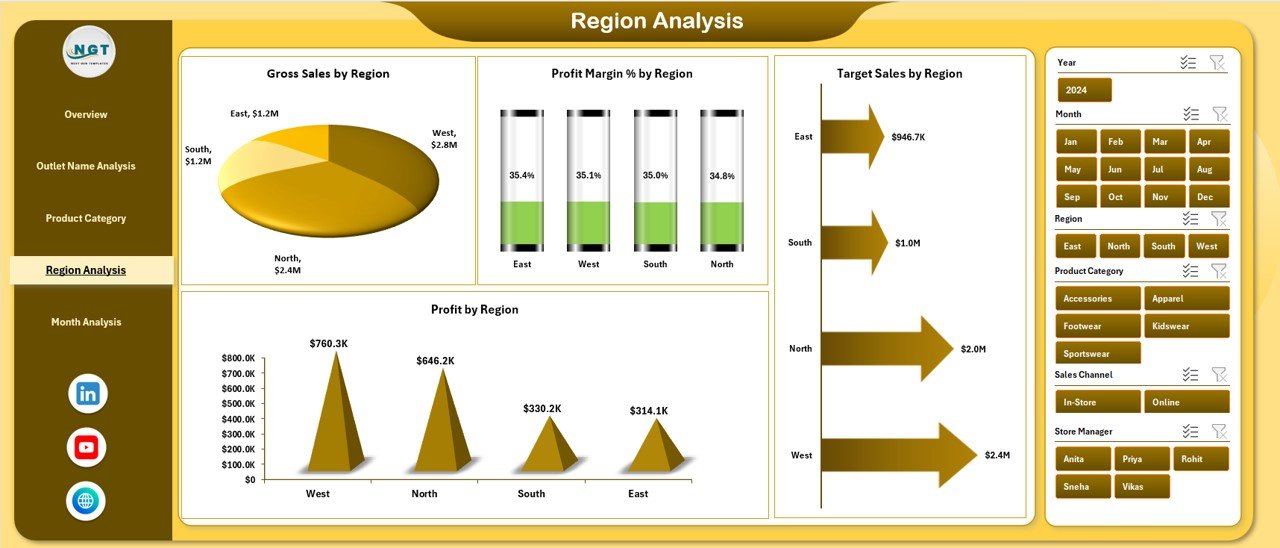
Retail expansion requires regional insights. The Region Analysis page compares performance geographically.
Charts Included
-
Gross Sales by Region
-
Target Sales by Region
-
Profit Margin % by Region
-
Profit by Region
Managers use this page to:
Click to Purchases Outlet Stores Dashboard in Excel
-
Understand regional demand
-
Allocate marketing budgets wisely
-
Improve regional sales strategies
-
Plan expansion decisions
Therefore, businesses grow strategically instead of guessing market opportunities.
5️⃣ Month Analysis – How Does Performance Change Over Time?
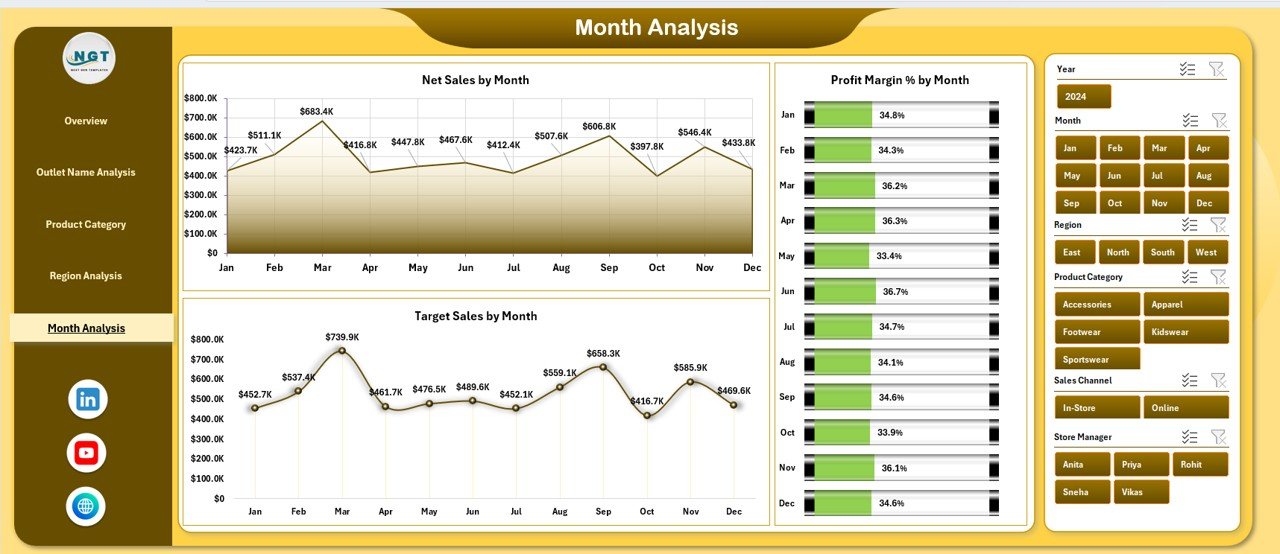
Trend analysis plays a critical role in retail planning. The Month Analysis page focuses on time-based insights.
Metrics Displayed
-
Net Sales by Month
-
Profit Margin % by Month
-
Target Sales by Month
This page allows businesses to:
-
Identify seasonal trends
-
Forecast future sales
-
Evaluate promotional campaigns
-
Plan inventory efficiently
Because trends become visible instantly, decision-makers respond proactively.
What Data Sheets Support the Dashboard?
The dashboard operates using structured backend sheets.
Data Sheet
Stores raw transactional data such as:
-
Outlet name
-
Region
-
Product category
-
Sales values
-
Costs
-
Targets
-
Dates
Support Sheet
Contains lookup tables, formulas, and calculation logic that power visuals and KPIs.
Together, these sheets ensure accurate and automated reporting.
Advantages of Outlet Stores Dashboard in Excel
Click to Purchases Outlet Stores Dashboard in Excel
A well-designed dashboard provides several business benefits.
✅ Better Decision Making
Managers view performance instantly, so they make faster decisions.
✅ Centralized Reporting
All KPIs appear in one place instead of multiple files.
✅ Improved Profitability Tracking
Profit margins become visible across outlets and categories.
✅ Easy Performance Comparison
Users compare cities, regions, and stores effortlessly.
✅ Time Saving
Automation reduces manual reporting work.
✅ User-Friendly Interface
Even non-technical users operate the dashboard easily.
✅ Cost Effective Solution
Excel eliminates the need for expensive software tools.
How Does This Dashboard Improve Retail Operations?
Retail success depends on continuous monitoring. This dashboard strengthens operations in multiple ways.
Sales Optimization
Managers identify weak-performing stores and adjust strategies quickly.
Cost Control
Cost analysis helps reduce unnecessary expenses.
Target Management
Teams monitor achievements against goals regularly.
Strategic Planning
Trend analysis supports long-term planning.
Performance Accountability
Store managers remain accountable through measurable KPIs.
Best Practices for the Outlet Stores Dashboard in Excel
To achieve maximum value, businesses should follow proven best practices.
1. Maintain Clean Data
Always update structured and error-free data.
2. Update Data Regularly
Frequent updates ensure accurate insights.
3. Use Filters Smartly
Apply slicers to analyze specific outlets or regions.
4. Focus on Key KPIs
Avoid tracking unnecessary metrics.
5. Standardize Data Entry
Use consistent formats across teams.
6. Review Monthly Trends
Regular trend analysis improves forecasting accuracy.
7. Train Users
Ensure team members understand dashboard navigation.
Who Can Benefit from an Outlet Stores Dashboard?
Many professionals gain value from this dashboard.
-
Retail business owners
-
Outlet store managers
-
Sales analysts
-
Finance teams
-
Regional managers
-
Operations executives
-
Retail consultants
Therefore, the dashboard serves organizations of all sizes.
How to Implement the Outlet Stores Dashboard Successfully?
Click to Purchases Outlet Stores Dashboard in Excel
Implementation becomes simple when you follow a structured approach.
Step 1: Prepare Data
Collect outlet sales and operational data.
Step 2: Import Data into Excel
Paste or connect data to the Data Sheet.
Step 3: Refresh Dashboard
Update calculations automatically.
Step 4: Apply Filters
Analyze performance using slicers.
Step 5: Review Insights
Use charts to identify improvement areas.
Why Choose Excel for Retail Dashboards?
Although many BI tools exist, Excel remains highly popular.
Reasons Excel Works Best
-
Widely available software
-
Easy customization
-
Flexible formulas
-
Interactive charts
-
Low learning curve
-
No additional licensing cost
Moreover, Excel integrates easily with existing business processes.
Future Opportunities with Retail Dashboards
Retail analytics continues evolving. Businesses can expand dashboards further by adding:
-
Customer segmentation analysis
-
Inventory turnover tracking
-
Promotion effectiveness metrics
-
Forecasting models
-
Automated data connections
Therefore, dashboards grow alongside business needs.
Conclusion: Why Every Retail Business Needs an Outlet Stores Dashboard
Retail success depends on clear visibility into performance metrics. Without structured insights, businesses struggle to compete effectively. However, the Outlet Stores Dashboard in Excel transforms complex data into easy-to-understand visuals.
Because the dashboard combines sales, profitability, targets, and trends into one platform, managers gain complete operational clarity. As a result, businesses improve decision-making, increase efficiency, and drive sustainable growth.
If retail organizations want smarter analytics without complex software, this dashboard offers the perfect solution.
Frequently Asked Questions (FAQs)
What is an Outlet Stores Dashboard in Excel used for?
It helps businesses track sales, profit margins, targets, and performance across outlet stores using visual analytics.
Is this dashboard suitable for small businesses?
Yes. Small and medium retailers benefit greatly because Excel remains affordable and easy to use.
Do I need advanced Excel skills to use the dashboard?
No. Users only need basic Excel knowledge to operate filters and update data.
How often should I update the dashboard?
You should update data daily, weekly, or monthly depending on business operations.
Can the dashboard handle multiple outlets?
Yes. The dashboard supports analysis across multiple stores, regions, and categories.
Can I customize the dashboard?
Yes. Businesses can modify charts, KPIs, and layouts according to requirements.
Does the dashboard support trend analysis?
Yes. The Month Analysis page tracks performance changes over time.
Why is profit margin tracking important?
Profit margins reveal actual business health beyond sales revenue.
Visit our YouTube channel to learn step-by-step video tutorials