Managing partner alliances without proper visibility often leads to missed targets, weak collaboration, and unclear performance outcomes. However, when teams track the right KPIs in a structured way, partner relationships become measurable, scalable, and profitable. That is where a Partner Alliances KPI Dashboard in Excel plays a critical role.
In this detailed article, you will learn what a Partner Alliances KPI Dashboard in Excel is, why organizations need it, how it works, its structure, advantages, best practices, and frequently asked questions. Moreover, this article explains each sheet of the ready-to-use Excel dashboard in a clear and practical manner so that you can apply the same concept in real business scenarios.
Click to buy Partner Alliances KPI Dashboard in Excel
What Is a Partner Alliances KPI Dashboard in Excel?
A Partner Alliances KPI Dashboard in Excel is a centralized performance monitoring tool designed to track, analyze, and evaluate KPIs related to business partners, alliances, and channel relationships.
Instead of reviewing multiple Excel files, emails, or reports, this dashboard brings all alliance-related KPIs into one interactive and dynamic Excel interface. As a result, alliance managers, business heads, and leadership teams can review performance quickly and take action on time.
Moreover, since the dashboard works entirely inside Excel, teams do not need any complex BI tools, coding, or external systems.
Why Do Organizations Need a Partner Alliances KPI Dashboard?
Partner alliances contribute significantly to revenue growth, market expansion, and brand reach. However, without clear KPI tracking, alliances often fail to deliver expected results.
Therefore, organizations need a structured dashboard because:
- Partners operate across regions, products, and markets
- Performance varies monthly and yearly
- Targets and actuals need continuous comparison
- Leadership needs quick insights without manual reporting
A Partner Alliances KPI Dashboard in Excel solves these challenges by converting raw KPI data into meaningful insights.
What KPIs Can You Track Using a Partner Alliances KPI Dashboard?
A Partner Alliances KPI Dashboard in Excel allows you to track multiple alliance-related KPIs such as:
- Partner Revenue Contribution
- Alliance Growth Rate
- Partner Sales Performance
- Active Partner Count
- Partner Conversion Rate
- Campaign Performance via Partners
- Target Achievement Percentage
- Year-over-Year Performance
Additionally, you can customize KPIs based on your business model and alliance strategy.
How Does the Partner Alliances KPI Dashboard in Excel Work?
The dashboard follows a simple yet powerful structure:
- You enter Actual, Target, and Previous Year data
- The dashboard calculates MTD (Month-To-Date) and YTD (Year-To-Date) values
- It compares Actual vs Target and Actual vs Previous Year
- Visual indicators highlight performance trends
- Trend charts display historical movement
As a result, users get instant insights without manual calculations.
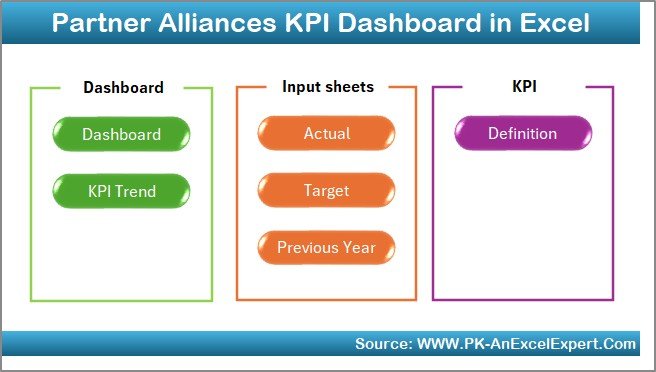
Overall Structure of the Partner Alliances KPI Dashboard in Excel
This ready-to-use dashboard contains 7 well-designed worksheets, each serving a specific purpose.
Let us explore each sheet in detail.
the Summary Page:
The Summary Page acts as an index or navigation sheet.
Key Highlights of the Summary Page
- It contains 6 navigation buttons
- Each button links to a specific dashboard section
- Users can quickly jump between sheets
- It improves usability and professional appearance
Therefore, users do not waste time searching for sheets.
Click to buy Partner Alliances KPI Dashboard in Excel
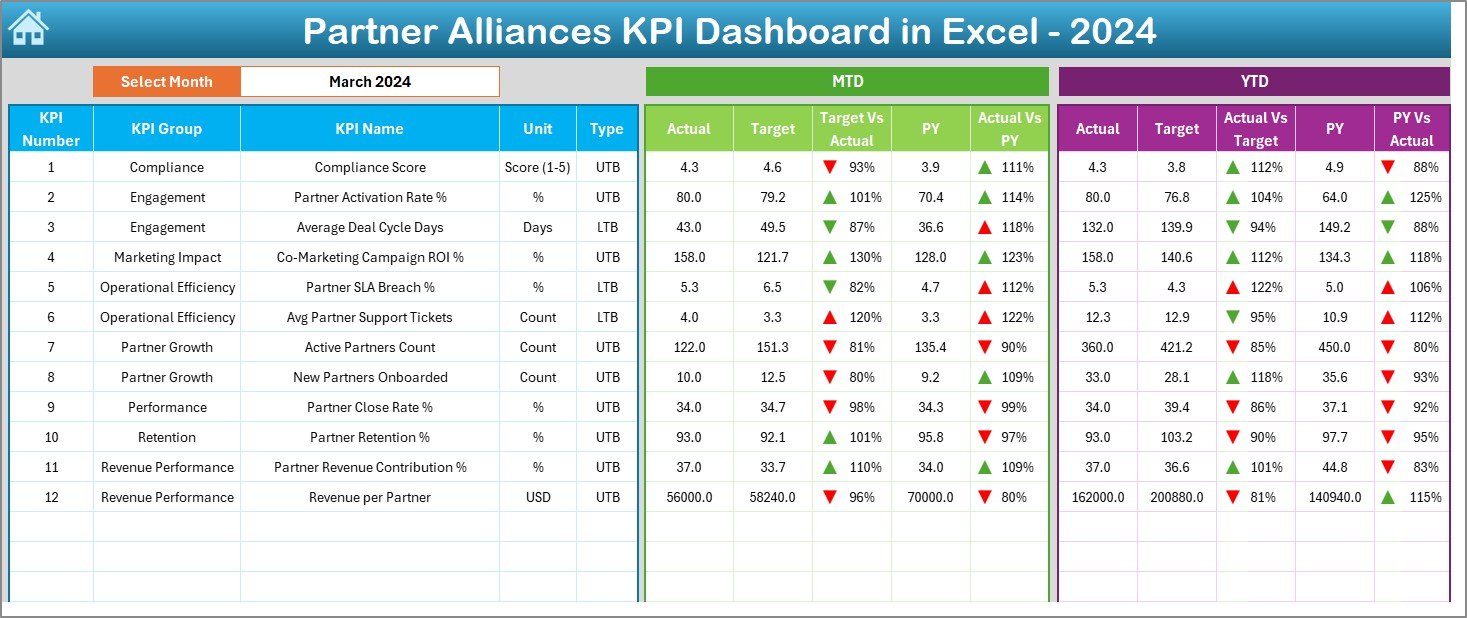
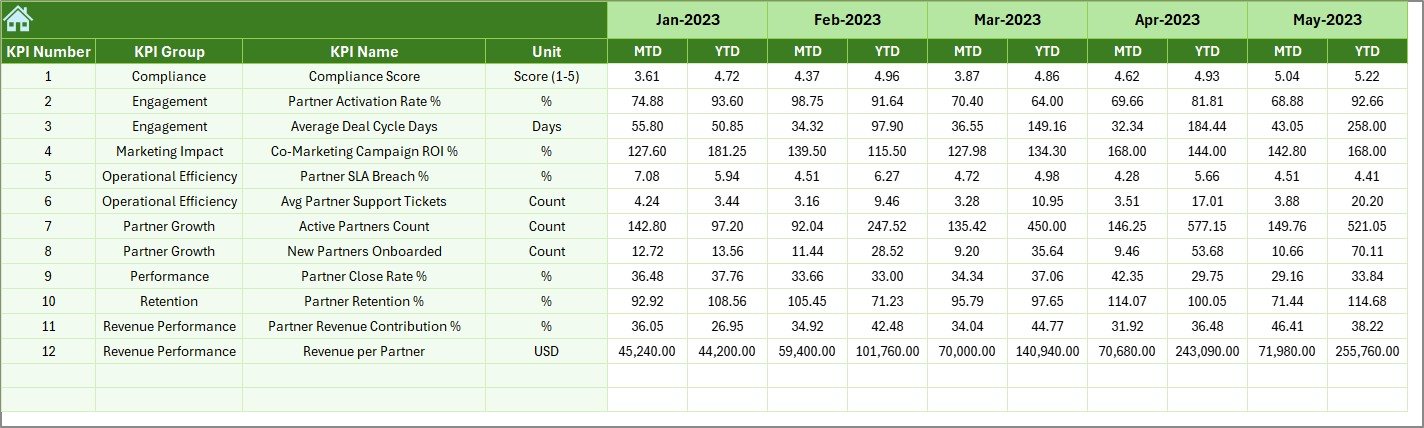
Dashboard Sheet :
The Dashboard Sheet serves as the main analytical view.
Features of the Dashboard Sheet
- Month selection dropdown available at cell D3
- All KPI values update automatically based on the selected month
- Displays comprehensive KPI performance in one place
KPIs Displayed on the Dashboard
MTD Section
- MTD Actual
- MTD Target
- MTD Previous Year
- Target vs Actual variance
- PY vs Actual variance
YTD Section
- YTD Actual
- YTD Target
- YTD Previous Year
- Target vs Actual variance
- PY vs Actual variance
Visual Enhancements
- Conditional formatting with up and down arrows
- Instant identification of over-performance and under-performance
- Clear numeric comparison without confusion
Consequently, decision-makers can spot performance gaps quickly.
Click to buy Partner Alliances KPI Dashboard in Excel
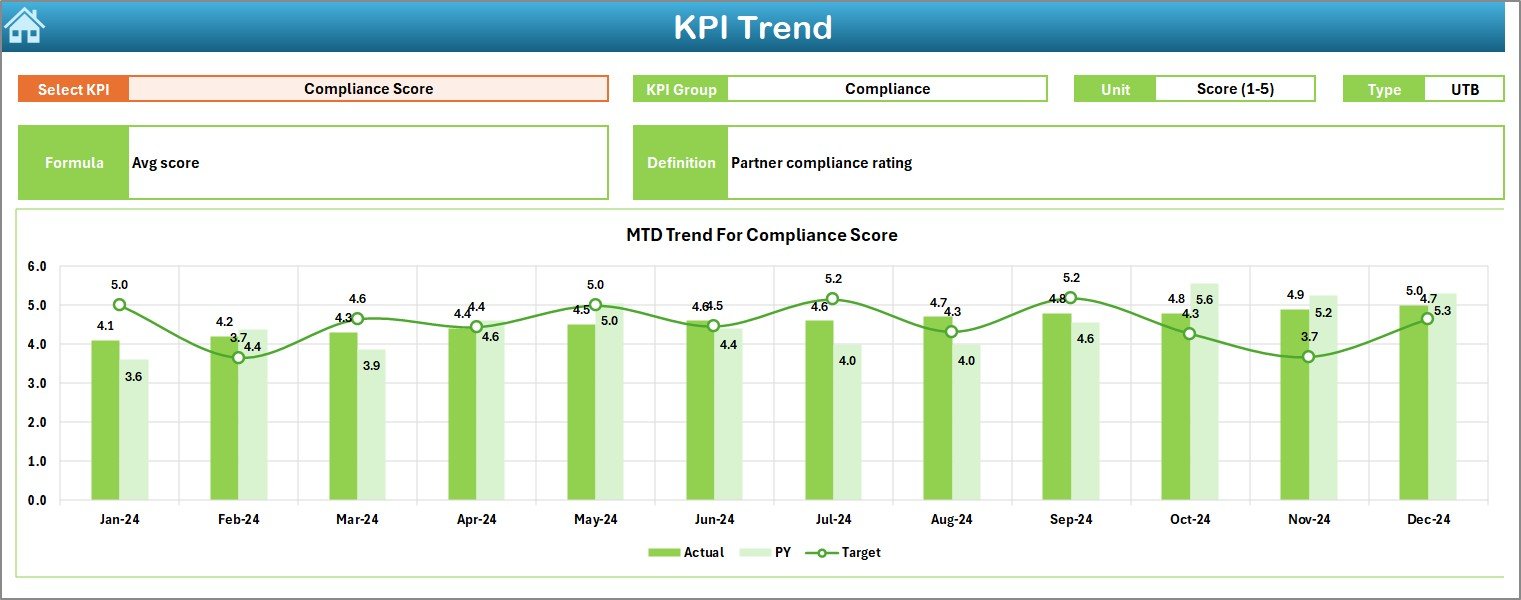
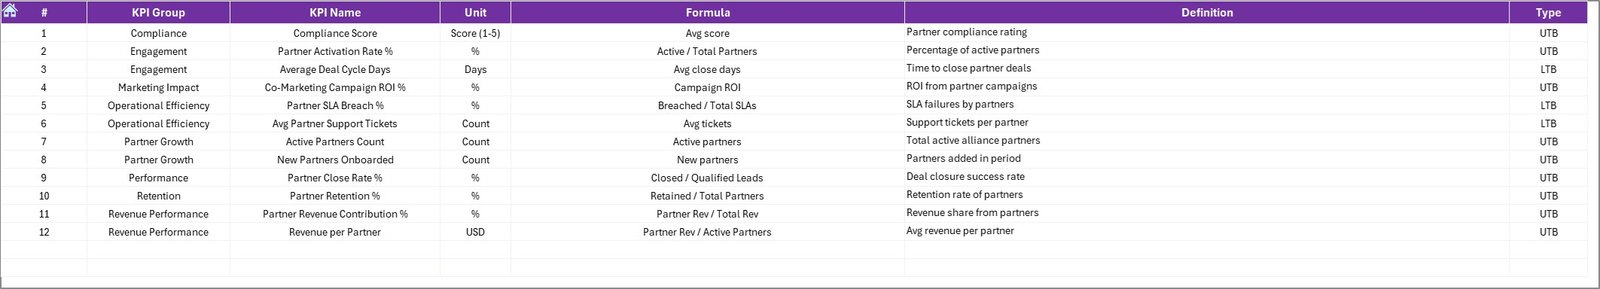
Trend Sheet :
The Trend Sheet focuses on individual KPI performance over time.
What Can You Do on the Trend Sheet?
- Select a KPI Name using the dropdown at cell C3
- View detailed KPI metadata instantly
KPI Details Displayed
- KPI Group
- Unit of Measurement
- KPI Type (LTB or UTB)
- KPI Formula
- KPI Definition
Trend Charts Available
- MTD trend for Actual, Target, and Previous Year
- YTD trend for Actual, Target, and Previous Year
As a result, users understand not only current performance but also historical movement.
Click to buy Partner Alliances KPI Dashboard in Excel
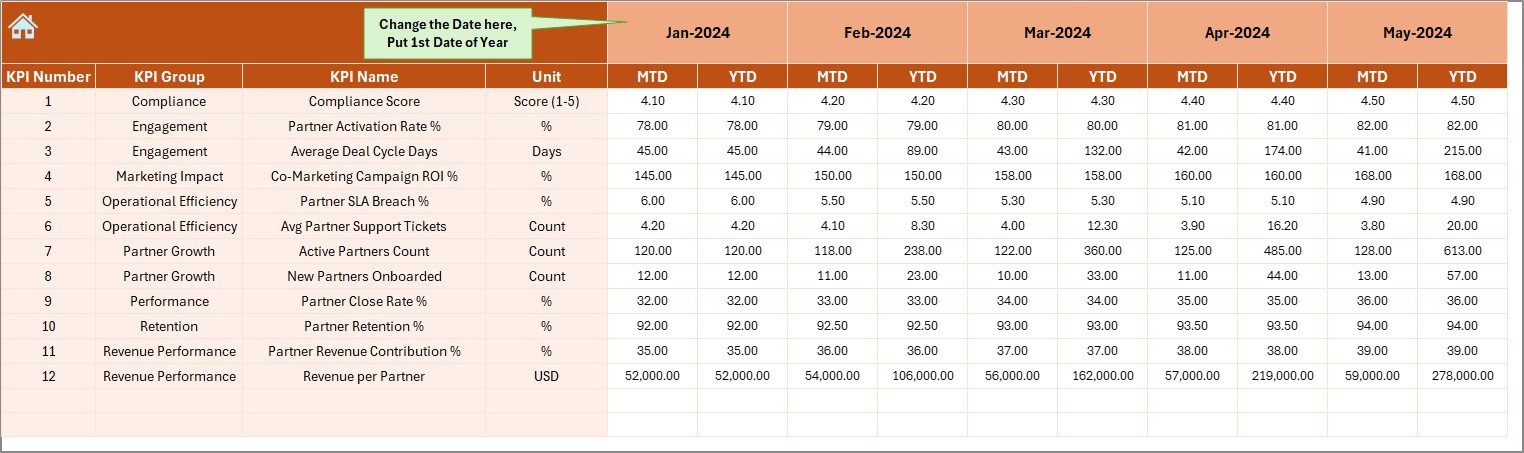
the Actual Numbers Input Sheet:
The Actual Numbers Input Sheet stores actual KPI values.
Key Rules for Data Entry
- Enter MTD and YTD Actual values for each KPI
- Use cell E1 to define the first month of the year
- Change the month to update dashboard calculations
- Keep data entry clean and consistent
This structure avoids formula errors and ensures accuracy.
Click to buy Partner Alliances KPI Dashboard in Excel
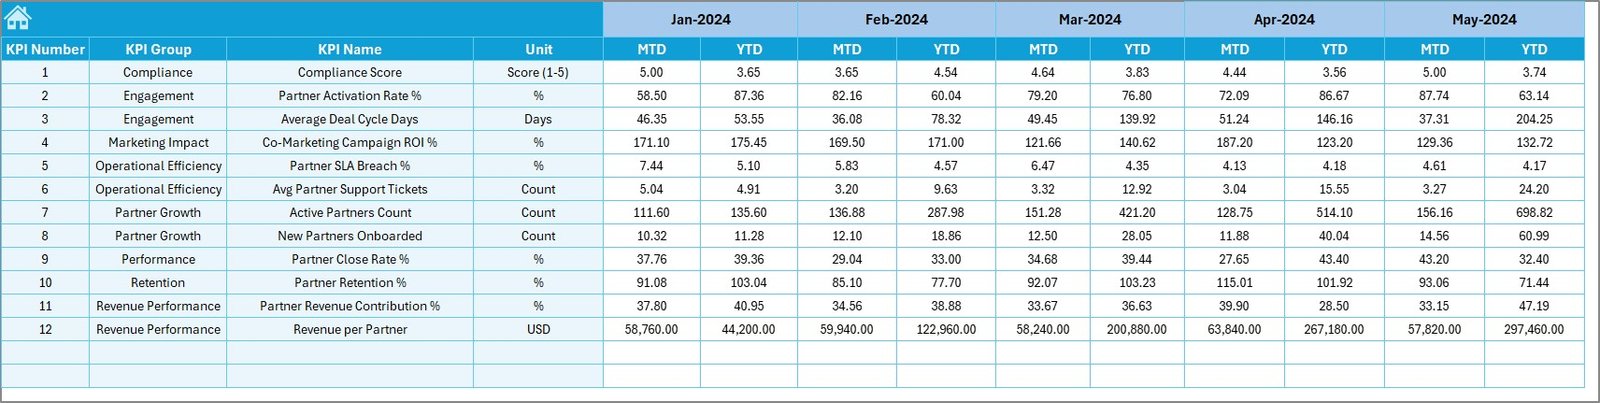
the Target Sheet :
The Target Sheet stores KPI targets.
Target Sheet Responsibilities
- Enter MTD Target values
- Enter YTD Target values
- Assign targets for each KPI and month
- Support future planning and benchmarking
Because of this structured setup, the dashboard can compare performance with planned goals.
Previous Year Number Sheet :
The Previous Year Number Sheet stores historical data.
Benefits of Using Previous Year Data
- Enables year-over-year comparison
- Highlights growth or decline trends
- Improves strategic planning
- Provides context to raw numbers
You simply enter previous year values similar to the current year format.
Click to buy Partner Alliances KPI Dashboard in Excel
the KPI Definition Sheet;
The KPI Definition Sheet acts as a KPI reference guide.
Fields Available in KPI Definition Sheet
- KPI Name
- KPI Group
- Unit of Measurement
- KPI Formula
- KPI Definition
This sheet ensures consistency and avoids KPI misinterpretation across teams.
Advantages of Partner Alliances KPI Dashboard in Excel
Using a Partner Alliances KPI Dashboard in Excel offers multiple benefits.
Key Advantages
- Centralized KPI tracking for all partners
- Easy monthly and yearly performance comparison
- Clear visibility of target achievement
- No dependency on external BI tools
- Fully customizable KPIs and structure
- Simple Excel-based implementation
- Faster decision-making with real-time insights
As a result, alliance managers gain better control and clarity.
How Does This Dashboard Improve Partner Performance?
This dashboard improves partner performance because:
- Teams identify under-performing alliances early
- Managers understand trends before issues escalate
- Targets remain visible throughout the year
- Performance discussions become data-driven
Therefore, partnerships become more accountable and outcome-focused.
Best Practices for the Partner Alliances KPI Dashboard in Excel
Following best practices ensures maximum value from the dashboard.
Best Practices You Should Follow
- Define KPIs aligned with alliance objectives
- Update actual data regularly and consistently
- Set realistic and measurable targets
- Review dashboard monthly with stakeholders
- Use trend analysis for long-term decisions
- Keep KPI definitions clear and standardized
- Avoid unnecessary KPIs to maintain clarity
By following these practices, organizations achieve sustainable alliance growth.
Who Should Use a Partner Alliances KPI Dashboard in Excel?
This dashboard suits a wide range of roles:
- Partnership Managers
- Channel Managers
- Business Development Teams
- Strategy Teams
- CXOs and Leadership
- Sales Operations Teams
Essentially, anyone involved in managing or reviewing partner alliances can benefit.
Can You Customize the Partner Alliances KPI Dashboard in Excel?
Yes, you can customize it easily.
You can:
- Add or remove KPIs
- Modify KPI formulas
- Change dashboard layout
- Add new trend charts
- Adjust monthly or yearly logic
Since the dashboard runs in Excel, customization remains flexible and user-friendly.
Conclusion: Why a Partner Alliances KPI Dashboard in Excel Is a Must-Have Tool
A Partner Alliances KPI Dashboard in Excel transforms alliance management from guesswork into structured performance tracking. Instead of relying on scattered data, organizations gain a unified view of partner contributions, targets, and trends.
Moreover, the dashboard empowers leaders to make faster, smarter, and more confident decisions. When organizations track the right KPIs with the right structure, partner alliances become strategic growth engines rather than operational headaches.
Frequently Asked Questions (FAQ)
What is the main purpose of a Partner Alliances KPI Dashboard in Excel?
The main purpose is to track, analyze, and compare partner alliance KPIs using MTD and YTD performance inside Excel.
Do I need advanced Excel skills to use this dashboard?
No, basic Excel knowledge is sufficient because the dashboard uses simple inputs and dropdown selections.
Can I use this dashboard for different industries?
Yes, you can adapt the KPIs and structure for IT, SaaS, manufacturing, distribution, or service-based businesses.
How often should I update the dashboard?
You should update it monthly to keep MTD and YTD insights accurate.
Can this dashboard handle multiple partners?
Yes, you can design KPIs that aggregate or segment partner data as needed.
Is this dashboard suitable for leadership reporting?
Absolutely. It provides high-level insights while supporting detailed KPI analysis.
Visit our YouTube channel to learn step-by-step video tutorials
Watch the step-by-step video tutorial:
Click to buy Partner Alliances KPI Dashboard in Excel