A Personal Care & Beauty Dashboard in Power BI is a dynamic reporting tool designed to analyze data related to beauty services, products, and operations. It connects with Excel-based data sources and automatically updates visual reports, enabling users to make data-driven decisions with ease.
This dashboard brings together essential KPIs such as planned service percentage, profit by service type, cancelled service rate, regional cost analysis, and revenue by branch — helping businesses track performance from every angle.
Whether you manage a single salon or a chain of beauty centers, this Power BI dashboard provides actionable insights for improving efficiency, customer satisfaction, and profitability.
Click to Purchases Personal Care & Beauty Dashboard in Power BI
Structure of the Personal Care & Beauty Dashboard
The dashboard is built with five key pages in the Power BI Desktop file. Each page focuses on a different dimension of business performance, supported by slicers and visual charts for seamless interactivity.
1️⃣ Overview Page
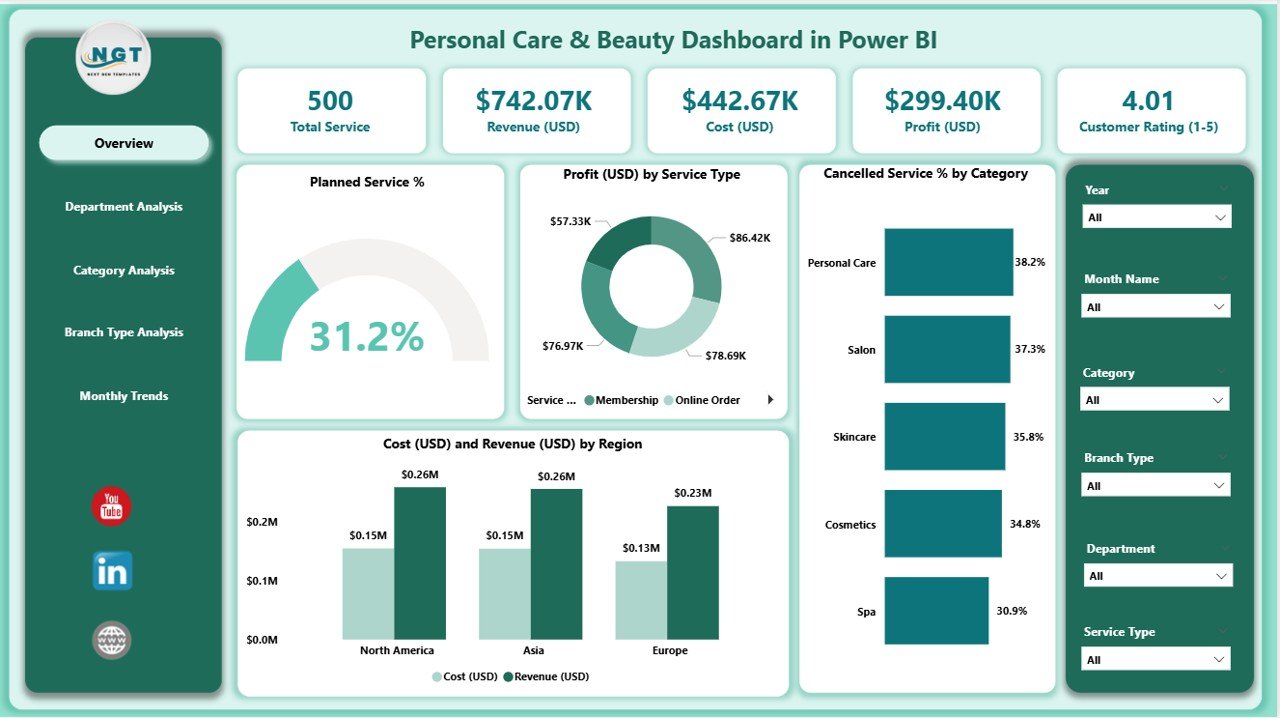
The Overview Page is the central hub of the dashboard. It provides a snapshot of business performance across various service categories and regions.
Key elements on this page include:
-
🧴 Planned Service %: Measures the proportion of scheduled services completed as planned.
-
💵 Profit (USD) by Service Type: Displays which services — such as haircare, skincare, or spa treatments — generate the most profit.
-
❌ Cancelled Service % by Category: Shows service categories with higher cancellation rates.
-
🌍 Cost (USD) and Revenue (USD) by Region: Compares financial performance across different regions or locations.
Users can apply slicers to filter by date, branch, service type, or region, allowing detailed comparisons and quick insights.
2️⃣ Department Analysis Page

The Department Analysis Page focuses on performance at the departmental level. Whether your organization includes hair styling, skincare, makeup, or spa therapy departments, this section helps you evaluate how each contributes to overall success.
Charts featured:
-
💰 Profit (USD) by Department – Identifies high-performing departments.
-
🚫 Cancelled Service % by Department – Highlights operational inefficiencies or demand fluctuations.
-
📈 Cost (USD) and Revenue (USD) by Department – Shows the financial relationship between costs and generated income.
With these visuals, decision-makers can identify the departments that require optimization or additional support.
Click to Purchases Personal Care & Beauty Dashboard in Power BI
3️⃣ Category Analysis Page
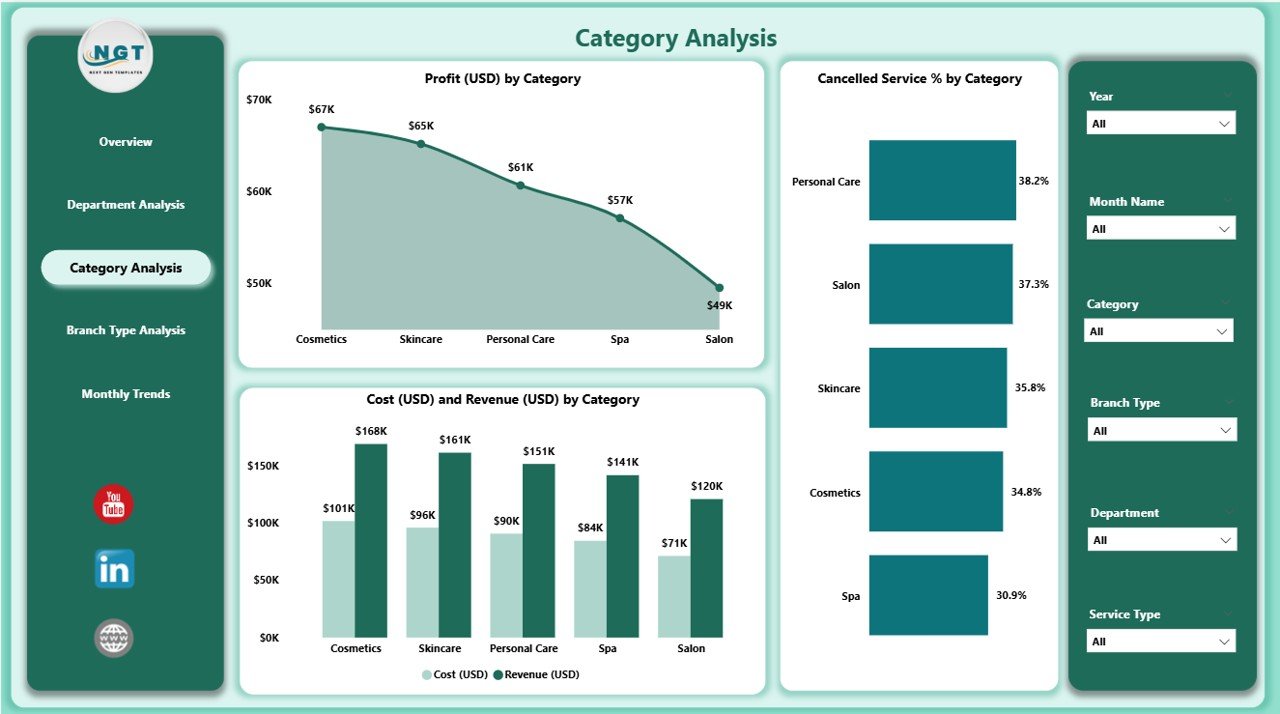
The Category Analysis Page provides a deeper dive into specific product or service categories within the business. It’s perfect for tracking trends such as which services are most profitable or where cancellations are highest.
Included visuals:
-
💸 Profit (USD) by Category
-
❌ Cancelled Service % by Category
-
📊 Cost (USD) and Revenue (USD) by Category
This page helps in strategic pricing, promotions, and inventory planning for different beauty categories.
4️⃣ Branch Type Analysis Page

This page examines how different types of branches — such as flagship salons, franchise outlets, or express service centers — perform against each other.
Key charts include:
-
🚫 Cancelled Service % by Branch Type – Helps identify operational gaps across branch types.
-
💵 Cost (USD) and Revenue (USD) by Branch Type – Compares financial efficiency between branches.
-
⭐ Customer Rating (1–5) by Branch Type – Reveals which branch models deliver higher customer satisfaction.
With this data, management can replicate successful strategies across underperforming locations.
5️⃣ Monthly Trends Page

The Monthly Trends Page captures time-based patterns in performance. This helps users spot seasonal peaks, marketing impact, or operational bottlenecks over time.
Displayed visuals:
-
💸 Cost (USD) and Revenue (USD) by Month
-
💰 Profit (USD) by Month
-
💅 Total Service by Month
These insights are invaluable for forecasting demand, planning budgets, and setting future sales targets.
Advantages of the Personal Care & Beauty Dashboard in Power BI
1. Real-Time Insights
The dashboard updates automatically from Excel or connected data sources, ensuring that users always work with the latest numbers.
2. Centralized Performance Monitoring
With all KPIs visible on one screen, managers can instantly assess performance across departments, categories, and branches.
3. Improved Decision-Making
Visual data makes it easier to detect trends, issues, and opportunities, allowing quick and informed actions.
4. Customizable and Scalable
You can easily customize this Power BI file to include additional KPIs like average customer spend, employee utilization, or appointment duration.
5. Enhanced Profitability
By comparing costs and revenue visually, businesses can discover where profits leak and where opportunities lie.
6. User-Friendly Interface
Even non-technical users can interact with slicers and filters to get the information they need without any coding or complex setup.
How the Dashboard Empowers Personal Care Businesses
1. Boosts Customer Experience
By analyzing cancellation rates, ratings, and profit margins, businesses can refine service delivery and enhance customer satisfaction.
2. Improves Resource Allocation
Department-wise cost and revenue data helps in optimizing manpower, inventory, and promotions.
3. Enables Strategic Marketing
Tracking regional performance enables targeted marketing campaigns that drive engagement in specific areas.
4. Simplifies Performance Reviews
Instead of going through multiple Excel files, managers can review performance visually and make faster, data-backed decisions.
5. Drives Consistency Across Branches
Branch-type analysis ensures that successful strategies are replicated company-wide for consistent service quality.
Opportunities for Improvement
While the Personal Care & Beauty Dashboard in Power BI provides extensive analytics, there are always opportunities to enhance its capabilities:
-
🔄 Integration with CRM systems: Connect customer data to get deeper insights into behavior and retention.
-
📱 Mobile-Friendly Optimization: Enable dashboard access on smartphones for on-the-go managers.
-
⚙️ Automation of Data Refresh: Schedule automatic data refreshes from Excel or cloud databases.
-
💬 Sentiment Analysis: Incorporate customer feedback text analysis for richer insights.
-
🎯 Advanced Forecasting: Use Power BI’s AI visuals for predicting sales or appointment trends.
Best Practices for Using the Personal Care & Beauty Dashboard in Power BI
To get the most out of this dashboard, businesses should follow these proven best practices:
- Maintain Data Accuracy: Regularly update and validate the source Excel data to ensure insights remain reliable.
- Use Consistent Naming Conventions: Keep category, department, and branch names uniform to avoid mismatched results.
- Apply Filters Wisely: Use slicers strategically to compare similar metrics (e.g., month-to-month or branch-to-branch).
- Track KPIs Periodically: Monitor monthly and quarterly trends to identify long-term performance shifts.
- Encourage Data Literacy: Train staff to interpret visuals correctly and make data-driven suggestions.
- Leverage Power BI Service: Publish dashboards to Power BI Service for sharing reports securely across teams.
- Customize for Your Brand: Modify color schemes, logos, and layouts to match your salon or spa’s branding identity.
- Monitor Customer Ratings Closely: Use feedback insights to enhance service delivery quality and brand loyalty.
Click to Purchases Personal Care & Beauty Dashboard in Power BI
Conclusion
The Personal Care & Beauty Dashboard in Power BI is more than just a reporting tool — it’s a complete performance intelligence system for the beauty industry. By consolidating financial, operational, and customer data in one place, it empowers business leaders to make smart decisions and stay competitive.
With interactive visuals, dynamic slicers, and real-time data connectivity, this dashboard brings clarity and control to salon and spa management. Whether you’re managing one outlet or a national chain, Power BI ensures you always have the insights you need at your fingertips.
Adopting this dashboard means transforming data into action — boosting profitability, efficiency, and customer satisfaction like never before.
Frequently Asked Questions (FAQs)
1. What is a Personal Care & Beauty Dashboard in Power BI used for?
It’s used to track performance metrics such as profit, cost, service cancellations, and customer satisfaction in beauty and personal care businesses.
2. Can small salons or freelancers use this dashboard?
Yes. It’s designed to work with simple Excel data sources, making it ideal for both small and large operations.
3. Do I need coding knowledge to use it?
No. The dashboard uses built-in Power BI features with pre-defined formulas and visuals — no programming required.
4. Can I customize the visuals and KPIs?
Absolutely. Users can modify charts, colors, and KPIs according to their business needs.
5. How often should I update the data?
For accurate insights, update your Excel data weekly or automate refresh schedules within Power BI.
6. Is it compatible with Power BI Service and Power BI Mobile?
Yes, you can publish and share it across both platforms for real-time collaboration and access on the go.
7. How does it help in improving profitability?
By visualizing cost versus revenue data, it helps managers identify profitable services and reduce expenses in underperforming areas.
Visit our YouTube channel to learn step-by-step video tutorials
Click to Purchases Personal Care & Beauty Dashboard in Power BI