Personal Finance Dashboard in Power BI is a ready-to-use financial analytics template designed for individuals who want to track their income, expenses, savings, budgets, and transaction status from a single interactive dashboard. Built with 5 dynamic pages, this Power BI template delivers actionable financial insights through KPI cards, detailed charts, and flexible slicers — making personal money management visual, simple, and effective 📊💰.
Whether you want to understand your monthly spending habits, compare your income against expenses, review budget allocations, or monitor the status of every transaction, this Personal Finance Dashboard in Power BI gives you a complete financial picture without any advanced technical skills. If you are looking for an Excel-based alternative, explore the Personal Finance Dashboard in Excel or the Personal Finance KPI Scorecard in Excel for KPI-focused financial tracking.Key Features of Personal Finance Dashboard in Power BI
The Personal Finance Dashboard in Power BI includes 5 interactive dashboard pages that cover every aspect of personal financial management. Here are the standout features that make this template a must-have:
- 5 Interactive Dashboard Pages — Overview, Spending Analysis, Income Tracking, Budget Review, and Transaction Status provide 360-degree visibility into your finances
- 5 Dynamic KPI Cards — Total Income, Total Expenses, Net Cash Flow, Total Savings, and Total Records displayed on the Overview page for instant financial health assessment
- Multi-Dimensional Spending Analysis — Analyze expenses by payment method, priority level, and category to uncover savings opportunities
- Income vs Expense Tracking — Compare income and expenses by account and track monthly trends side by side
- Budget Utilization Monitoring — Track how budget is allocated and utilized across categories, priorities, and recurring expenses
- Transaction Status Tracking — Monitor records by status, category, and monthly averages for complete financial control
- Dynamic Slicers and Filters — Instantly filter the entire dashboard by category, account, payment method, or time period
- Ready-to-Use .pbix File — No DAX or Power Query skills needed — just replace sample data and start analyzing
Click to buy Personal Finance Dashboard in Power BI
Dashboard Pages Explained
1. Overview Page
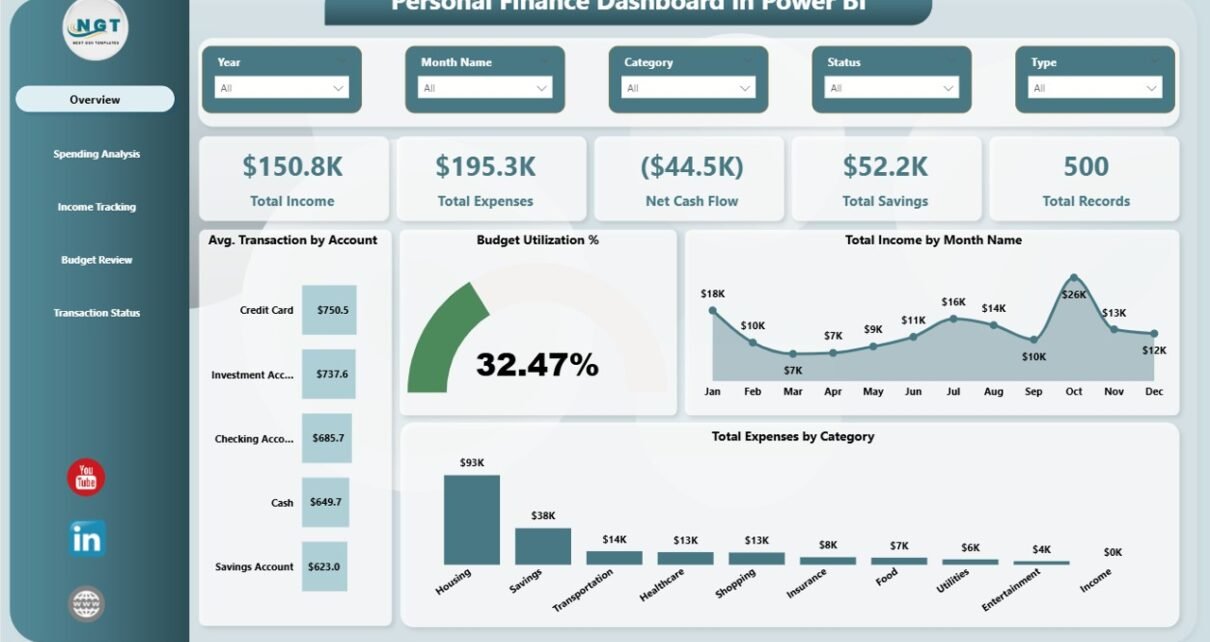
The Overview page serves as the financial command center of the Personal Finance Dashboard in Power BI. At the top, you will find 5 high-level KPI cards displaying Total Income, Total Expenses, Net Cash Flow, Total Savings, and Total Records. These cards give you an instant snapshot of your overall financial position without scrolling through detailed reports.
Below the KPI cards, the page features several analytical charts including Average Transaction by Account which helps you understand your typical transaction size across different accounts, Budget Utilization % which shows how effectively you are staying within your planned budget, Total Income by Month Name which tracks your earning trends over time, and Total Expenses by Category which reveals where most of your money goes. Multiple slicers are available to filter the entire dashboard for quick drill-down analysis.
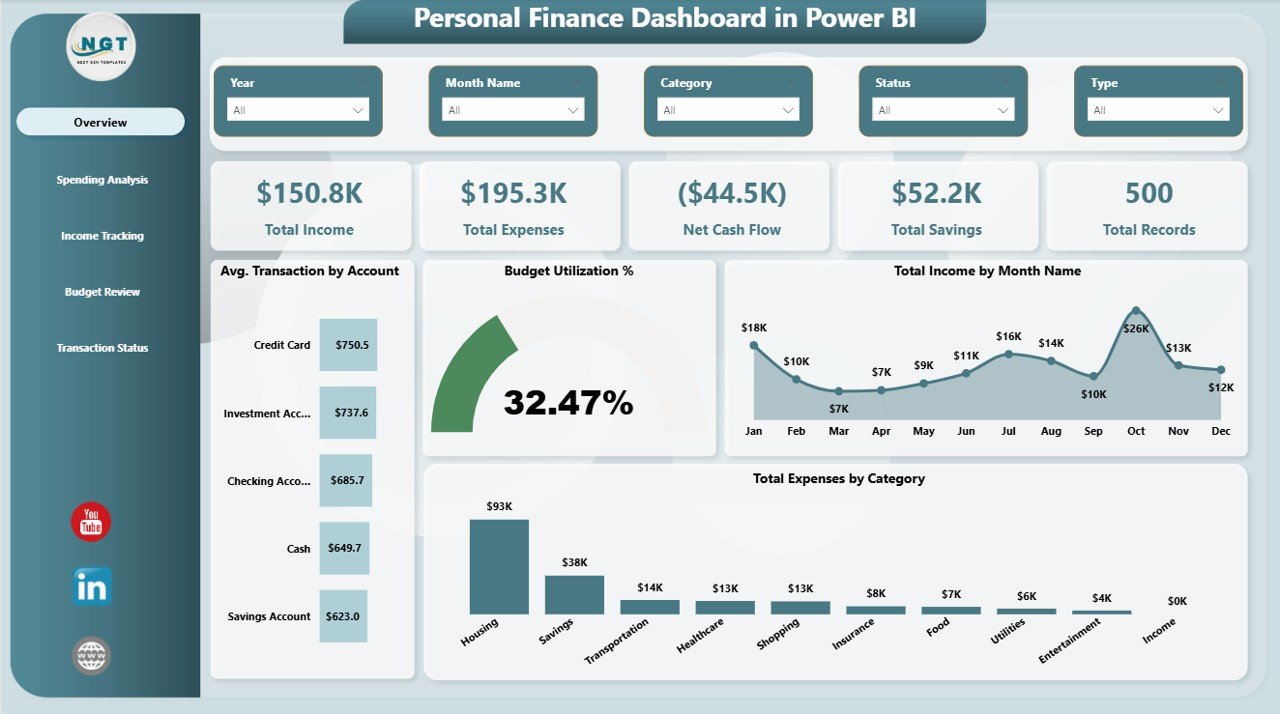
Overview Page
2. Spending Analysis
The Spending Analysis page dives deeper into your expenditure patterns. This page features Total Expenses by Payment Method which shows how your spending is distributed across cash, credit card, debit card, and other payment channels. The Total Expenses and Total Savings by Priority chart helps you compare spending and savings across different priority levels — essential for understanding which expenses are truly necessary versus discretionary. The Total Expenses and Budget Allocated by Category visual compares your actual spending against budgeted amounts for each category, making it easy to spot areas of overspending.
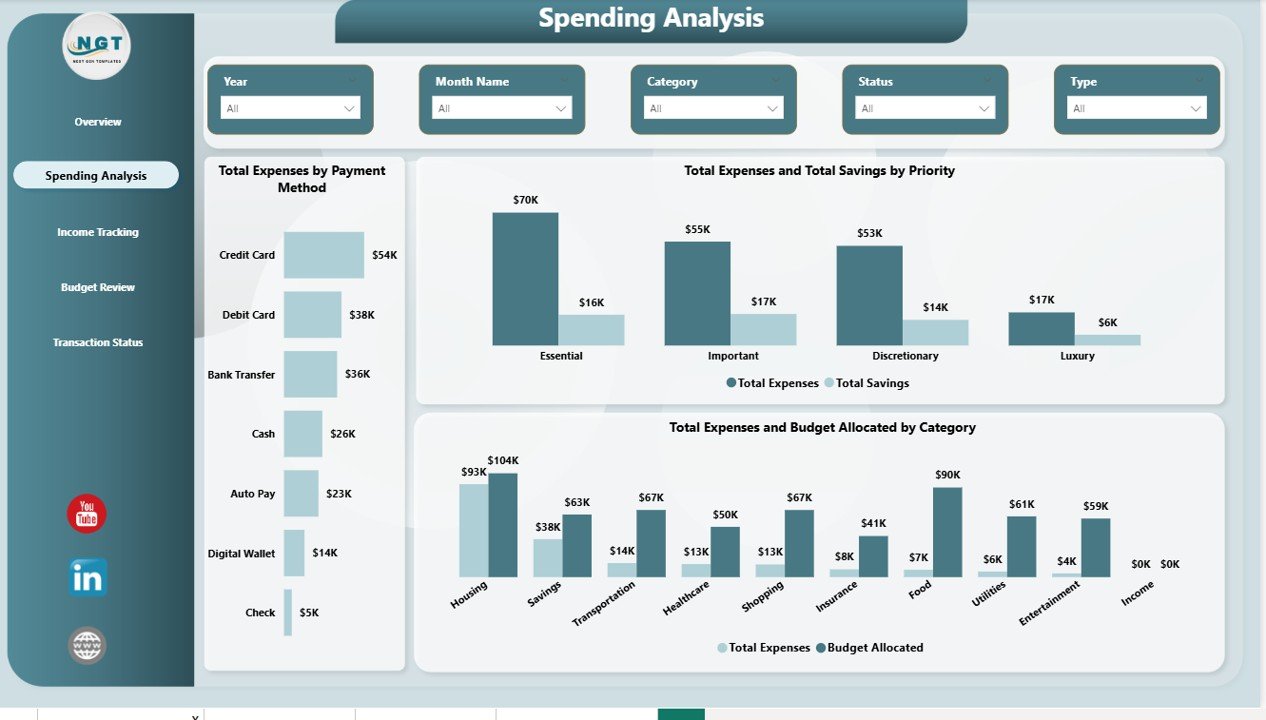
Spending Analysis
3. Income Tracking
The Income Tracking page focuses on monitoring your earnings and savings performance. Budget Utilization % by Account shows how well each account stays within its planned budget. The Total Savings and Total Income by Month Name chart tracks your earning and saving trends over the months, helping you identify seasonal patterns or growth. Total Income and Total Expenses by Account provides a clear comparison of money flowing in versus money flowing out across your various financial accounts.
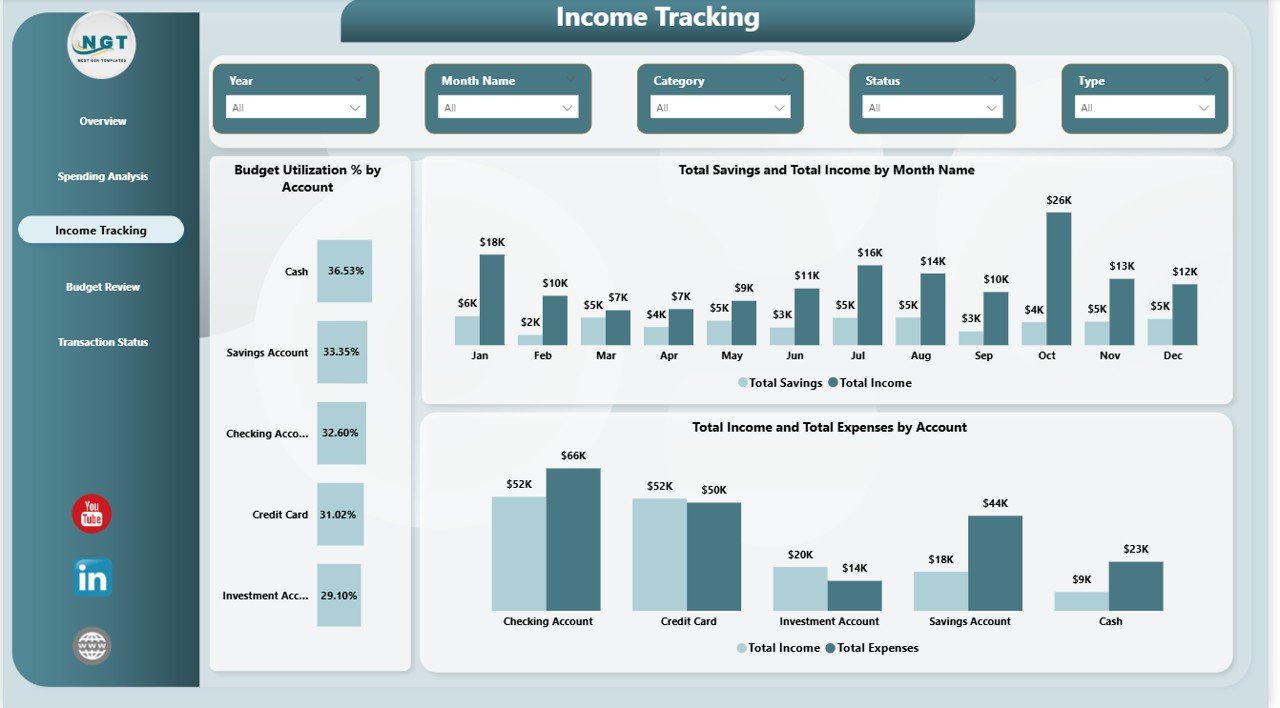
Income Tracking
4. Budget Review
The Budget Review page gives you a comprehensive look at how your budget is planned and distributed. Budget Allocated by Category shows how your total budget is split across different spending categories like housing, food, transport, and entertainment. Budget Allocated by Priority reveals how your financial plan distributes resources across high, medium, and low priority items. The Total Expenses and Budget Allocated by Recurring chart compares budgeted versus actual spending for both recurring and one-time expenses, helping you understand which fixed costs need attention.
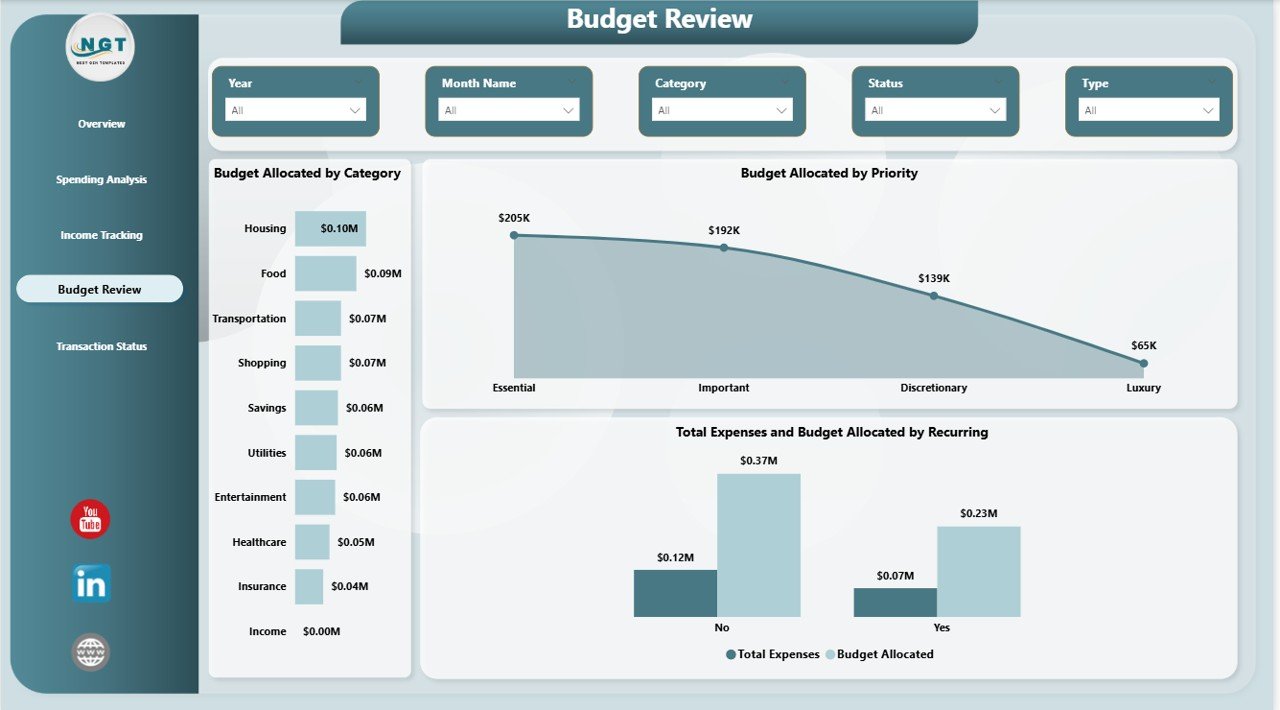
Budget Review
5. Transaction Status
The Transaction Status page provides operational visibility into all your financial transactions. Total Records by Status shows how many transactions are completed, pending, or cancelled — essential for reconciliation. Total Records by Category breaks down the volume of transactions across different spending categories. The Average Transaction by Month Name chart helps you understand how your typical transaction values fluctuate throughout the year, which is useful for cash flow planning and budgeting adjustments.
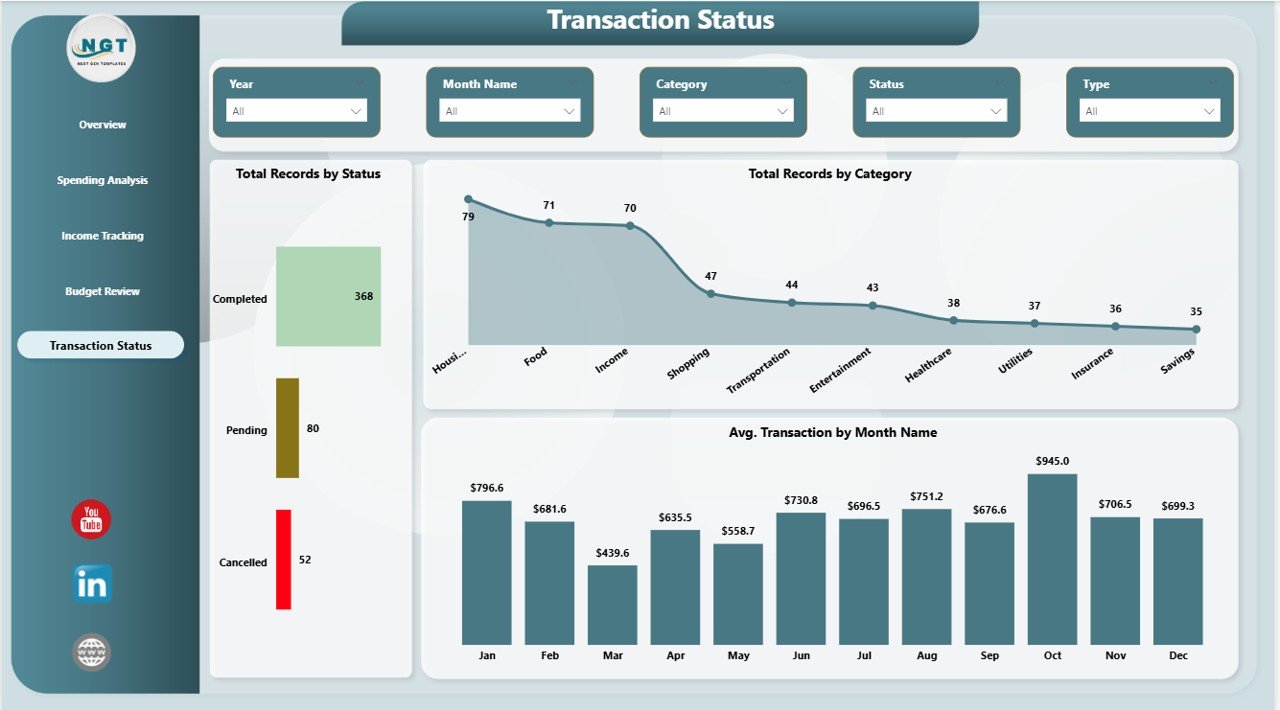
Transaction Status
Advantages of Personal Finance Dashboard in Power BI
- Complete Financial Visibility — Five dedicated pages ensure every aspect of your finances is tracked, from high-level KPIs to detailed transaction records
- Interactive Filtering — Dynamic slicers let you slice data by category, account, payment method, and time period for targeted analysis
- Zero Learning Curve — The template works out of the box with Power BI Desktop (free from Microsoft). No DAX formulas or Power Query transformations are needed
- Professional Visualizations — Clean, modern chart layouts make it easy to present your financial data to family members, advisors, or for your own review
- Budget vs Actual Comparisons — See exactly where you are overspending or underspending relative to your planned budget
- Multi-Account Support — Track finances across multiple bank accounts, credit cards, and payment methods in one unified view
Opportunities for Improvement
- Goal-Based Savings Tracking — Adding specific savings goals with target dates and progress bars would enhance long-term financial planning capabilities
- Forecast and Projection Views — Including predictive analytics or trend-based projections could help users anticipate future cash flow situations
- Debt Tracking Integration — A dedicated debt management section showing loan balances, interest rates, and payoff timelines would complement the existing budget and expense tracking
- Custom Date Range Filters — While month-based filtering is available, adding custom date range pickers would provide more flexible analysis windows
Best Practices for Using This Template
- Update Data Weekly — For the most accurate financial picture, input your transactions on a weekly basis rather than waiting until month-end
- Set Realistic Budgets — Use the Budget Review page to refine your budget allocations each quarter based on actual spending patterns from previous months
- Use Slicers Strategically — Filter by specific accounts or time periods to identify spending outliers and seasonal trends
- Monitor Net Cash Flow — The Net Cash Flow KPI card is your most important metric — a positive number means you are saving, negative means you are spending more than you earn
- Review Transaction Status Regularly — Use the Transaction Status page to catch pending or unprocessed transactions that might impact your budget calculations
- Compare Month Over Month — Use the monthly trend charts on the Income Tracking page to spot improvement or deterioration in your financial habits
Explore Relevant Templates
📌 Personal Finance Dashboard in Excel — The Excel version of this dashboard with pivot tables and interactive charts for users who prefer Microsoft Excel over Power BI.
📌 Personal Finance KPI Scorecard in Excel — A dedicated KPI scorecard that tracks monthly targets against actuals for key financial metrics.
📌 Net Worth Tracker in Excel — Monitor your assets, liabilities, and net worth growth over time with this focused tracking template.
📌 Savings Goal Planner in Excel — Plan and track progress toward specific savings goals with automated calculations and visual progress indicators.
📌 Debt Payoff Calculator Template in Excel — Create a strategic debt payoff plan using snowball or avalanche methods with this calculation template.
Frequently Asked Questions
What is the best Power BI template for tracking personal finances?
The Personal Finance Dashboard in Power BI from NextGenTemplates is one of the most comprehensive options available. It includes 5 interactive pages covering financial overview, spending analysis, income tracking, budget review, and transaction status — all in a single .pbix file that works immediately with Power BI Desktop.
How many KPIs does the Personal Finance Dashboard in Power BI track?
The dashboard tracks 5 key performance indicators on the Overview page: Total Income, Total Expenses, Net Cash Flow, Total Savings, and Total Records. These KPIs are calculated dynamically and update automatically when you replace the sample data with your own financial records.
Do I need Power BI Pro to use this dashboard?
No. You can use this template with Power BI Desktop, which is completely free to download from Microsoft. Power BI Pro is only needed if you want to publish and share the dashboard online with others through the Power BI Service.
Can I connect this Power BI dashboard to my bank account?
The template uses a structured data table that you fill manually or import from a CSV/Excel file. While Power BI supports direct data connections, this template is designed for manual data entry to give you full control over your financial records and privacy.
How do I customize the expense categories in this dashboard?
Simply modify the category column in the data table. You can add, rename, or remove categories to match your personal spending structure. All charts and slicers across the 5 dashboard pages will automatically reflect your updated categories.
Is this dashboard suitable for small business expense tracking?
While designed primarily for personal finance, the dashboard structure works well for freelancers and small business owners who want to track income, expenses, and budget allocations. For enterprise-level financial dashboards, explore the Power BI Dashboard Templates collection on NextGenTemplates.
Conclusion
The Personal Finance Dashboard in Power BI is a comprehensive, professionally designed template that transforms your raw financial data into meaningful, visual insights across 5 interactive pages. From high-level KPI monitoring on the Overview page to detailed transaction tracking on the Transaction Status page, every aspect of personal finance management is covered in this single .pbix file.
Whether you are an individual managing household budgets, a freelancer tracking project income, or a data enthusiast learning Power BI dashboard design, this template delivers immediate value with zero setup complexity. Download it today, connect your data, and take control of your financial future.
👉 Click here to Purchase Personal Finance Dashboard in Power BI
🎥 Visit our YouTube channel for step-by-step video tutorials:
👉 Youtube.com/@PK-AnExcelExpert
Click to buy Personal Finance Dashboard in Power BI