The petrochemical industry operates in one of the most complex and performance-driven environments in the world. Companies continuously manage production efficiency, operational safety, energy consumption, quality control, maintenance reliability, and financial performance. Therefore, organizations must track key performance indicators (KPIs) accurately and consistently.
However, many petrochemical companies still depend on scattered spreadsheets and manual reports. As a result, managers struggle to identify performance gaps quickly. Moreover, delayed insights often lead to production losses and increased operational risks.
To solve this challenge, we have created a Petrochemicals KPI Dashboard in Excel, a ready-to-use performance monitoring system designed to track, analyze, and improve petrochemical operations using structured KPIs.
In this comprehensive article, you will learn everything about the Petrochemicals KPI Dashboard in Excel, including its structure, features, benefits, implementation process, best practices, and frequently asked questions.
Click to buy Petrochemicals KPI Dashboard in Excel
What Is a Petrochemicals KPI Dashboard in Excel?
A Petrochemicals KPI Dashboard in Excel is a centralized performance management tool that monitors operational, production, safety, and financial KPIs in one interactive Excel dashboard.
Instead of reviewing multiple reports separately, managers can analyze all critical performance metrics from a single interface. Consequently, decision-makers gain faster insights and improve operational efficiency.
The dashboard converts raw petrochemical data into:
- Visual performance indicators
- Trend analysis charts
- Target vs Actual comparisons
- Year-to-Date performance tracking
- Monthly operational insights
Because Excel remains widely used across industries, teams can implement this dashboard without expensive software investments.
Why Does the Petrochemical Industry Need KPI Dashboards?
Petrochemical operations involve continuous production processes. Therefore, even small inefficiencies can create significant financial losses.
Common Challenges Faced by Petrochemical Organizations
- Manual KPI tracking consumes time.
- Data exists in multiple systems.
- Performance visibility remains limited.
- Decision-making becomes reactive instead of proactive.
- Trend analysis becomes difficult.
However, when companies implement a KPI dashboard, they transform raw operational data into actionable insights.
Key Objectives of Using KPI Dashboards
- Monitor plant performance in real time
- Improve production efficiency
- Reduce operational downtime
- Enhance safety compliance
- Optimize resource utilization
- Support data-driven decisions
As a result, organizations maintain consistent operational excellence.
Key Features of the Petrochemicals KPI Dashboard in Excel
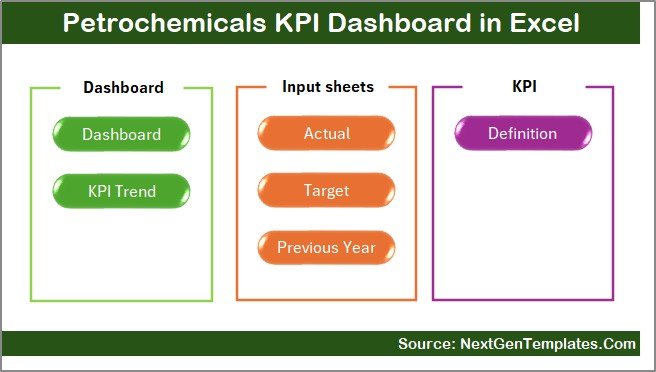
This dashboard includes 7 structured worksheets, each designed to perform a specific role in performance monitoring.
Summary Page – Easy Navigation Center
The Summary Page works as the dashboard index.
Here, users find navigation buttons that allow quick movement between sheets. Therefore, users save time while accessing different sections.
Key highlights:
- Centralized navigation
- User-friendly interface
- One-click sheet access
- Organized dashboard structure
Because navigation remains simple, even non-technical users can operate the dashboard easily.
Click to buy Petrochemicals KPI Dashboard in Excel
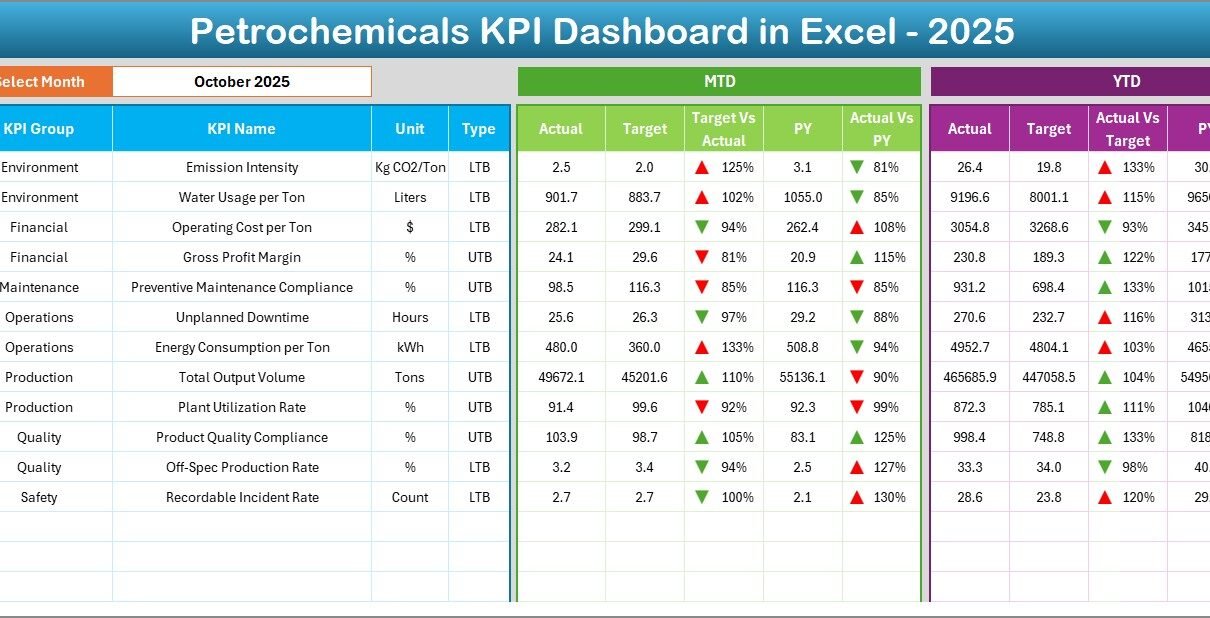
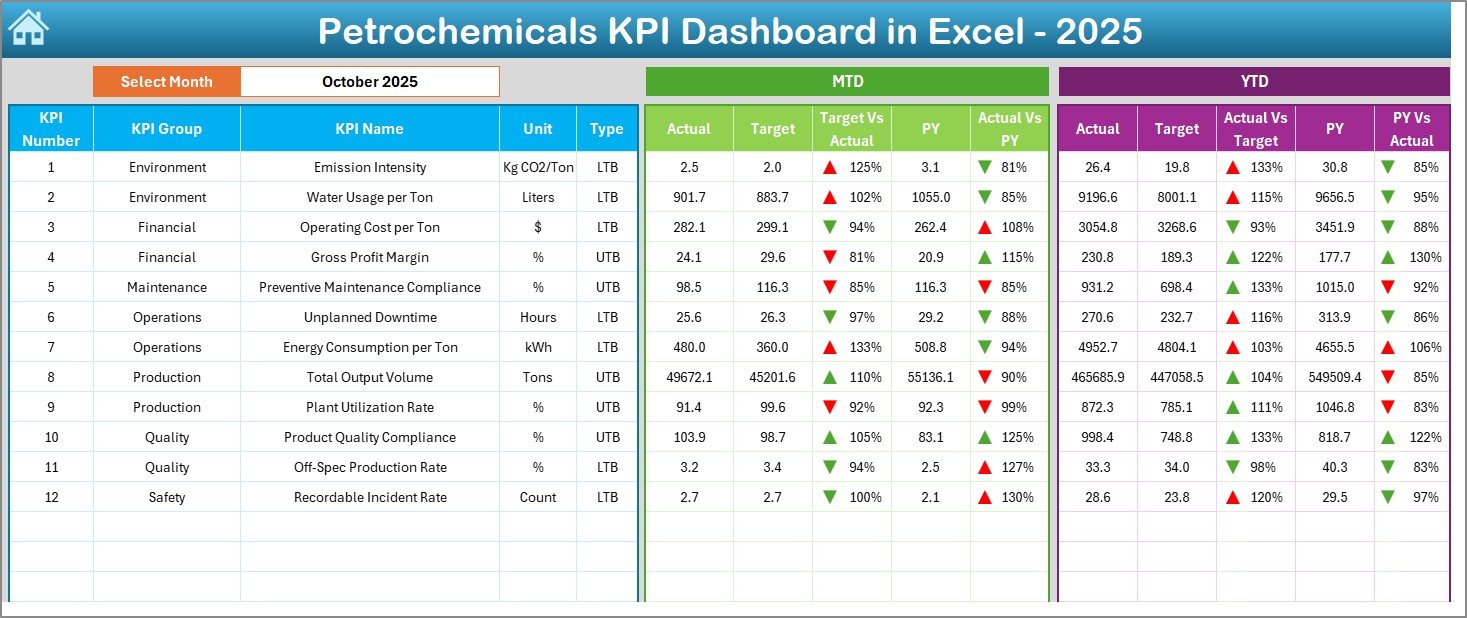
Dashboard Sheet – Main Performance View
The Dashboard Sheet serves as the core analysis page.
On cell D3, users select a month from a dropdown list. Immediately, the entire dashboard updates automatically.
Performance Metrics Displayed
- MTD (Month-to-Date) Actual
- MTD Target
- Previous Year comparison
- YTD Actual performance
- YTD Target values
- Year-over-Year comparison
Additionally, conditional formatting arrows indicate performance trends:
- ⬆ Up arrow for improvement
- ⬇ Down arrow for decline
Therefore, managers instantly understand KPI status without deep analysis.
Click to buy Petrochemicals KPI Dashboard in Excel
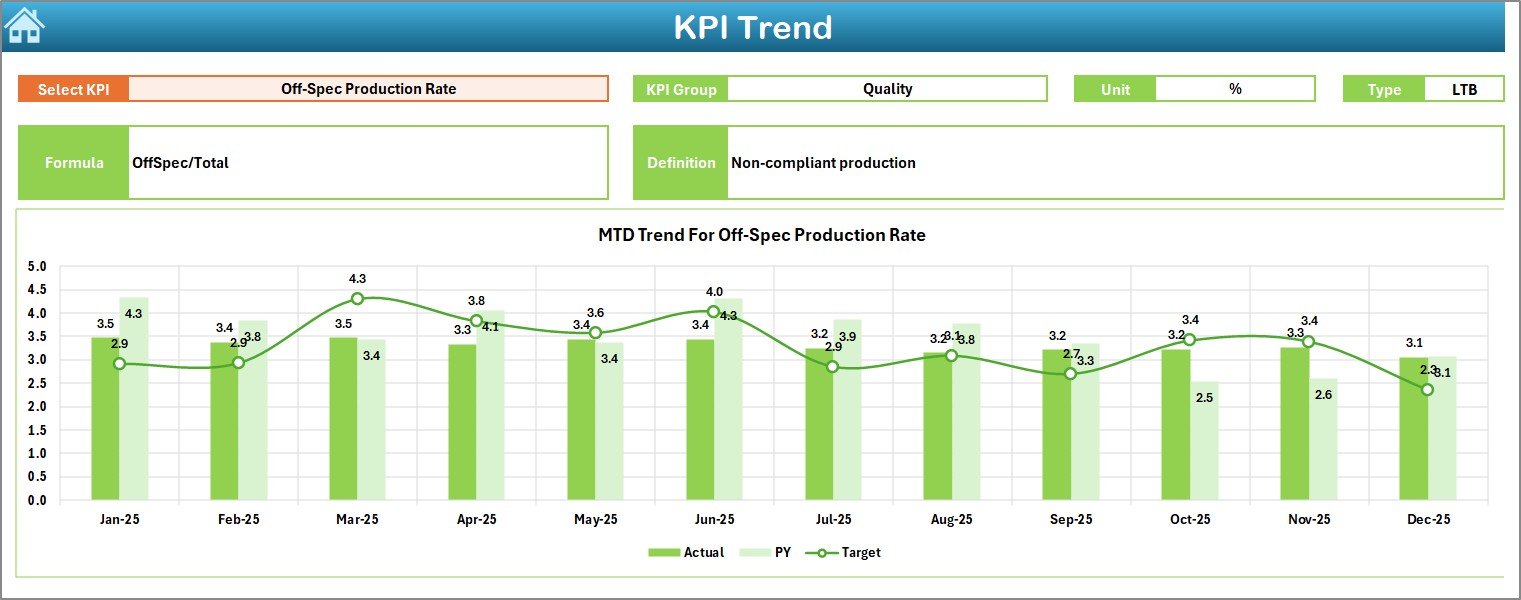
Trend Sheet – KPI Performance Analysis
The Trend Sheet helps users analyze performance patterns over time.
Users select a KPI from dropdown cell C3, and the dashboard automatically displays detailed information.
Information Displayed
- KPI Group
- KPI Unit
- KPI Type (LTB or UTB)
- KPI Formula
- KPI Definition
Moreover, the sheet shows:
- MTD trend charts
- YTD trend charts
- Actual vs Target comparison
- Previous Year trends
Consequently, users identify performance patterns and forecast future outcomes.
Click to buy Petrochemicals KPI Dashboard in Excel
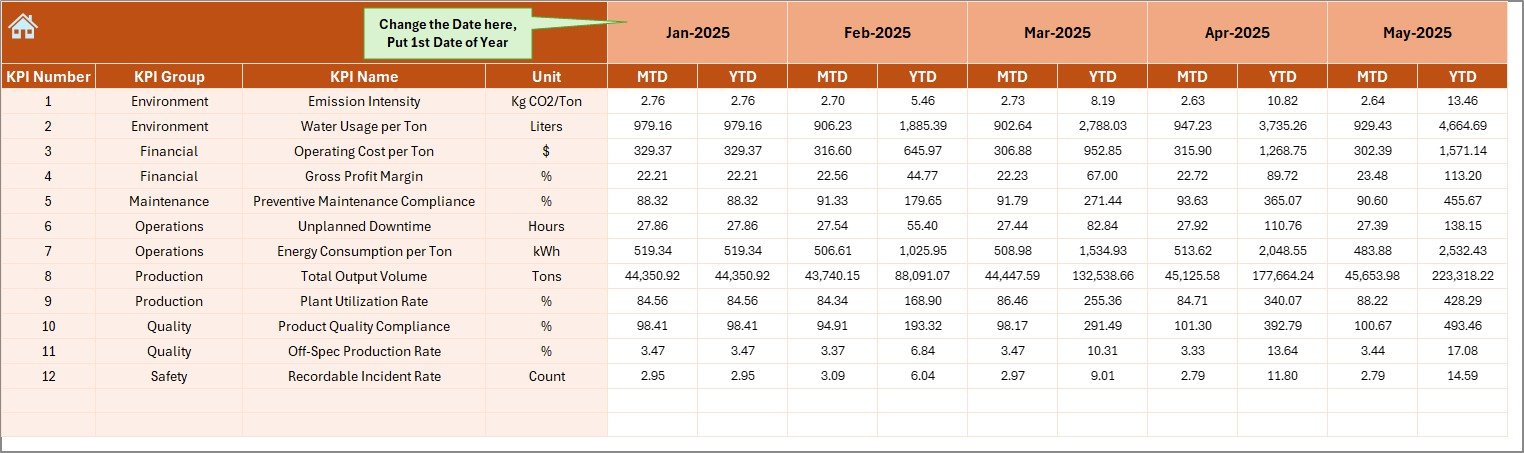
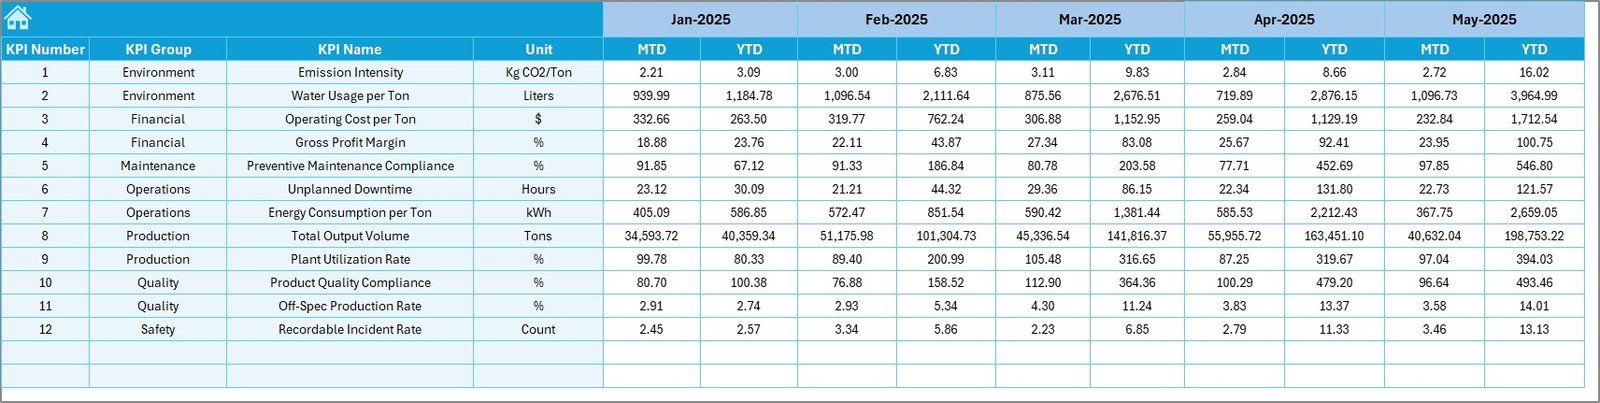
Actual Numbers Input Sheet – Data Entry Section
This sheet acts as the primary data entry location.
Users enter actual operational values for each KPI.
Important functionality:
- Change the reporting month using cell E1
- Enter MTD and YTD values
- Maintain structured monthly tracking
Because data entry remains centralized, reporting accuracy improves significantly.
Click to buy Petrochemicals KPI Dashboard in Excel
Target Sheet – Performance Benchmarking
The Target Sheet stores KPI targets for each month.
Here, users define expected performance levels.
Users input:
- Monthly MTD targets
- Monthly YTD targets
Therefore, the dashboard automatically calculates performance gaps between actual results and targets.
Click to buy Petrochemicals KPI Dashboard in Excel
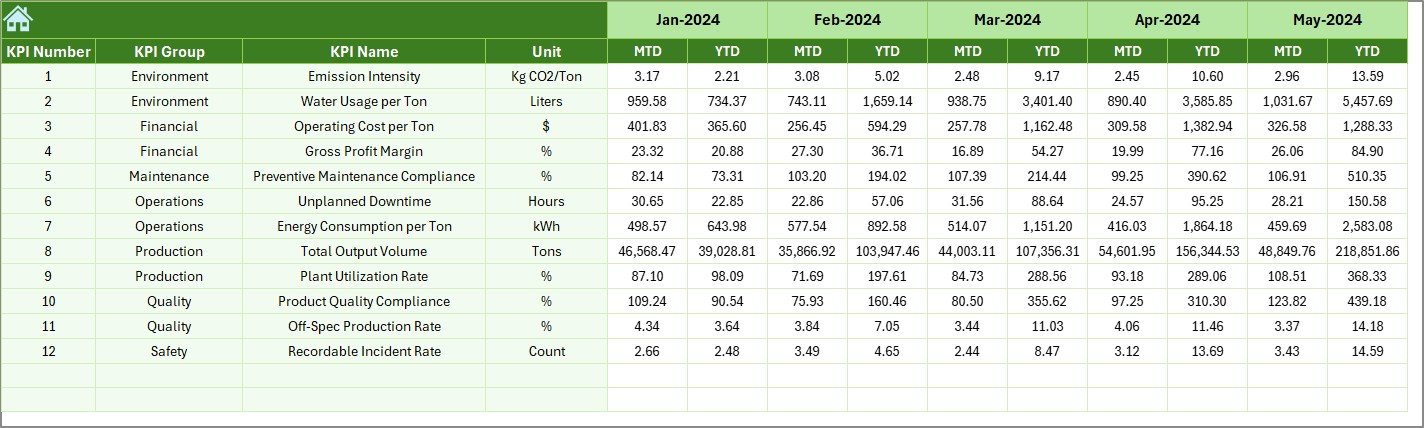
Previous Year Numbers Sheet – Historical Comparison
Historical comparison plays a vital role in performance evaluation.
In this sheet, users enter previous year KPI data similar to current-year inputs.
Benefits include:
- Year-over-year performance analysis
- Trend identification
- Strategic planning support
As a result, companies evaluate long-term operational improvement.
Click to buy Petrochemicals KPI Dashboard in Excel
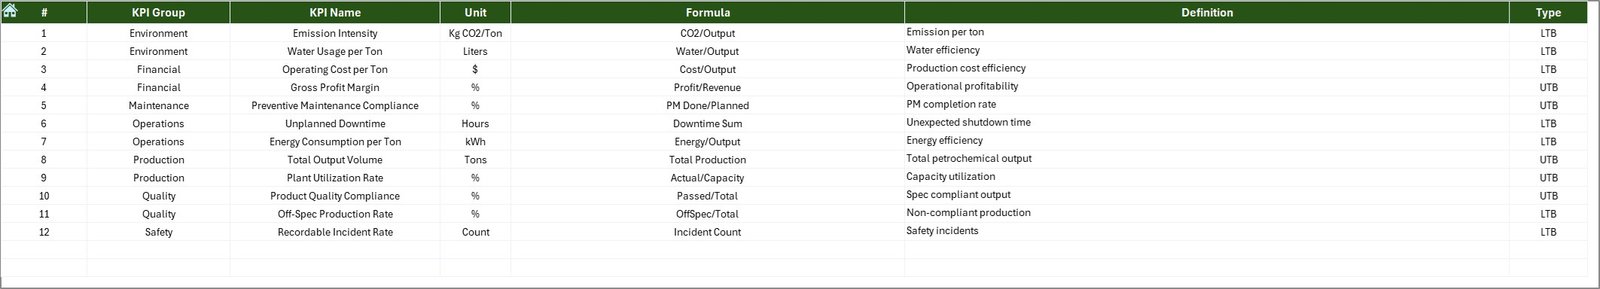
KPI Definition Sheet – KPI Governance Structure
The KPI Definition Sheet acts as the KPI master database.
Users define:
- KPI Name
- KPI Group
- Unit of Measurement
- Formula
- KPI Definition
This structure ensures KPI standardization across departments.
Therefore, reporting consistency increases across the organization.
Click to buy Petrochemicals KPI Dashboard in Excel
What KPIs Can Be Tracked in a Petrochemicals Dashboard?
Petrochemical companies can monitor multiple performance categories.
Production KPIs
- Plant utilization rate
- Production volume
- Yield efficiency
- Throughput rate
Maintenance KPIs
- Equipment downtime
- Mean time between failures
- Maintenance cost ratio
Safety KPIs
- Incident frequency rate
- Safety compliance percentage
- Lost time injury rate
Energy & Environmental KPIs
- Energy consumption per unit
- Emission levels
- Waste reduction rate
Financial KPIs
- Cost per ton production
- Revenue per unit
- Operating margin
Because all KPIs remain centralized, performance monitoring becomes simpler.
Advantages of Petrochemicals KPI Dashboard in Excel
Organizations gain several strategic benefits when they implement this dashboard.
Centralized Performance Monitoring
Managers access all KPIs from one location. Therefore, reporting becomes faster and clearer.
Improved Decision-Making
Real-time comparisons help leaders take immediate corrective actions.
Easy Implementation
Excel-based design removes the need for expensive software.
Automated Calculations
The dashboard automatically updates performance metrics after data entry.
Better Trend Analysis
Historical and current data comparisons reveal performance patterns.
Increased Operational Transparency
Teams understand performance expectations clearly.
How Does the Dashboard Improve Operational Efficiency?
The dashboard improves efficiency through structured analytics.
First, it eliminates manual calculations.
Next, it standardizes KPI definitions.
Then, it visualizes performance trends clearly.
Finally, it enables faster management responses.
Because leaders receive timely insights, operational bottlenecks reduce significantly.
How to Implement the Petrochemicals KPI Dashboard in Excel?
Follow these steps to implement the dashboard successfully.
Step 1: Define KPIs
Identify operational, safety, and financial KPIs relevant to your plant.
Step 2: Enter KPI Definitions
Add KPI details in the KPI Definition Sheet.
Step 3: Input Targets
Enter monthly targets in the Target Sheet.
Step 4: Add Actual Data
Input operational values in the Actual Numbers sheet.
Step 5: Enter Historical Data
Add previous-year performance values.
Step 6: Analyze Dashboard
Select the month and review performance indicators.
Because the workflow remains structured, implementation becomes quick and easy.
Who Can Benefit from This Dashboard?
Many professionals within petrochemical organizations can use this system.
- Plant Managers
- Operations Managers
- Production Engineers
- Maintenance Teams
- Safety Officers
- Finance Analysts
- Senior Executives
Each stakeholder gains role-specific insights.
Best Practices for the Petrochemicals KPI Dashboard in Excel
To achieve maximum value, organizations should follow best practices.
Maintain Accurate Data Entry
Always validate data before entering it.
Update Data Regularly
Update KPIs monthly to maintain dashboard accuracy.
Use Standard KPI Definitions
Avoid inconsistent KPI calculations across departments.
Review Trends Frequently
Analyze trends instead of focusing only on monthly values.
Set Realistic Targets
Targets should challenge teams but remain achievable.
Train Users Properly
Provide basic dashboard training for employees.
Following these practices ensures long-term success.
Common Mistakes to Avoid While Using KPI Dashboards
Even powerful dashboards fail when users make avoidable mistakes.
- Entering incomplete data
- Using unclear KPI definitions
- Ignoring historical comparisons
- Setting unrealistic targets
- Updating data irregularly
Therefore, organizations must establish clear reporting processes.
Why Choose Excel for Petrochemical KPI Monitoring?
Although many BI tools exist, Excel remains highly effective.
Reasons Excel Works Well
- Widely available software
- Easy customization
- Low implementation cost
- Familiar interface
- Flexible data modeling
- Strong charting capabilities
Consequently, teams adopt dashboards faster without technical barriers.
Future Scope of KPI Dashboards in Petrochemicals
The petrochemical industry continues evolving toward digital transformation.
In the future, dashboards will integrate with:
- IoT production sensors
- ERP systems
- Predictive analytics
- AI-driven forecasting
- Real-time plant monitoring
However, Excel dashboards still serve as the foundational analytics layer for many organizations.
Conclusion
The Petrochemicals KPI Dashboard in Excel provides a powerful yet simple solution for monitoring operational performance. It combines structured data entry, automated calculations, visual analytics, and trend monitoring into one centralized system.
Because petrochemical operations demand precision and efficiency, organizations must rely on data-driven performance tracking. This dashboard helps companies measure results, identify improvement opportunities, and make informed decisions quickly.
Moreover, its user-friendly Excel design ensures easy adoption across departments. Therefore, companies improve productivity, reduce risks, and strengthen operational control.
In today’s competitive industrial environment, organizations that measure performance effectively always stay ahead.
Frequently Asked Questions (FAQs)
What is a KPI dashboard in petrochemicals?
A petrochemicals KPI dashboard tracks operational, safety, production, and financial metrics in one centralized reporting system.
Why should petrochemical companies use KPI dashboards?
They improve performance visibility, support faster decisions, and enhance operational efficiency.
Can beginners use this Excel dashboard?
Yes. The dashboard uses a user-friendly structure, dropdown selections, and guided data entry sheets.
How often should KPI data be updated?
Organizations should update data monthly for accurate performance monitoring.
What is the difference between MTD and YTD?
- MTD shows performance for the current month.
- YTD shows cumulative performance from the start of the year.
Can this dashboard be customized?
Yes. Users can add new KPIs, charts, or performance categories based on business needs.
Is Excel suitable for industrial performance tracking?
Yes. Excel provides flexibility, automation, and visualization capabilities suitable for KPI monitoring.
Visit our YouTube channel to learn step-by-step video tutorials
Watch the step-by-step video tutorial:
Click to buy Petrochemicals KPI Dashboard in Excel