Running a photography business is not only about creativity and capturing beautiful moments. It is also about managing performance, tracking results, and ensuring growth. In today’s competitive world, photographers and studios must balance their artistic side with strong business management practices. That’s where a Photography KPI Dashboard in Excel comes into play.
This ready-to-use dashboard helps photographers track essential metrics, monitor progress against goals, and make data-driven decisions. By combining key performance indicators (KPIs) with easy-to-read visuals, the dashboard offers a clear picture of the business’s health.
In this article, we will explore everything about the Photography KPI Dashboard in Excel. You’ll learn its features, benefits, use cases, and best practices. We’ll also discuss why KPIs matter for photography businesses and how you can use this dashboard to improve performance.
Click to Purchases Photography KPI Dashboard in Excel
What Is a Photography KPI Dashboard?
A Photography KPI Dashboard is a structured Excel tool that tracks, analyzes, and visualizes key performance indicators for photographers, studios, or creative agencies.
It goes beyond basic data entry and provides actionable insights. Whether you are a freelance photographer, a wedding studio, or a corporate photography service, this dashboard ensures you measure what truly matters—such as client bookings, revenue growth, customer satisfaction, and delivery timelines.
Key Features of the Photography KPI Dashboard in Excel
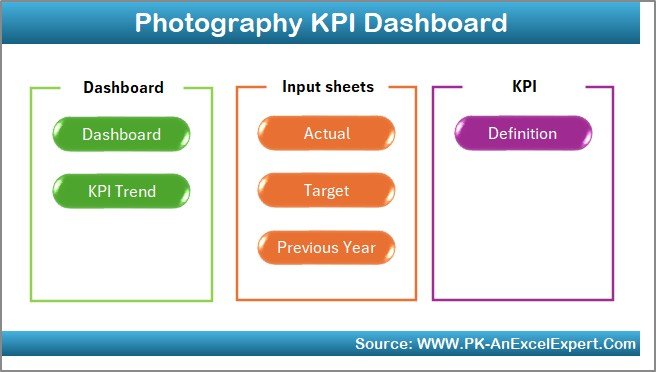
This dashboard comes with seven structured worksheet tabs to make navigation and data management simple. Let’s look at each one in detail:
Home Sheet
-
Works as the index page of the file.
-
Includes six buttons for quick navigation to other sheets.
-
Saves time by avoiding manual scrolling between sheets.
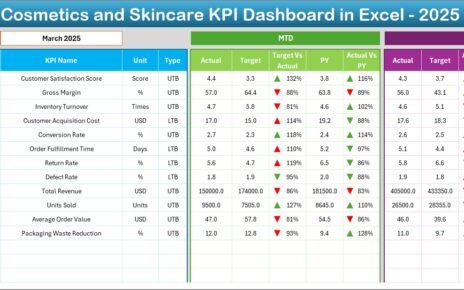
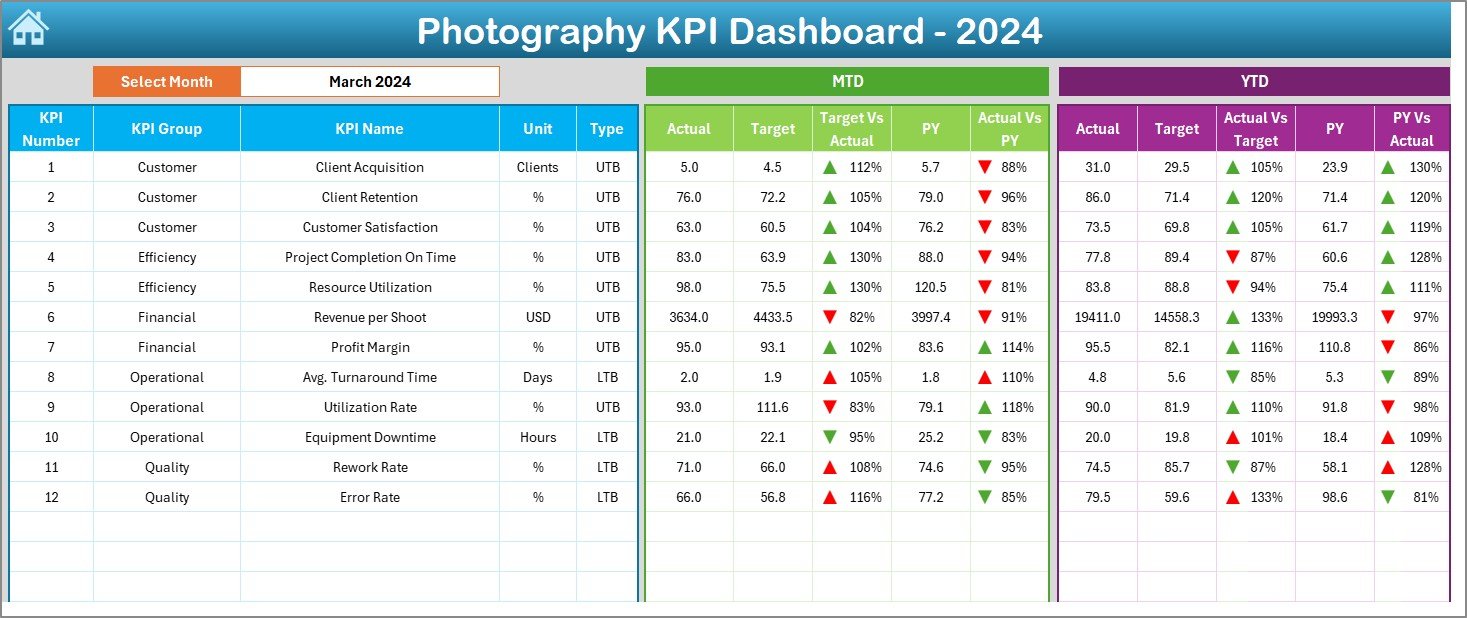
Dashboard Sheet
-
This is the main page of the tool.
-
You can select a month from the drop-down menu in cell D3.
-
Displays updated data instantly for that month.
-
Shows Month-to-Date (MTD) and Year-to-Date (YTD) performance.
-
Compares Actual vs Target and Actual vs Previous Year (PY) with clear conditional formatting.
-
Up and down arrows indicate performance trends visually.
Click to Purchases Photography KPI Dashboard in Excel
KPI Trend Sheet
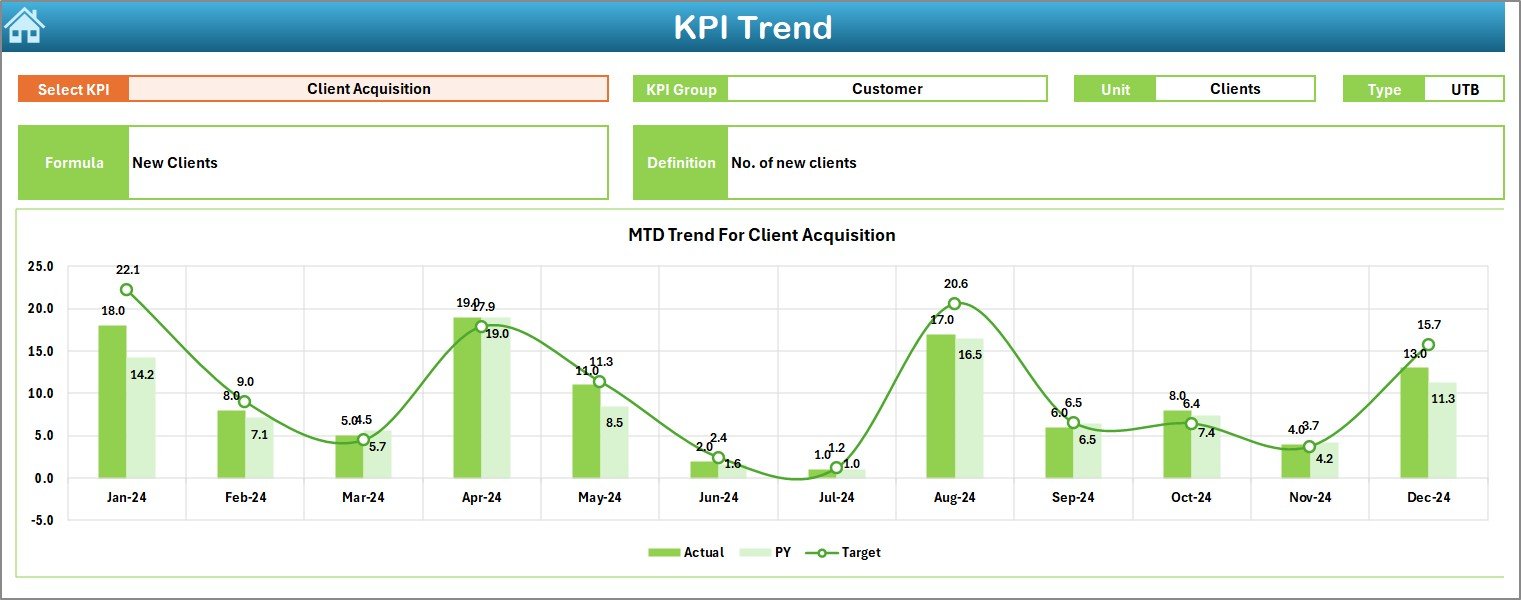
-
Lets you select a specific KPI using a drop-down menu in cell C3.
-
Displays details such as KPI group, unit, formula, and type (Lower the Better or Upper the Better).
-
Includes trend charts for MTD and YTD to compare Actual, Target, and PY data.
-
Helps in understanding long-term progress.
Actual Numbers Input Sheet
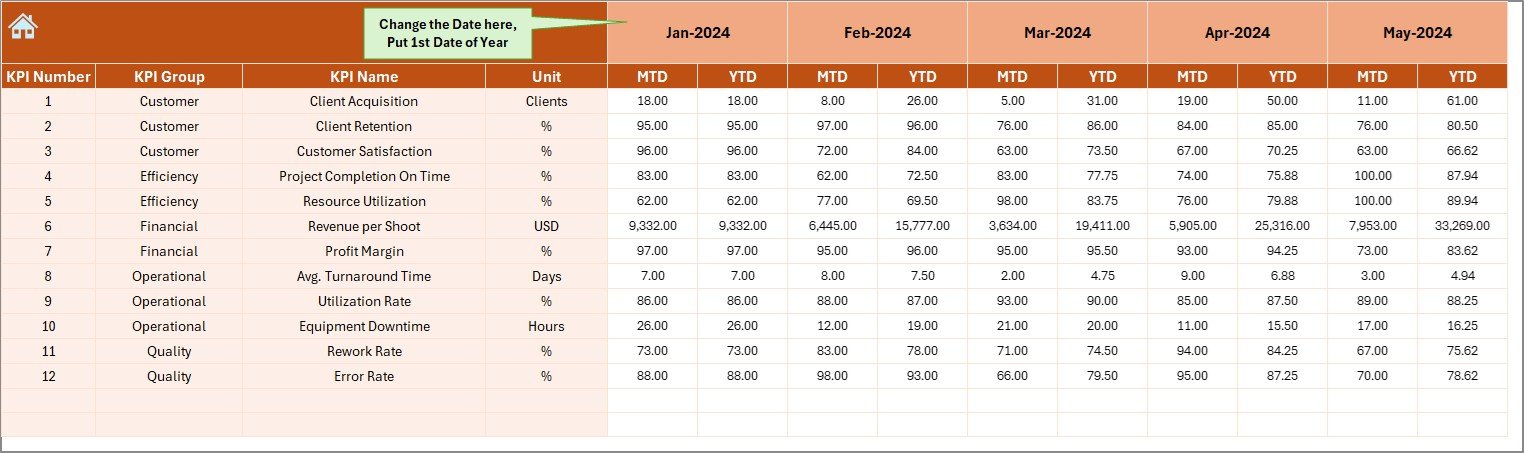
-
A structured place to enter monthly actual data.
-
YTD and MTD figures can be updated quickly.
-
Month selection is available in cell E1.
-
Ensures accurate and consistent data entry.
Target Sheet
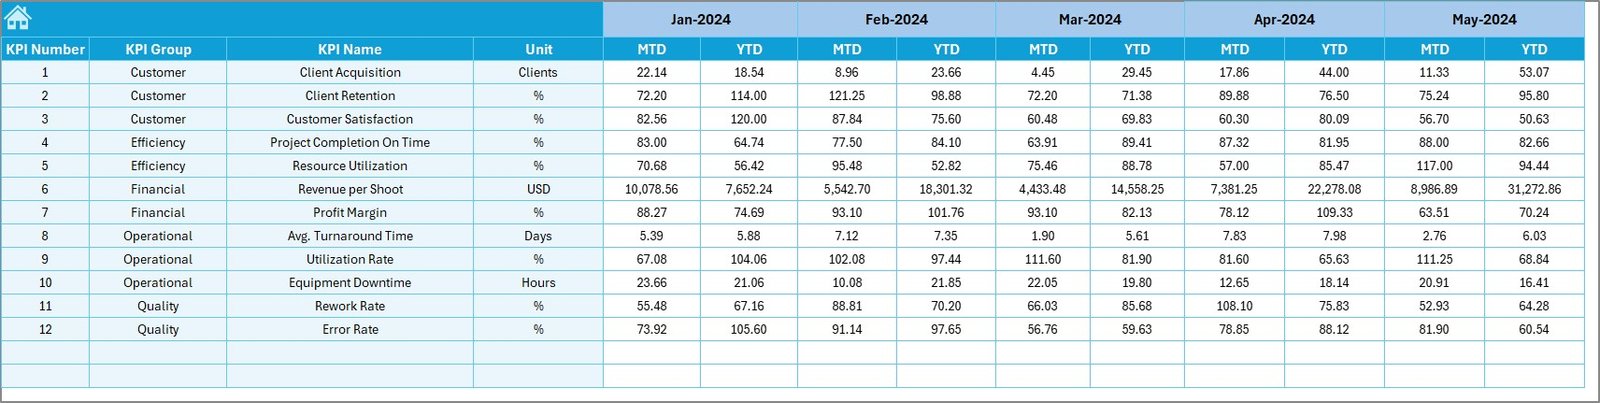
-
Designed to record targets for each KPI.
-
Includes both MTD and YTD targets.
-
Serves as the benchmark to evaluate actual results.
Previous Year Numbers Sheet
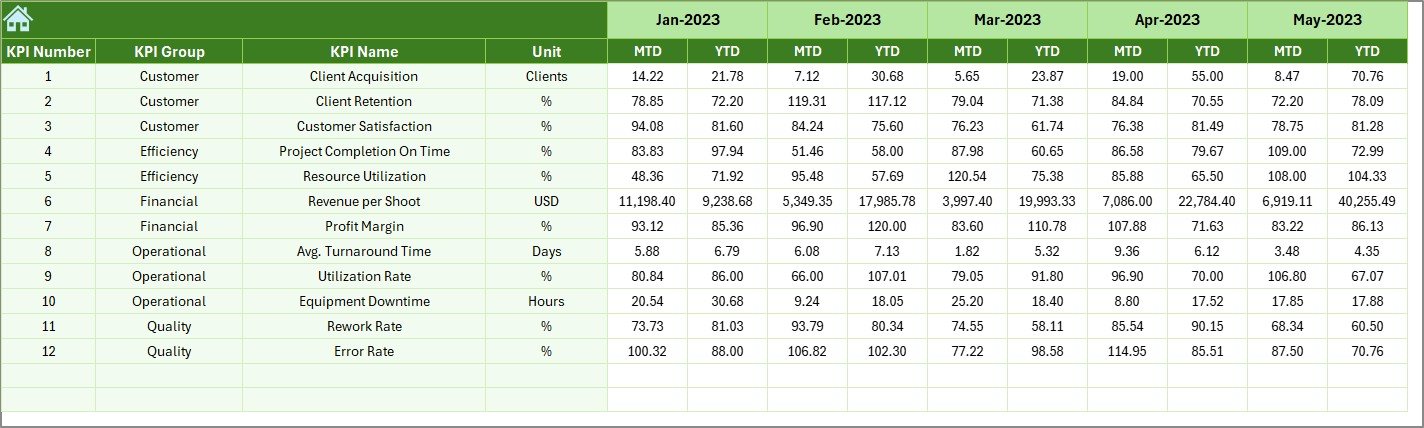
-
Stores last year’s KPIs in the same structure as current year.
-
Useful for comparing YoY performance.
-
Highlights business growth or decline with evidence.
KPI Definition Sheet
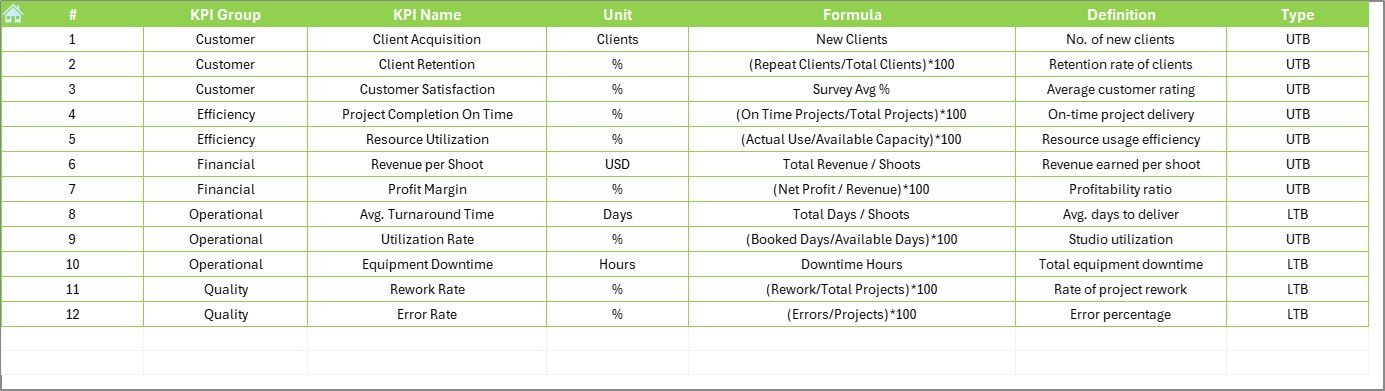
-
Lists all KPIs with their group, unit, formula, and definitions.
-
Helps in standardizing measurement across teams.
-
Ensures everyone understands how performance is calculated.
Why Do Photographers Need a KPI Dashboard?
Many photographers track projects and clients informally—sometimes on paper, sometimes in multiple apps. This often leads to missed insights and inefficiencies.
A KPI dashboard in Excel brings everything into one place. It helps photographers:
-
Track client bookings and cancellations.
-
Compare revenue against targets.
-
Monitor editing and delivery timelines.
-
Assess customer satisfaction.
-
Optimize expenses and profits.
With all this data, decisions become clear, quick, and fact-based.
Advantages of a Photography KPI Dashboard in Excel
Using this dashboard comes with several benefits. Let’s break them down:
✅ Centralized Data: All key metrics in one file.
✅ Simple Interface: User-friendly with drop-downs and buttons.
✅ Real-Time Monitoring: Instant updates with month selection.
✅ Customizable: Add or remove KPIs as per business needs.
✅ Cost-Effective: Built in Excel—no need for expensive tools.
✅ Data-Driven Insights: Clear visualizations for decision-making.
✅ Performance Tracking: Compare results against targets and last year.
✅ Better Accountability: Assign responsibility for each KPI.
Which KPIs Should You Track in Photography?
Every photography business is unique, but some KPIs remain common across the industry. Here are a few examples:
📸 Client Bookings per Month – Number of confirmed photography sessions.
💰 Revenue Growth – Monthly and yearly earnings compared to targets.
🕒 Average Delivery Time – Days taken to deliver final images to clients.
🎯 Project Completion Rate – Percentage of projects delivered on time.
⭐ Customer Satisfaction Score – Client feedback ratings.
📷 Utilization Rate – Time spent on photography vs. editing vs. admin tasks.
💼 Repeat Client Ratio – How many clients return for new bookings.
By adding these KPIs into the dashboard, you’ll gain a complete view of your business performance.
How to Use the Photography KPI Dashboard Effectively
Click to Purchases Photography KPI Dashboard in Excel
Here’s a step-by-step process:
Set Up the Dashboard
- Define KPIs in the KPI Definition sheet.
- Enter last year’s numbers in the Previous Year sheet.
Input Data Monthly
- Record actual performance in the Actual Numbers Input sheet.
- Update targets in the Target sheet.
Review Performance
- Open the Dashboard sheet and select the month.
- Analyze Actual vs Target and YoY performance.
Track Trends
- Use the KPI Trend sheet for monthly and yearly analysis.
Take Action
- Identify gaps where actuals fall below targets.
- Improve operations to close those gaps.
Opportunities for Improvement
Even with a great dashboard, there are always ways to improve. Consider these:
📊 Automate data entry with tools like Power Query or macros.
🔗 Link the dashboard with booking systems or CRM for live updates.
🎨 Customize visuals to match your studio’s branding.
🌍 Expand KPIs to include marketing performance (website visits, social media leads).
📈 Introduce advanced charts for deeper analysis.
Best Practices for the Photography KPI Dashboard
To make the most of this tool, follow these best practices:
✔ Keep It Simple: Use only the KPIs that matter most.
✔ Update Regularly: Enter data at least once a month.
✔ Involve the Team: Share KPI ownership with staff members.
✔ Use Conditional Formatting: Visual indicators help spot trends instantly.
✔ Review Quarterly: Compare quarterly results for strategic planning.
✔ Protect Data: Lock formulas and key cells to prevent errors.
Common Mistakes to Avoid
❌ Tracking too many KPIs at once.
❌ Forgetting to update data regularly.
❌ Ignoring customer-focused metrics.
❌ Using the dashboard only for reporting, not decision-making.
❌ Overcomplicating with unnecessary formulas.
Conclusion
The Photography KPI Dashboard in Excel is more than just a reporting tool. It is a decision-making companion for photographers and studios. By tracking KPIs like bookings, revenue, delivery timelines, and satisfaction scores, you can ensure continuous improvement and business growth.
Unlike complex software, Excel-based dashboards are simple, cost-effective, and customizable. With the right setup, photographers can balance creativity with business success.
If you want to grow your photography business, start measuring your performance today with this Photography KPI Dashboard in Excel.
Frequently Asked Questions (FAQs)
1. What is a Photography KPI Dashboard in Excel?
It is a ready-to-use Excel template that tracks and visualizes key photography metrics such as bookings, revenue, delivery time, and client satisfaction.
2. Who can use this dashboard?
Freelance photographers, studios, event photography agencies, and corporate photography teams can all benefit from this dashboard.
3. How many KPIs should I track?
It is best to start with 8–12 KPIs that directly impact your business, and expand as needed.
4. Can I customize the dashboard?
Yes, you can add or remove KPIs, modify formulas, or change chart types to fit your business needs.
5. How often should I update the data?
At least once a month. However, weekly updates can give you more timely insights.
6. Does this dashboard require advanced Excel skills?
No. It is designed for ease of use. Basic Excel knowledge is enough to manage and update it.
7. What makes this dashboard different from other tools?
It is built in Excel, which is affordable, customizable, and does not require additional software licenses.
Visit our YouTube channel to learn step-by-step video tutorials
Click to Purchases Photography KPI Dashboard in Excel