Managing a physiotherapy and rehabilitation center requires more than clinical expertise. You must also track patient progress, treatment efficiency, therapist performance, and financial health. However, when data remains scattered across spreadsheets and systems, decision-making becomes slow and unclear. Therefore, healthcare leaders increasingly rely on a Physiotherapy and Rehabilitation Dashboard in Power BI to convert raw data into actionable insights.
In this in-depth guide, you will learn what a Physiotherapy and Rehabilitation Dashboard in Power BI is, why it matters, how it works, its page-wise structure, advantages, best practices, and frequently asked questions. Moreover, this article explains how a ready-to-use Power BI dashboard helps clinics, hospitals, and rehabilitation centers improve outcomes while controlling costs.
Click to Purchases Physiotherapy and Rehabilitation Dashboard in Power BI
What Is a Physiotherapy and Rehabilitation Dashboard in Power BI?
A Physiotherapy and Rehabilitation Dashboard in Power BI is an interactive reporting solution that visually tracks key operational, clinical, and financial metrics of physiotherapy services. Instead of reviewing multiple reports, managers and clinicians can monitor performance from a single dashboard.
Because Power BI supports dynamic filters, drill-downs, and real-time updates, this dashboard provides fast and accurate insights. As a result, decision-makers can analyze treatments, conditions, therapists, and monthly trends with confidence.
Key Objectives of This Dashboard
-
Monitor treatment completion and ongoing cases
-
Compare planned sessions versus completed sessions
-
Analyze treatment costs across conditions and therapists
-
Evaluate therapist productivity and workload
-
Track month-wise trends for better planning
Why Do Physiotherapy and Rehabilitation Centers Need a Dashboard?
Physiotherapy centers manage high patient volumes, multiple treatment plans, and diverse therapists. Therefore, manual tracking often leads to errors, delays, and missed insights. A Power BI dashboard solves these challenges efficiently.
Common Challenges Without a Dashboard
-
Difficulty tracking ongoing and completed treatments
-
Limited visibility into therapist performance
-
Poor cost control across treatment types
-
Time-consuming manual reporting
-
Inconsistent decision-making
How a Power BI Dashboard Solves These Problems
-
Centralizes all data in one place
-
Updates metrics automatically
-
Provides visual comparisons and trends
-
Supports faster and data-driven decisions
How Does a Physiotherapy and Rehabilitation Dashboard in Power BI Work?
The dashboard connects to structured data sources such as Excel files, hospital systems, or databases. After data modeling, Power BI applies measures, calculations, and relationships. Then, interactive visuals display KPIs, charts, and trends.
Because slicers allow filtering by city, condition, therapist, treatment type, and month, users can analyze data from multiple angles instantly.
Page-Wise Structure of the Physiotherapy and Rehabilitation Dashboard in Power BI
This ready-to-use dashboard includes 5 powerful pages, each designed for a specific type of analysis.
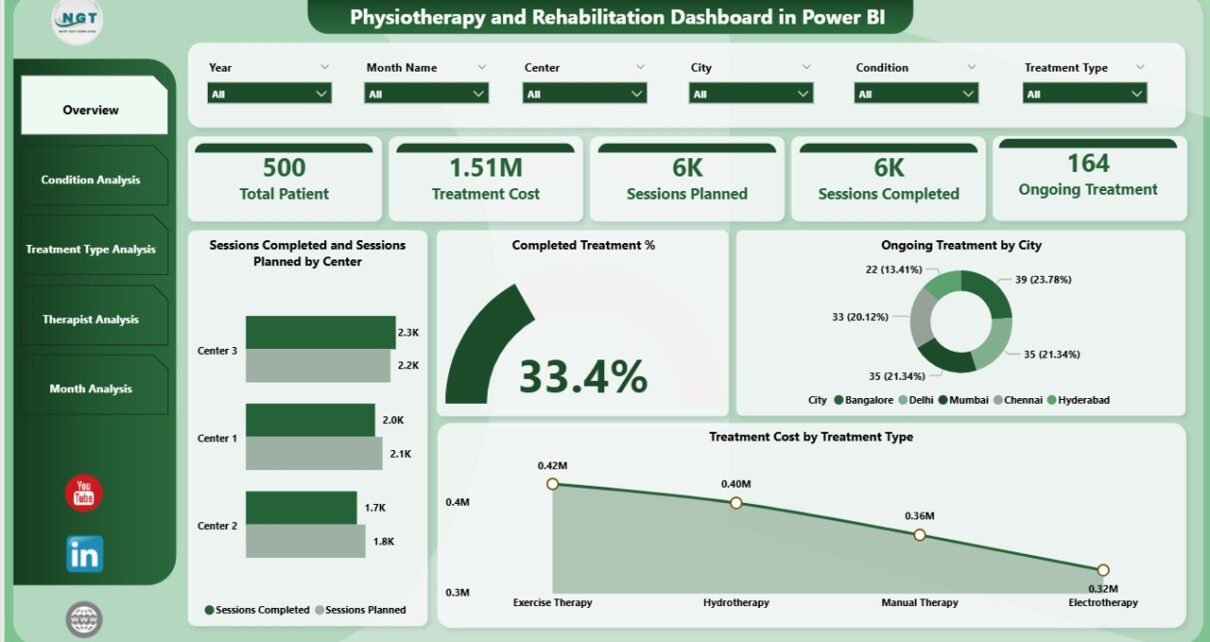
1. Overview Page: How Is Overall Performance Tracked?

The Overview Page acts as the executive summary of the dashboard. It provides a quick snapshot of overall clinic performance.
Key Features of the Overview Page
-
Interactive slicers for quick filtering
-
High-level KPIs displayed as cards
-
Visual comparison of sessions and costs
KPIs and Charts on the Overview Page
-
Completed Treatment %
-
Shows the percentage of treatments successfully completed
-
-
Ongoing Treatment % by City
-
Highlights active treatments across locations
-
-
Sessions Planned vs Sessions Completed by Centre
-
Identifies gaps in treatment execution
-
-
Treatment Cost by Treatment Type
-
Displays cost distribution across therapies
-
Why the Overview Page Matters
Because leaders need instant clarity, this page helps them assess performance in seconds. Moreover, it supports quick corrective actions when targets fall short.
2. Condition Analysis Page: Which Conditions Need Attention?
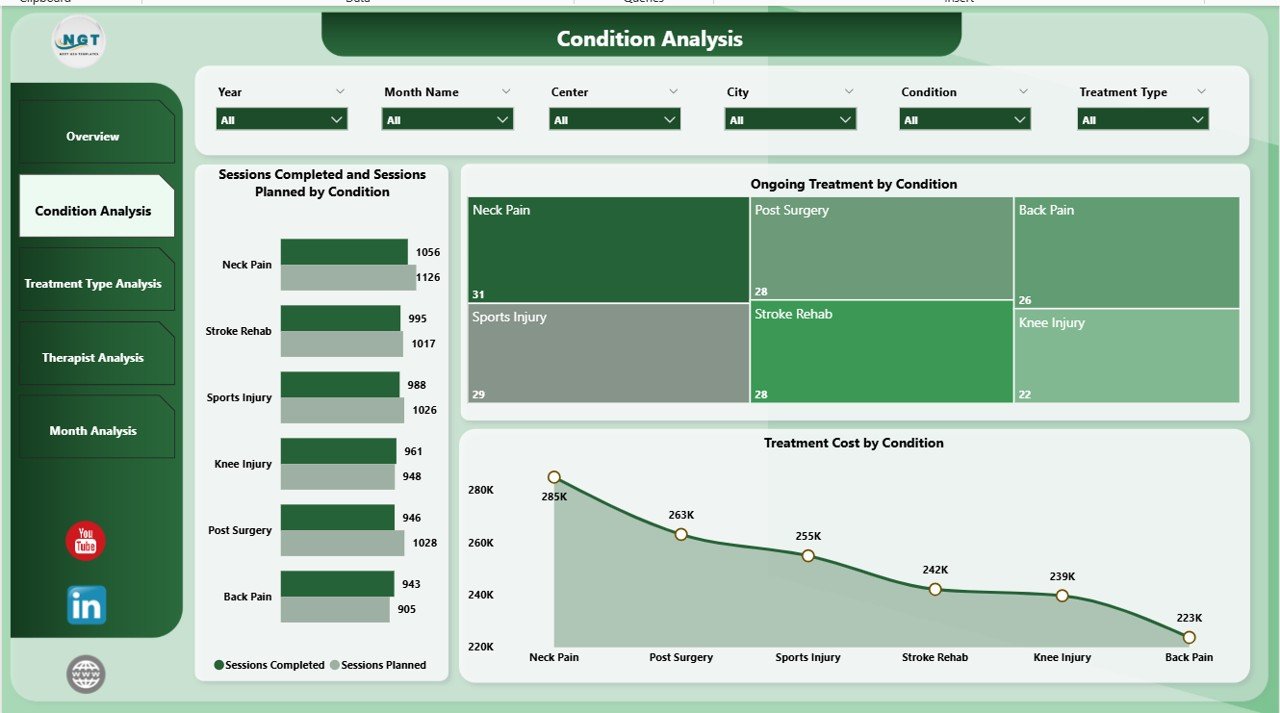
The Condition Analysis Page focuses on patient conditions and their treatment efficiency. This view helps clinics prioritize resources and optimize care plans.
Charts Available on the Condition Analysis Page
-
Sessions Planned vs Sessions Completed by Condition
-
Ongoing Treatment by Condition
-
Treatment Cost by Condition
How This Page Adds Value
-
Identifies conditions with low completion rates
-
Highlights high-cost conditions
-
Supports evidence-based treatment planning
As a result, clinics can improve outcomes while managing expenses effectively.
Click to Purchases Physiotherapy and Rehabilitation Dashboard in Power BI
3. Treatment Type Analysis Page: Which Therapies Perform Best?
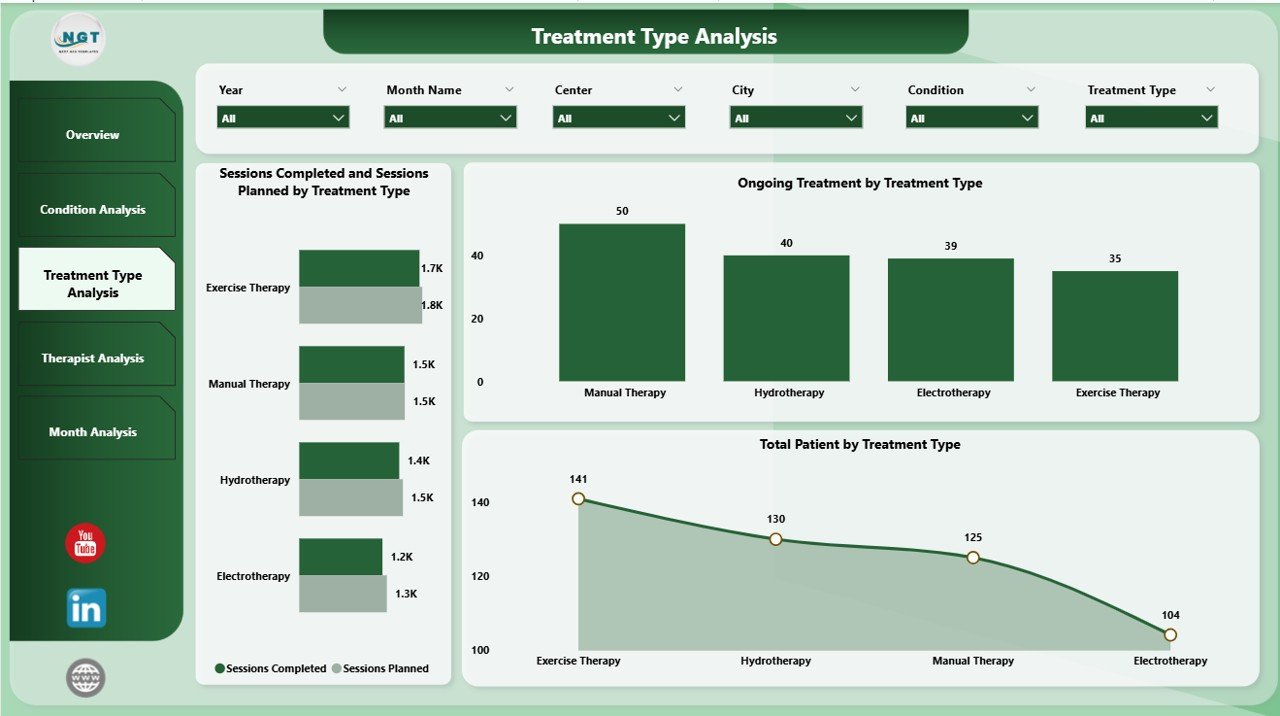
The Treatment Type Analysis Page evaluates different physiotherapy treatments such as orthopedic rehab, neurological therapy, sports injury rehab, and more.
Key Visuals on This Page
-
Sessions Planned vs Sessions Completed by Treatment Type
-
Ongoing Treatment by Treatment Type
-
Total Patients by Treatment Type
Insights You Can Derive
-
Popular treatment types among patients
-
Therapies with execution delays
-
Demand patterns across treatments
Therefore, clinics can adjust staffing, equipment, and scheduling based on real demand.
4. Therapist Analysis Page: How Do Therapists Perform?

The Therapist Analysis Page measures individual therapist performance. Because therapists play a critical role in patient recovery, this analysis becomes essential.
Charts Included on Therapist Analysis Page
-
Sessions Planned vs Sessions Completed by Therapist
-
Ongoing Treatment by Therapist
-
Treatment Cost by Therapist
Why Therapist Analysis Is Important
-
Identifies top-performing therapists
-
Detects workload imbalance
-
Supports fair performance evaluation
Consequently, management can improve productivity and staff satisfaction.
5. Month Analysis Page: What Are the Monthly Trends?

The Month Analysis Page tracks performance trends over time. This view supports forecasting and capacity planning.
Monthly Charts Available
-
Sessions Planned vs Sessions Completed by Month
-
Ongoing Treatment by Month
-
Treatment Cost by Month
Benefits of Monthly Analysis
-
Identifies seasonal demand patterns
-
Tracks improvement over time
-
Supports budgeting and planning
Thus, clinics can plan staffing and resources proactively.
Advantages of Physiotherapy and Rehabilitation Dashboard in Power BI
Click to Purchases Physiotherapy and Rehabilitation Dashboard in Power BI
Using a Power BI dashboard offers several strategic and operational benefits.
Key Advantages
-
📊 Centralized Reporting: All metrics in one place
-
⚡ Faster Decision-Making: Real-time insights improve speed
-
🎯 Improved Patient Outcomes: Data-driven care planning
-
💰 Better Cost Control: Clear visibility into treatment expenses
-
👥 Enhanced Therapist Management: Fair and transparent evaluation
-
🔍 Deep Analysis: Drill-downs reveal root causes
Because of these advantages, clinics gain both clinical and financial control.
Who Can Use This Dashboard?
This dashboard supports multiple stakeholders across healthcare organizations.
Ideal Users
-
Physiotherapy clinic owners
-
Rehabilitation center managers
-
Hospital administrators
-
Operations and finance teams
-
Clinical leads and supervisors
Each role benefits from tailored insights without technical complexity.
Best Practices for the Physiotherapy and Rehabilitation Dashboard in Power BI
To maximize value, clinics should follow proven best practices.
Data Management Best Practices
-
Maintain clean and consistent data
-
Standardize condition and treatment names
-
Validate session counts regularly
Dashboard Design Best Practices
-
Use clear and simple visuals
-
Limit KPIs to what truly matters
-
Maintain consistent color coding
Usage Best Practices
-
Review dashboards weekly or monthly
-
Share insights with therapists and staff
-
Use trends for planning, not just reporting
When teams follow these practices, dashboards deliver lasting value.
How Does This Dashboard Improve Decision-Making?
Because data becomes visual and interactive, leaders can:
-
Identify bottlenecks instantly
-
Compare performance across centers and therapists
-
Adjust treatment plans proactively
-
Control rising costs before they escalate
As a result, decisions become faster, smarter, and more confident.
How Is Power BI Better Than Traditional Excel Reports?
Although Excel works well for data entry, Power BI excels at analytics.
Power BI vs Excel Reporting
-
Power BI handles large datasets efficiently
-
Interactive slicers enable instant filtering
-
Dashboards refresh automatically
-
Visual storytelling improves understanding
Therefore, Power BI becomes the preferred tool for advanced healthcare analytics.
How to Implement a Physiotherapy and Rehabilitation Dashboard Successfully?
Implementation becomes simple with a structured approach.
Implementation Steps
-
Identify key KPIs and goals
-
Prepare clean and structured data
-
Connect data to Power BI
-
Design dashboards page by page
-
Test insights with real users
Following these steps ensures smooth adoption and quick results.
Future Scope of Physiotherapy Analytics Using Power BI
Healthcare analytics continues to evolve. In the future, clinics can integrate:
-
Patient satisfaction scores
-
Outcome-based performance metrics
-
Predictive analytics for treatment duration
-
AI-driven recommendations
Thus, dashboards will become even more powerful and proactive.
Click to Purchases Physiotherapy and Rehabilitation Dashboard in Power BI
Conclusion: Why Should You Use a Physiotherapy and Rehabilitation Dashboard in Power BI?
A Physiotherapy and Rehabilitation Dashboard in Power BI transforms how clinics monitor performance, manage costs, and improve patient care. Because it centralizes data, simplifies analysis, and highlights trends, decision-makers gain full control over operations.
Moreover, the page-wise structure ensures clarity at every level—from executives to therapists. Therefore, if you aim to run a data-driven, efficient, and patient-focused rehabilitation center, this dashboard becomes an essential tool.
Frequently Asked Questions (FAQs)
What is a Physiotherapy and Rehabilitation Dashboard in Power BI?
It is an interactive analytics tool that tracks treatment performance, therapist productivity, patient volume, and costs using visual KPIs and charts.
Who should use this dashboard?
Clinic owners, hospital administrators, rehab managers, therapists, and finance teams can all benefit from this dashboard.
Can this dashboard handle multiple centers or cities?
Yes, slicers allow filtering by city, center, therapist, treatment type, and month.
Does the dashboard update automatically?
Yes, once connected to data sources, Power BI refreshes data automatically based on the refresh schedule.
Is Power BI suitable for healthcare analytics?
Yes, Power BI offers strong security, scalability, and visualization capabilities, making it ideal for healthcare reporting.
Can this dashboard improve patient outcomes?
Yes, because data-driven insights help optimize treatment plans, therapist allocation, and follow-up processes.
Visit our YouTube channel to learn step-by-step video tutorials