Pop-up stores are one of the fastest-growing retail trends today. Brands use them to test new markets, launch products, create customer experiences, and generate quick revenue without long-term store commitments. However, managing multiple pop-up stores becomes challenging when data is scattered across sheets—sales, staff, promotions, conversion rates, and city-wise performance.
A Pop-up Stores Dashboard in Excel solves this problem. It combines all metrics into one interactive dashboard and helps retail teams make quick and confident decisions. This guide explains how the dashboard works, what each page includes, and why every retail brand should use it.
Click to Purchases Pop-up Stores Dashboard in Excel
What Is a Pop-up Stores Dashboard in Excel?
A Pop-up Stores Dashboard in Excel is a ready-to-use reporting tool designed for retail and promotional events. It converts raw data into actionable insights using charts, KPI cards, slicers, and automated calculations. Brands use it to analyze store locations, promotions, duration, category performance, staff allocation, and revenue outcomes.
This dashboard includes:
-
Sales performance
-
Profitability
-
Staff metrics
-
Promotion type effectiveness
-
Category insights
-
City-wise analysis
-
Month-wise trend analysis
With clean visual design and easy navigation, even non-technical users understand performance instantly.
Click to Purchases Pop-up Stores Dashboard in Excel
Why Do Pop-up Stores Need a Dashboard?
Pop-up stores run for short durations and operate at high speed. Retail teams need fast performance tracking instead of waiting for month-end reports.
This dashboard helps because:
-
It highlights sales opportunities
-
It displays which cities perform best
-
It tracks promotions that boost conversions
-
It analyzes staff workload
-
It uncovers high-cost and low-profit areas
-
It shows trends across months
-
It updates automatically when new data is added
Retailers use these insights to optimize event planning, improve ROI, and scale pop-up strategies.
Key Pages in the Pop-up Stores Dashboard
The dashboard includes 5 powerful analytical pages, all connected through a Page Navigator placed on the left side. This navigator makes navigation simple and helps users switch between sheets instantly.
The five pages are:
-
Overview Page
-
City Analysis
-
Category Analysis
-
Promotion Type Analysis
-
Monthly Trends
Below is the detailed explanation of each page.
Click to Purchases Pop-up Stores Dashboard in Excel
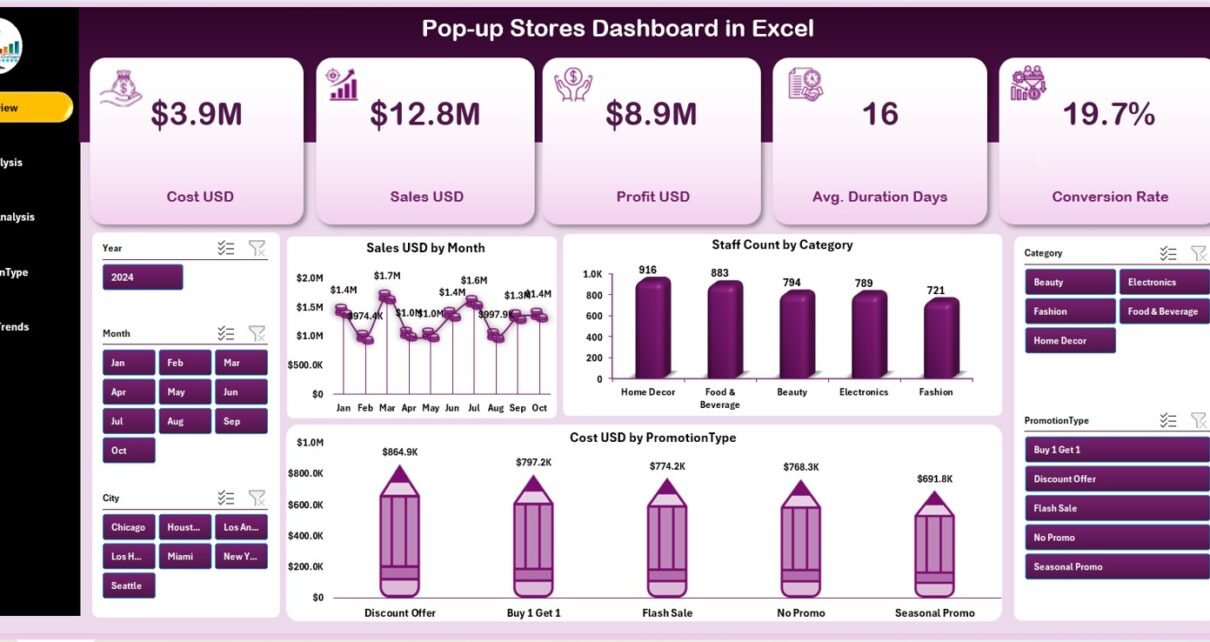
1. Overview Page – The Main Pop-up Store Summary
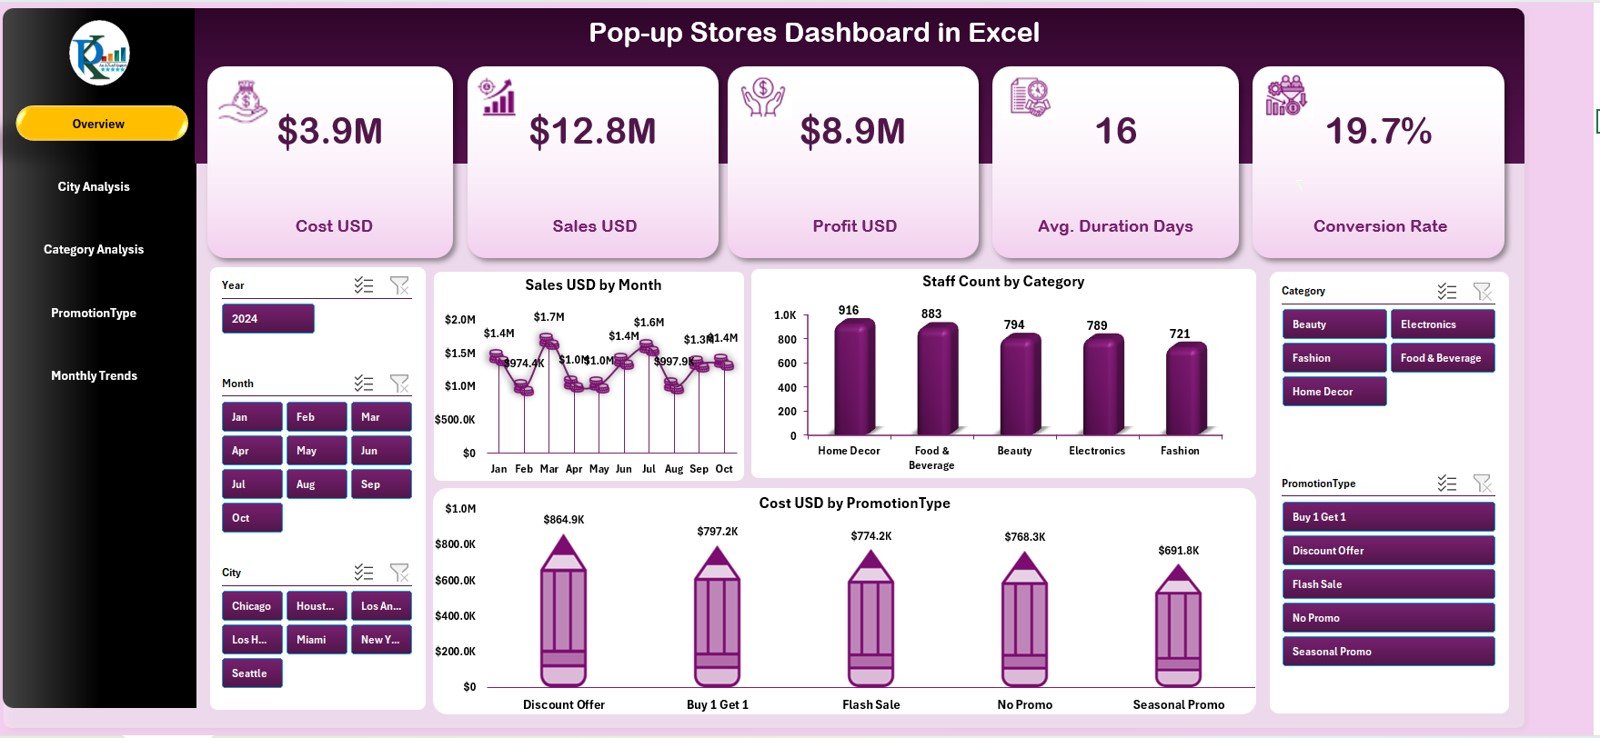
The Overview Page provides a complete snapshot of pop-up store performance. It includes:
🔹 KPI Cards (5 Cards)
These cards highlight essential metrics such as:
-
Total Sales (USD)
-
Total Profit (USD)
-
Total Staff Count
-
Cost (USD) by promotion
-
Conversion Rate
These cards instantly show how well your pop-ups are performing.
Key Charts on the Overview Page
1. Sales USD by Month
This chart shows month-wise revenue performance.
It helps answer:
-
Which month generated the most sales?
-
Are sales growing or declining?
2. Staff Count by Category
Shows the number of staff members allocated to each category, such as:
-
Sales Associates
-
Warehouse Staff
-
Marketing Staff
This helps managers identify understaffed or overstaffed areas.
3. Cost USD by Promotion Type
This chart shows the cost incurred for different promotions like:
-
Discounts
-
Buy One Get One
-
Free Samples
-
Social Media Promotions
Understanding these costs helps improve promotional budgeting.
Click to Purchases Pop-up Stores Dashboard in Excel
2. City Analysis
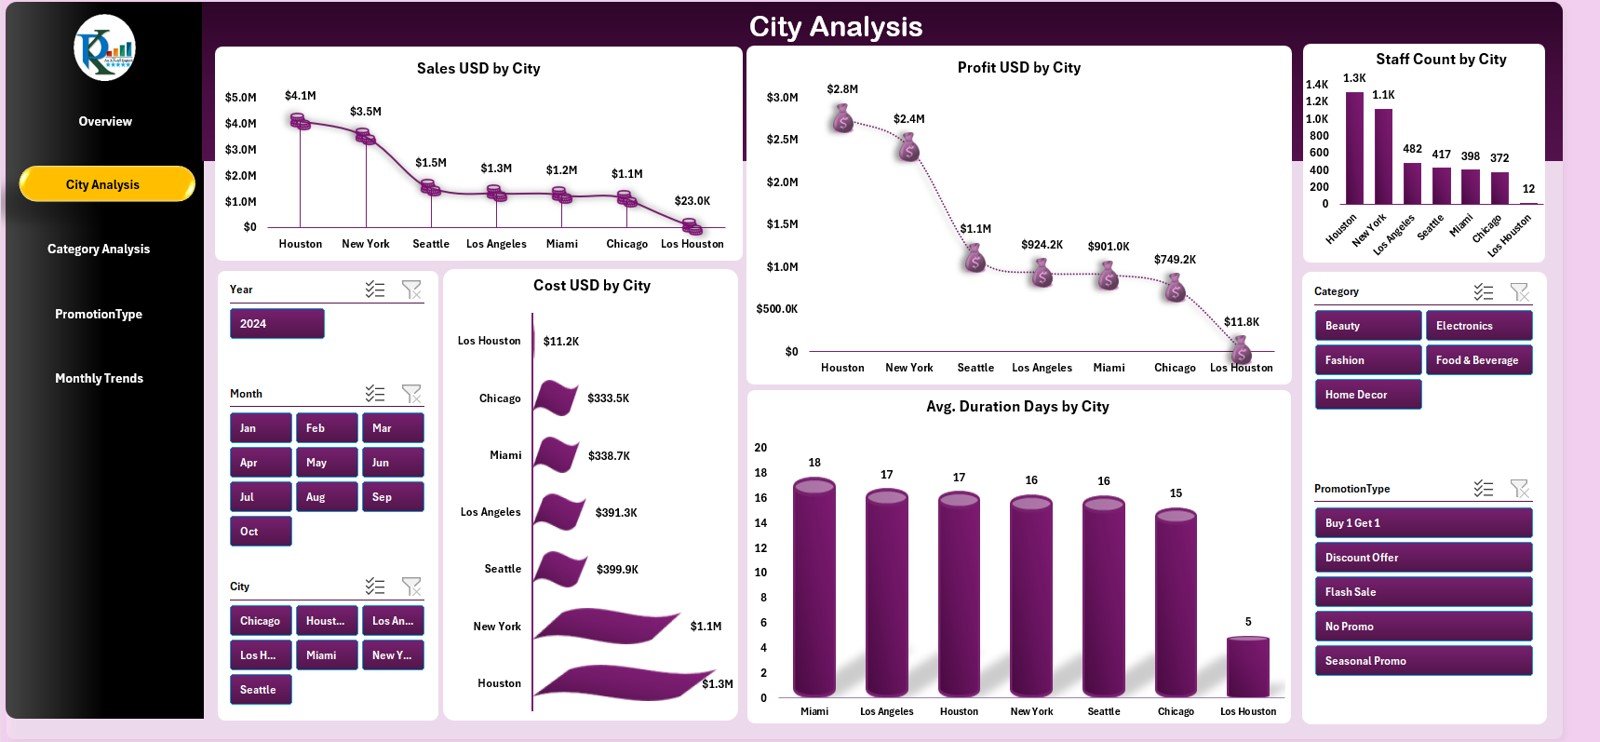
Retail brands run pop-up stores in different cities to test markets. The City Analysis Page helps evaluate performance across all locations.
This page includes:
🔹 Sales USD by City
Shows which cities generate the highest revenue.
🔹 Profit USD by City
Reveals the most profitable locations.
🔹 Staff Count by City
Shows how staff resources are distributed.
🔹 Cost USD by City
Helps identify cities with high operating expenses.
🔹 Avg. Duration (Days) by City
Displays how long each store remained open.
Shorter durations may indicate:
-
Market testing
-
Event-based pop-ups
Long durations indicate stronger engagement.
These five charts help brands decide where to open their next pop-up stores.
Click to Purchases Pop-up Stores Dashboard in Excel
3. Category Analysis
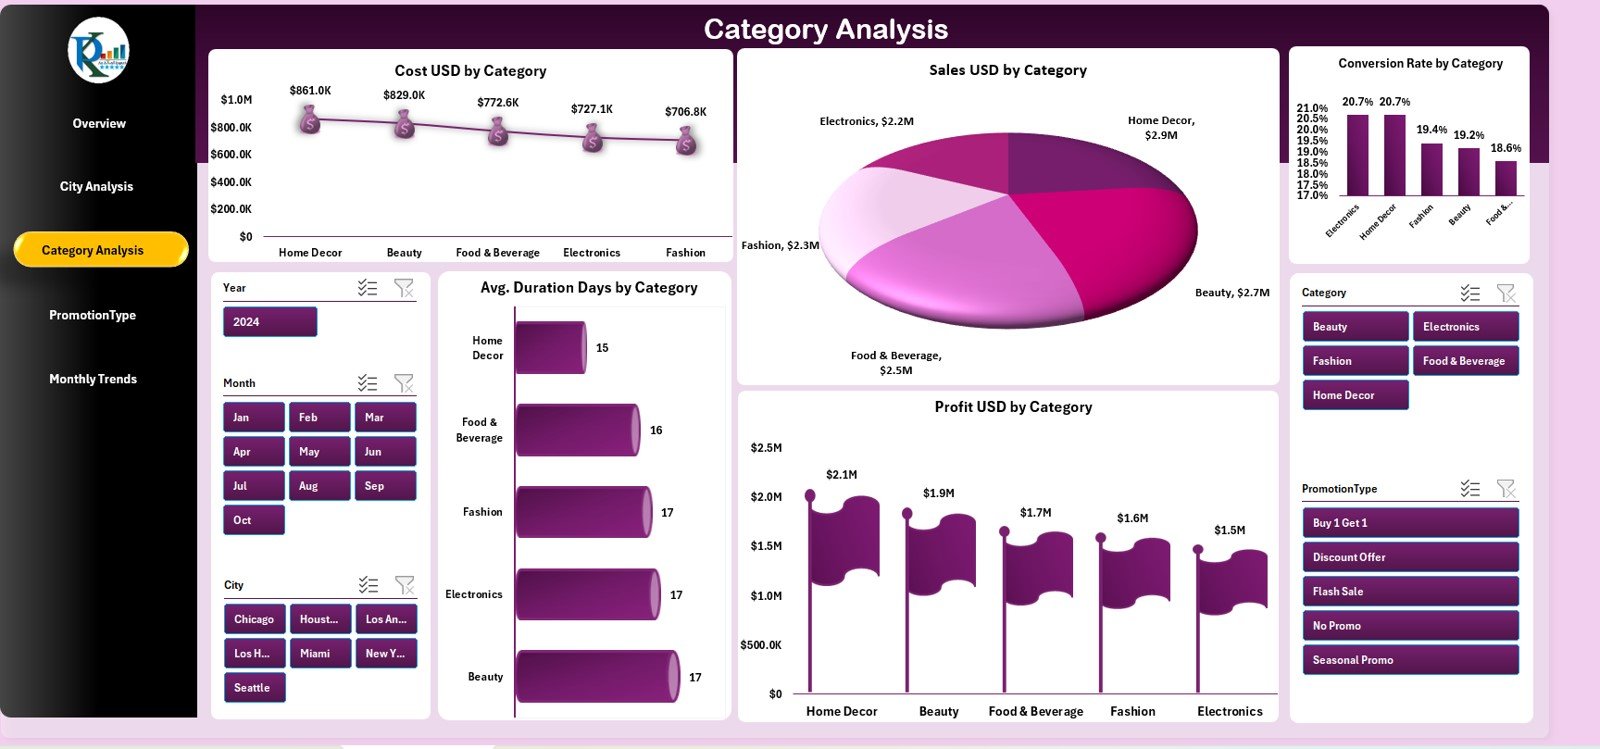
The Category Analysis Page compares all product or service categories used in pop-up stores.
This page includes:
🔹 Cost USD by Category
Highlights expenses associated with each category.
🔹 Sales USD by Category
Shows revenue generated by each category.
🔹 Conversion Rate by Category
Demonstrates how many visitors turned into paying customers.
A strong conversion rate indicates high customer interest and product relevance.
🔹 Avg. Duration (Days) by Category
Shows the number of days the category was available in various stores.
🔹 Profit USD by Category
Reveals which categories contribute maximum profits.
This page helps retail teams identify winning categories and improve product strategies.
Click to Purchases Pop-up Stores Dashboard in Excel
4. Promotion Type Analysis
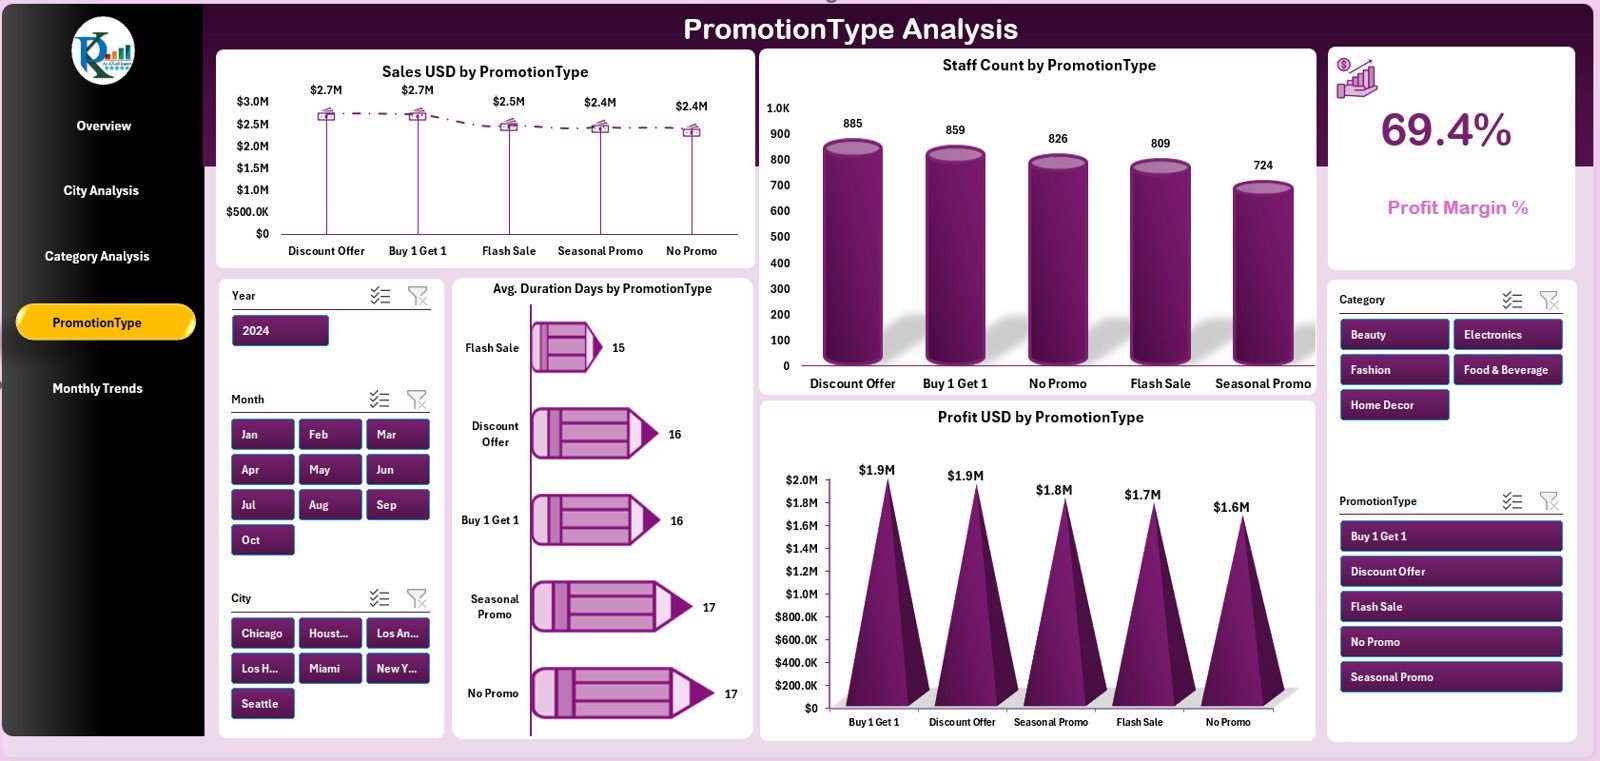
Promotions play a huge role in pop-up store success. The Promotion Type Analysis Page helps marketers understand which offers perform best.
This page includes:
🔹 Sales USD by Promotion Type
Shows sales generated through different promotions.
🔹 Staff Count by Promotion Type
Helps understand manpower impact on promotions.
🔹 Profit Margin %
Shows profitability achieved under each promotion.
🔹 Avg. Duration Days by Promotion Type
Reveals how long promotions were active.
🔹 Profit USD by Promotion Type
Identifies the most profitable promotional strategies.
Marketers use this page to plan future promotional campaigns.
5. Monthly Trends
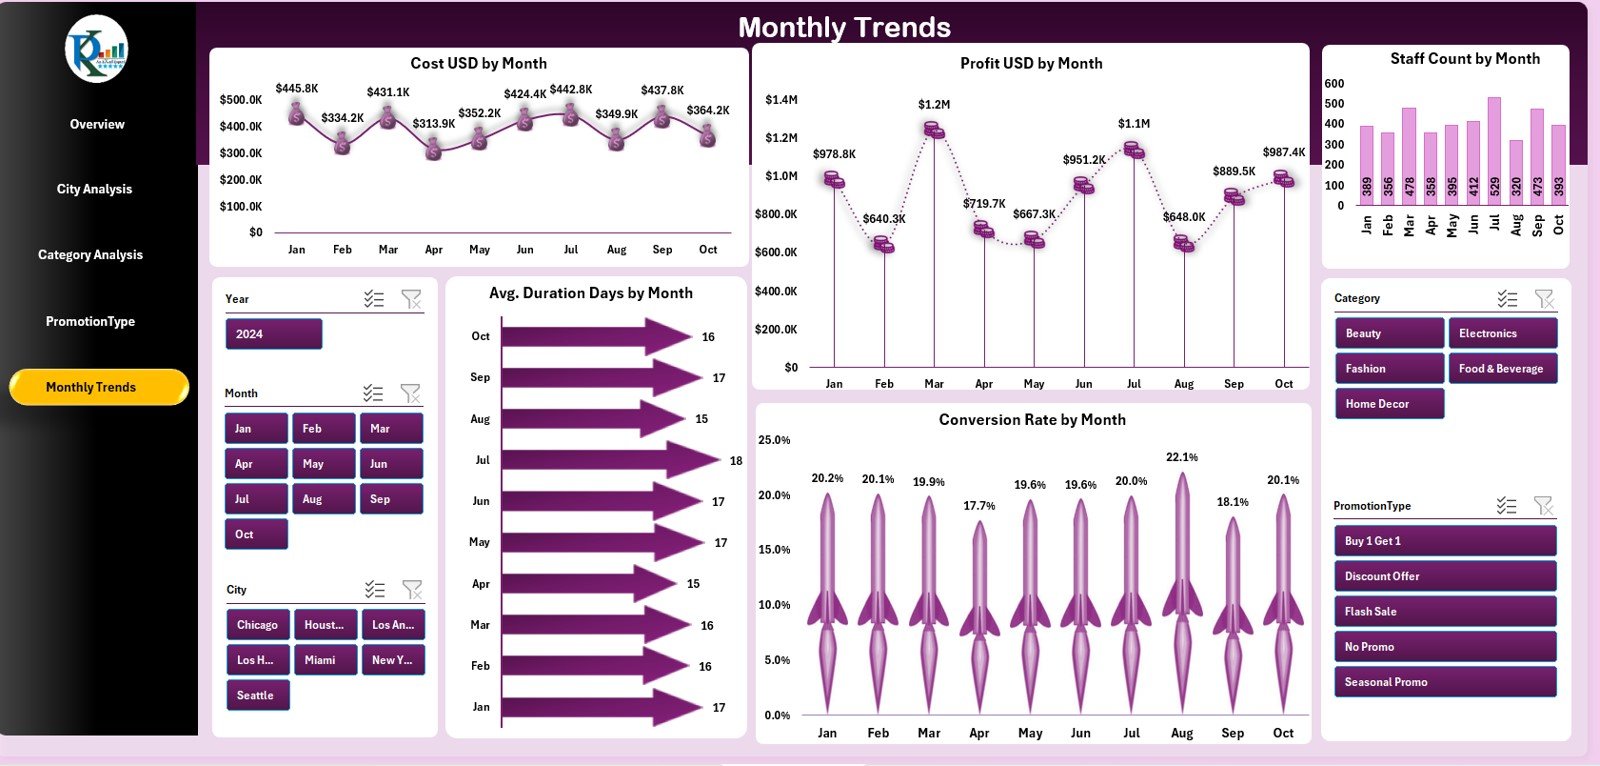
The Monthly Trends Page shows how performance changes month-by-month. This helps identify seasonal patterns and demand cycles.
This page includes 5 charts:
🔹 Cost USD by Month
Shows expenditure across months.
🔹 Profit USD by Month
Highlights profit fluctuations.
🔹 Staff Count by Month
Shows changes in staff allocation throughout the year.
🔹 Avg. Duration Days by Month
Helps track campaign length month-wise.
🔹 Conversion Rate by Month
Shows customer engagement levels across months.
These insights help retail teams plan future pop-up stores at the best times of the year.
Click to Purchases Pop-up Stores Dashboard in Excel
Behind the Dashboard: Support & Data Sheets
The Pop-up Stores Dashboard includes two backend sheets:
✔ Support Sheet
Used for:
-
Data validation
-
Dropdown lists
-
Logic formulas
-
Reference tables
✔ Data Sheet
This sheet contains raw historical data for:
-
Sales
-
Profit
-
Staff count
-
Costs
-
Cities
-
Categories
-
Promotions
-
Duration
-
Month names
The dashboard visuals update automatically when new data is added to the Data Sheet.
Click to Purchases Pop-up Stores Dashboard in Excel
Advantages of Pop-up Stores Dashboard in Excel
Using this dashboard brings many benefits:
✔ Better Decision-Making
All performance data appears in one place.
✔ Real-Time Visual Insights
Charts update instantly when new data is entered.
✔ City-Level Performance Tracking
Helps identify strong and weak markets.
✔ Promotion Effectiveness
Shows which promotions deliver high returns.
✔ Product Category Insights
Helps retailers understand customer preferences.
✔ Easy to Modify
Excel-based templates can be edited by any non-technical user.
✔ Staff & Cost Management
Allows better resource allocation.
Click to Purchases Pop-up Stores Dashboard in Excel
Best Practices for Using the Pop-up Stores Dashboard
For best performance, follow these practices:
1. Update the Data Sheet Weekly
Keeps the dashboard accurate.
2. Track Promotion Costs Carefully
Improves marketing ROI.
3. Use City Insights for Expansion
Helps choose the right markets.
4. Monitor Category Trends
Improves product selection.
5. Study Monthly Patterns
Supports better planning decisions.
6. Keep the Dashboard Clean
Avoid unnecessary visuals.
7. Train Team Members
Ensure everyone understands how to use the dashboard.
Conclusion
The Pop-up Stores Dashboard in Excel is an essential tool for retail teams running short-term stores, promotional events, or experimental outlets. With five powerful pages—Overview, City Analysis, Category Analysis, Promotion Type Analysis, and Monthly Trends—this dashboard provides a 360-degree view of sales, profit, staff, categories, and promotions.
It simplifies performance tracking, improves decision-making, and helps brands scale their pop-up strategies with confidence.
Click to Purchases Pop-up Stores Dashboard in Excel
Frequently Asked Questions (FAQs)
1. What is a Pop-up Stores Dashboard in Excel?
It is a ready-to-use Excel dashboard that tracks pop-up store performance across cities, categories, months, and promotions.
2. Can I customize this dashboard?
Yes. You can change charts, add KPIs, or update the data sheet easily.
3. Does it support multi-city pop-ups?
Yes, the City Analysis page compares performance across all locations.
4. How many KPIs can I track?
You can track unlimited KPIs by adding more fields into the data sheet.
5. Who should use this dashboard?
Marketing teams, retail managers, brand leaders, analysts, and event coordinators.
6. Will this dashboard work in older Excel versions?
Yes, as long as the Excel version supports slicers and charts.
Click to Purchases Pop-up Stores Dashboard in Excel
Visit our YouTube channel to learn step-by-step video tutorials