Poultry farming has become a highly data-driven business. Farmers, poultry integrators, and agribusiness owners now track profit margins, medicine costs, feed expenses, bird performance, and regional trends every single day. However, when this data stays scattered across registers, Excel files, or manual reports, decision-making becomes slow and unclear.
This is exactly where a Poultry Farming Dashboard in Power BI adds massive value.
A Poultry Farming Dashboard in Power BI converts raw farm data into interactive visuals, clear KPIs, and actionable insights. Because Power BI offers advanced analytics, slicers, and real-time updates, poultry managers can instantly understand farm performance and take faster, better decisions.
In this detailed guide, you will learn what a Poultry Farming Dashboard in Power BI is, how it works, what pages it includes, its advantages, best practices, and how it helps improve profitability and efficiency. In addition, you will find answers to the most frequently asked questions at the end.
Click to Purchases Poultry Farming Dashboard in Power BI
What Is a Poultry Farming Dashboard in Power BI?
A Poultry Farming Dashboard in Power BI is a visual analytics tool designed to monitor and analyze poultry farm operations. It brings together data related to revenue, costs, margins, bird types, feed types, medicine usage, and monthly performance into one structured dashboard.
Instead of reviewing multiple reports, users can view all key poultry KPIs in one place. Moreover, interactive slicers allow users to filter data by region, farm type, bird type, feed type, or month. As a result, decision-makers see patterns, risks, and opportunities instantly.
Because the dashboard runs on Power BI, it supports:
-
Interactive charts and cards
-
Fast filtering using slicers
-
Clear comparisons across time periods
-
Better visual storytelling for farm data
Why Do Poultry Farms Need a Power BI Dashboard?
Poultry farming involves tight margins and rising costs. Feed prices fluctuate, medicine costs vary with mortality, and market prices change frequently. Therefore, farm owners need accurate data visibility.
A Poultry Farming Dashboard in Power BI helps because:
-
It gives real-time visibility into profit and cost drivers
-
It identifies high-cost areas like feed or medicine
-
It highlights low-margin farm types or bird types
-
It supports data-based planning instead of guesswork
In addition, because Power BI dashboards are visually intuitive, even non-technical users can understand the insights quickly.
Key Pages in the Poultry Farming Dashboard in Power BI
This Poultry Farming Dashboard in Power BI includes five structured pages, each designed to answer specific business questions. Let us explore each page in detail.
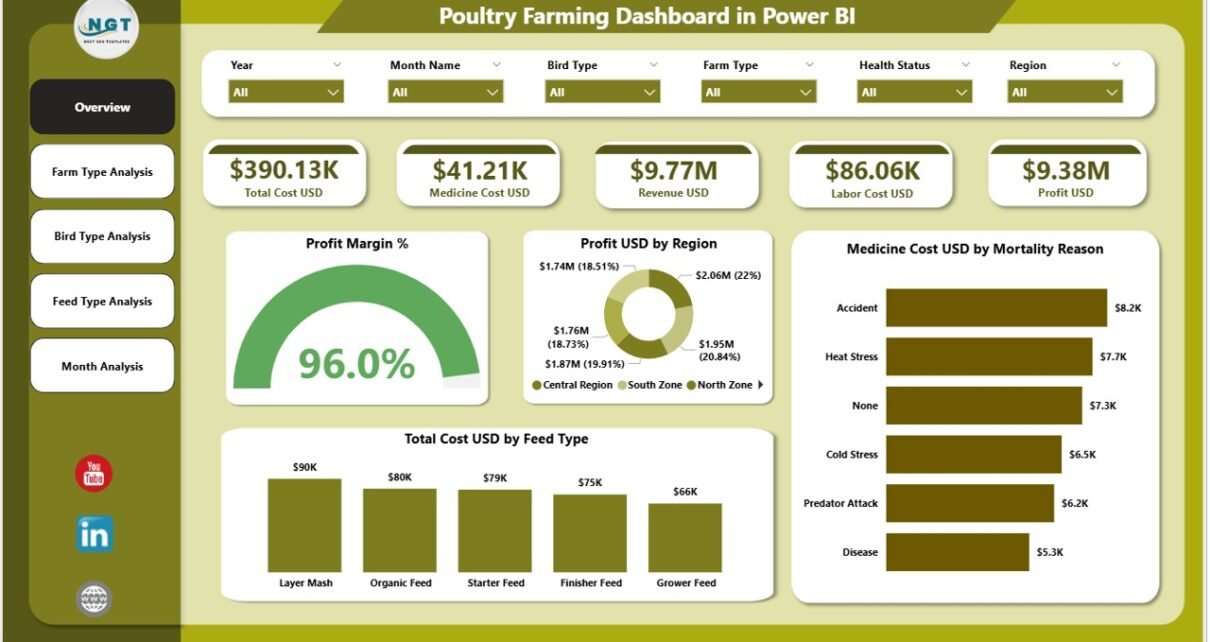
1. Overview Page: What Is the Overall Poultry Farm Performance?
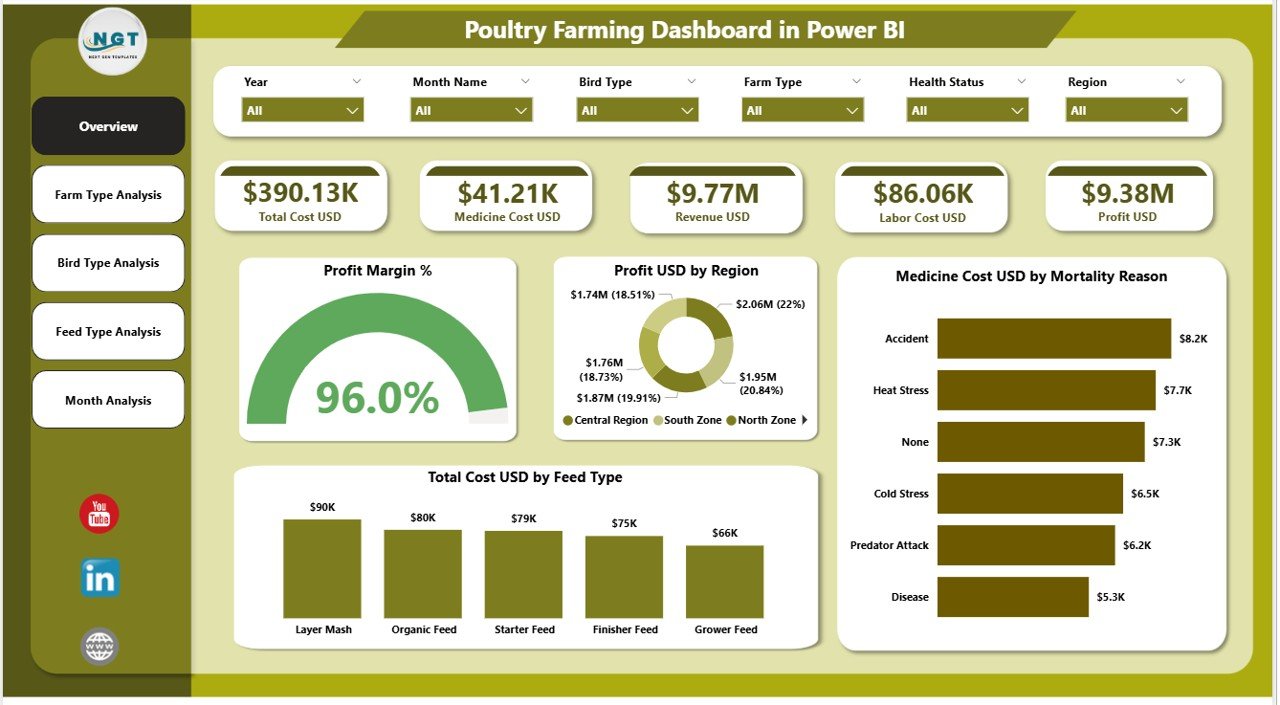
The Overview Page acts as the executive summary of the entire dashboard. This page gives a quick snapshot of overall poultry farm health.
What Does the Overview Page Show?
This page includes slicers, cards, and charts for high-level analysis.
Key Cards on the Overview Page
-
Profit Margin % – Shows overall farm profitability
-
Total Profit USD – Displays total profit generated
-
Total Cost USD – Highlights overall operational cost
-
Total Revenue USD – Shows income generated from poultry operations
These cards update automatically when users change slicers, which improves flexibility and clarity.
Click to Purchases Poultry Farming Dashboard in Power BI
Key Charts on the Overview Page
-
Profit Margin % – Visual representation of profitability
-
Profit USD by Region – Identifies high-performing and low-performing regions
-
Medicine Cost USD by Mortality Reason – Highlights why medicine costs increase
-
Total Cost USD by Feed Type – Shows which feed types generate higher costs
Because this page provides a complete snapshot, farm owners can instantly spot issues and opportunities.
2. Farm Type Analysis Page: Which Farm Types Perform Best?
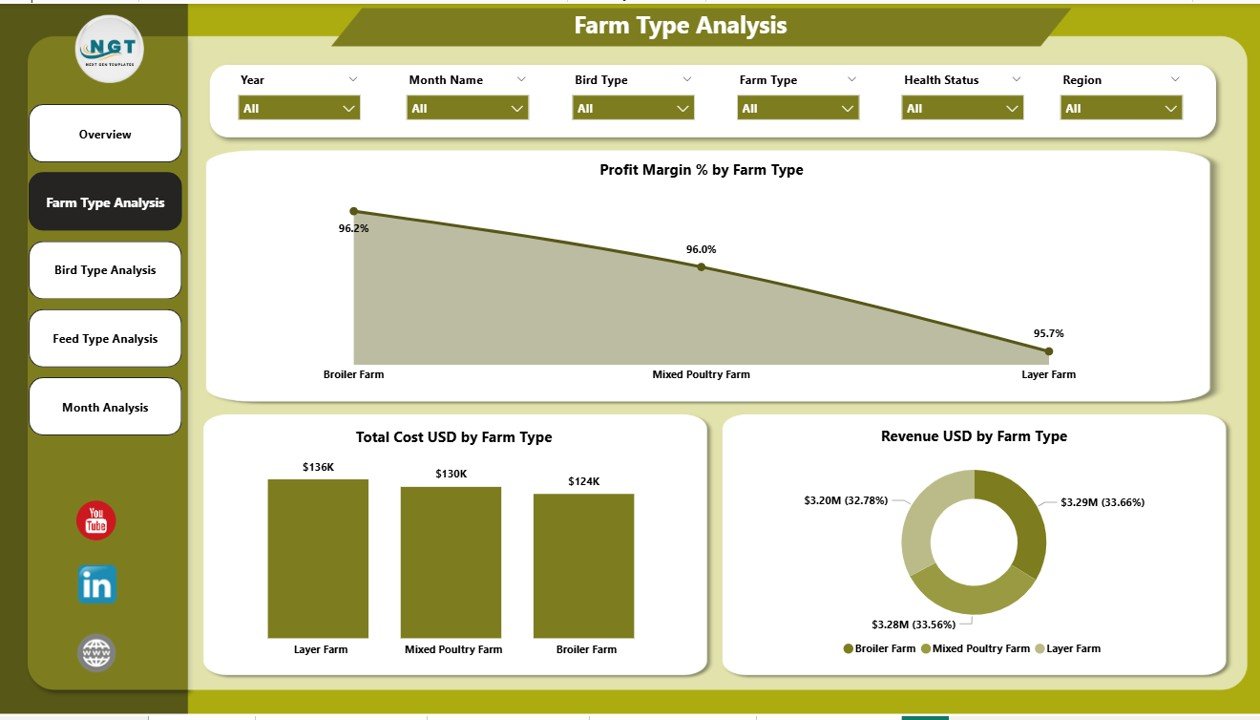
The Farm Type Analysis Page focuses on performance comparison across different farm types such as broiler farms, layer farms, breeder farms, or contract farms.
Why Is Farm Type Analysis Important?
Different poultry farm types operate under different cost structures and revenue models. Therefore, understanding farm-type performance becomes critical for expansion and optimization decisions.
Key Charts on the Farm Type Analysis Page
-
Profit Margin % by Farm Type
Helps identify which farm type generates better margins. -
Total Cost USD by Farm Type
Highlights cost-intensive farm models. -
Revenue USD by Farm Type
Shows income contribution from each farm type.
Because this page includes slicers, users can further filter data by region, period, or bird type for deeper insights.
3. Bird Type Analysis Page: Which Bird Types Drive Profitability?
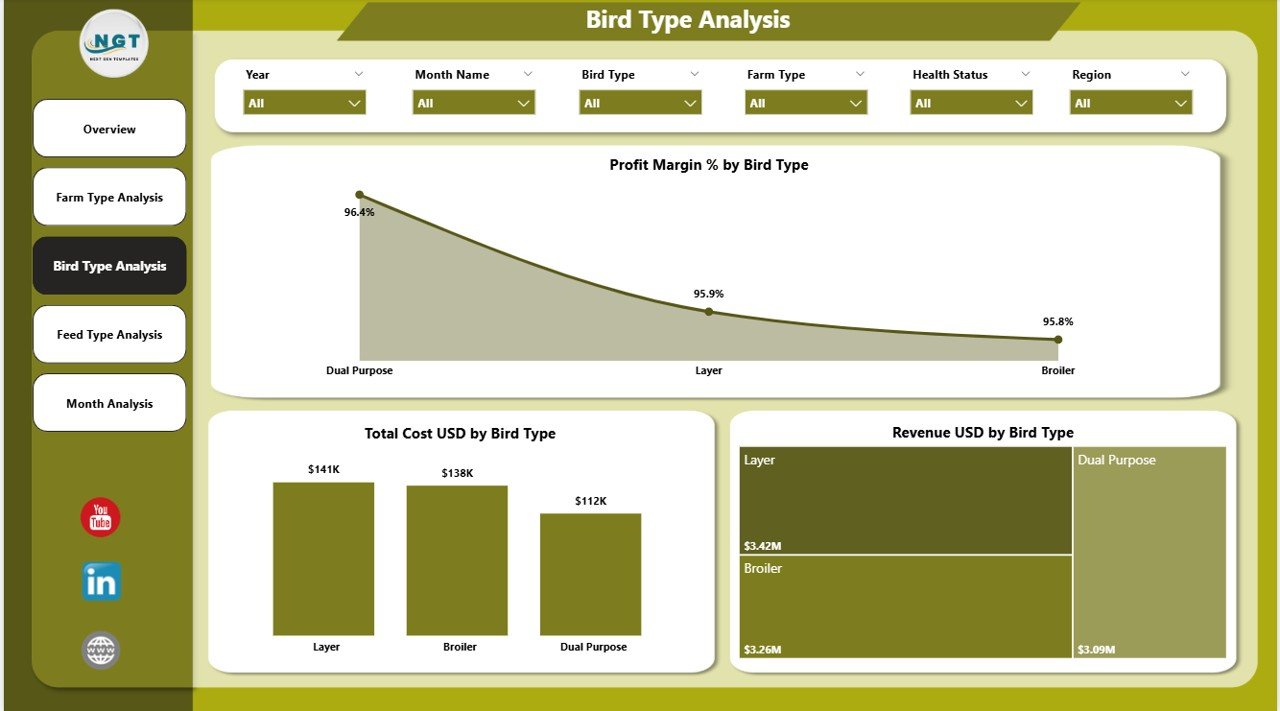
The Bird Type Analysis Page focuses on performance based on poultry bird categories such as broilers, layers, country chickens, or breeders.
Why Does Bird Type Analysis Matter?
Each bird type differs in feed consumption, growth rate, medicine requirement, and market value. Therefore, analyzing bird-type performance directly impacts cost control and pricing strategies.
Key Charts on the Bird Type Analysis Page
-
Profit Margin % by Bird Type
Reveals which bird types generate higher or lower profits. -
Total Cost USD by Bird Type
Helps track feed, medicine, and operational costs. -
Revenue USD by Bird Type
Identifies revenue contribution from each bird category.
As a result, farm managers can decide which bird types to scale and which to optimize.
Click to Purchases Poultry Farming Dashboard in Power BI
4. Feed Type Analysis Page: How Does Feed Impact Profit and Cost?
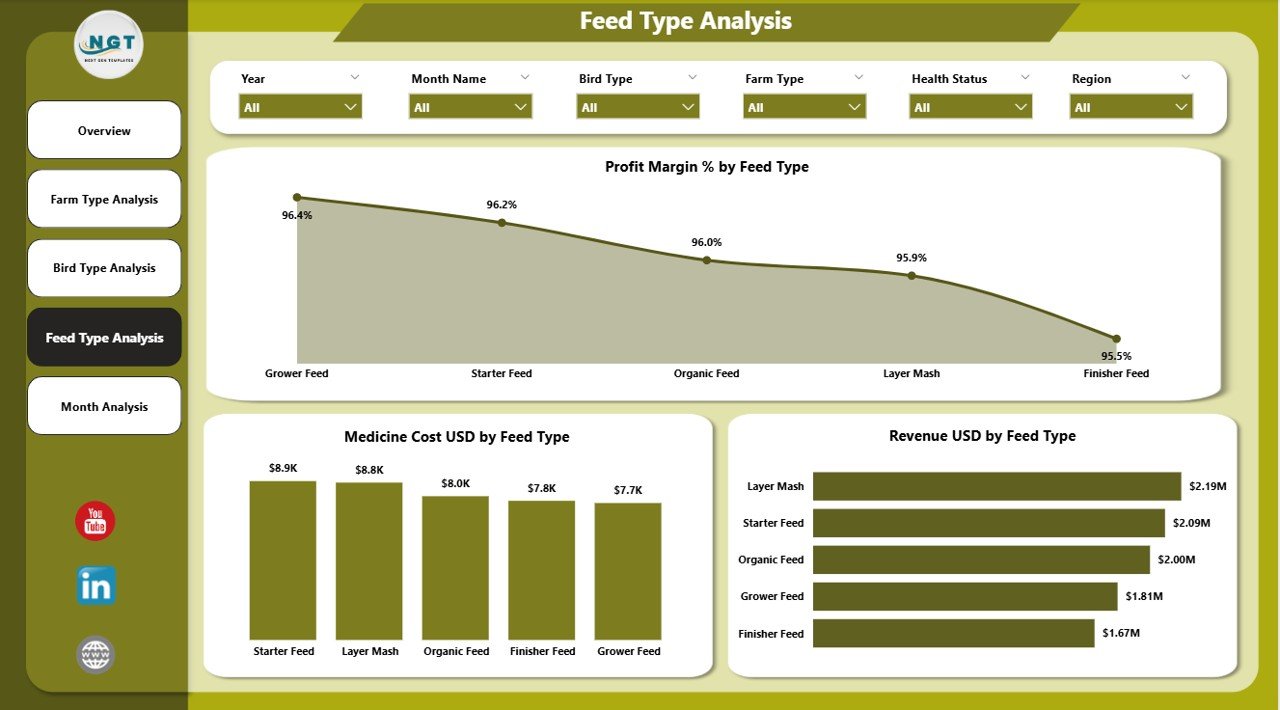
The Feed Type Analysis Page focuses on one of the biggest cost drivers in poultry farming: feed.
Why Is Feed Type Analysis Critical?
Feed costs often consume 60–70% of overall poultry production costs. Therefore, even small improvements in feed efficiency can significantly improve profit margins.
Key Charts on the Feed Type Analysis Page
-
Profit Margin % by Feed Type
Compares margins across different feed categories. -
Medicine Cost USD by Feed Type
Shows how feed quality affects bird health. -
Revenue USD by Feed Type
Links feed strategy with revenue performance.
Because this page includes slicers, farm owners can test scenarios easily by switching between feed types.
5. Monthly Trends Page: How Is Performance Changing Over Time?
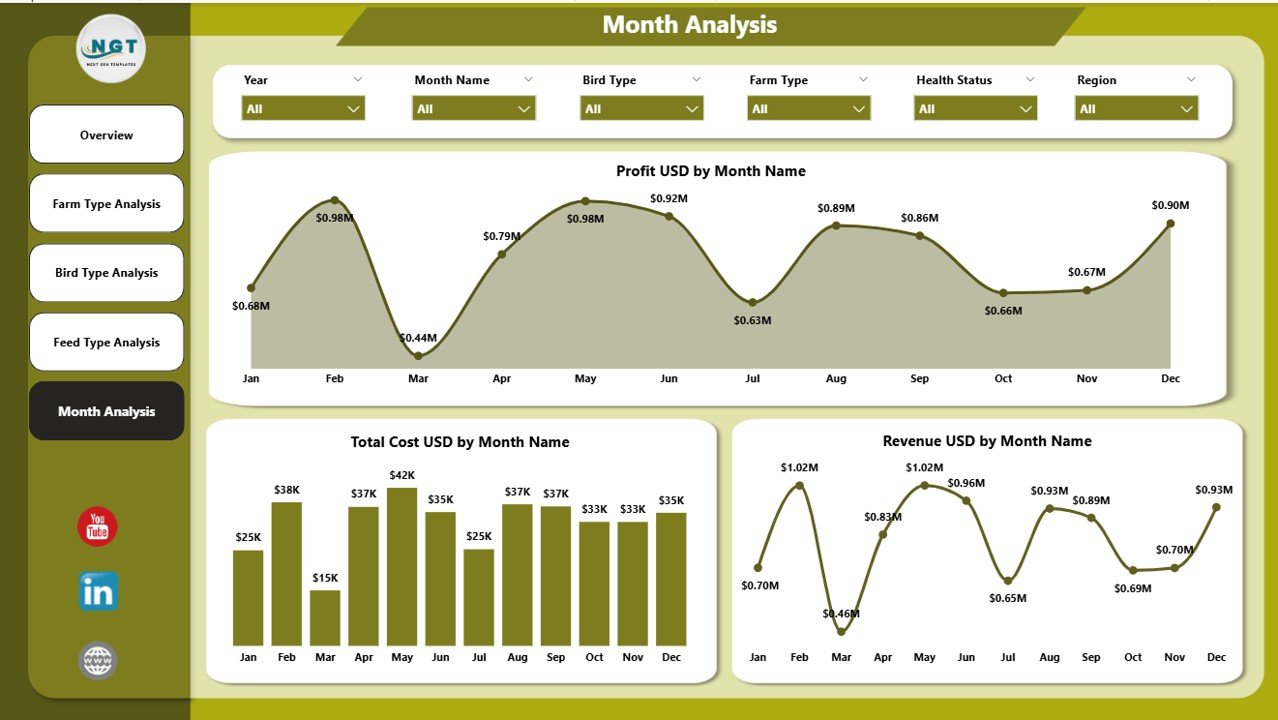
The Monthly Trends Page focuses on time-based analysis. This page helps understand seasonality, demand cycles, and cost fluctuations.
Why Is Monthly Analysis Valuable?
Monthly trends help poultry farms:
-
Detect seasonal demand changes
-
Track rising input costs early
-
Forecast future performance
Key Charts on the Monthly Trends Page
-
Profit USD by Month – Tracks monthly profitability
-
Total Cost USD by Month – Shows cost movement over time
-
Revenue USD by Month – Reveals revenue growth or decline trends
Using this page, managers can compare performance month-over-month and plan ahead more effectively.
Click to Purchases Poultry Farming Dashboard in Power BI
Advantages of a Poultry Farming Dashboard in Power BI
A Poultry Farming Dashboard in Power BI offers multiple advantages for farm owners and agribusiness managers.
✅ Centralized Data Visibility
Instead of managing multiple reports, users access all poultry KPIs in one structured dashboard.
✅ Faster Decision-Making
Because insights appear instantly, farm managers can respond faster to cost increases, mortality issues, or profit drops.
✅ Improved Cost Control
The dashboard highlights feed costs, medicine expenses, and operational inefficiencies clearly.
✅ Better Profitability Management
Profit margin tracking across farm types, bird types, and feed types helps improve financial outcomes.
✅ Interactive and User-Friendly
Power BI slicers make data exploration simple, even for non-technical users.
Best Practices for Using a Poultry Farming Dashboard in Power BI
To get maximum value from your Poultry Farming Dashboard in Power BI, follow these best practices.
📌 Maintain Clean and Accurate Data
Always ensure farm-level data remains accurate, complete, and updated. Clean data improves insight quality.
📌 Standardize Data Collection
Use standard formats for cost, revenue, bird type, and feed type data across all farms.
📌 Review Dashboard Regularly
Check the dashboard daily or weekly to spot early warning signs and act promptly.
📌 Use Slicers Effectively
Apply slicers wisely to compare regions, bird types, and months without confusion.
📌 Focus on Actionable KPIs
Track only meaningful KPIs that directly affect profitability and efficiency.
How Does This Dashboard Support Better Poultry Farm Decisions?
A Poultry Farming Dashboard in Power BI supports better decisions by:
-
Highlighting high-cost feed and medicine areas
-
Identifying underperforming farm or bird types
-
Supporting data-backed expansion strategies
-
Improving monthly forecasting and budgeting
-
Enhancing risk management and operational planning
Because the dashboard connects insights with actions, farm owners gain clear control over their operations.
Conclusion: Why a Poultry Farming Dashboard in Power BI Is Essential
A Poultry Farming Dashboard in Power BI transforms complex poultry data into simple, meaningful insights. It allows farm owners to monitor profit margins, control costs, analyze bird and feed performance, and track trends over time.
By using interactive visuals and slicers, this dashboard eliminates guesswork and improves operational efficiency. As poultry farming becomes more competitive, adopting a Power BI dashboard is no longer optional—it is essential for sustainable growth and profitability.
Frequently Asked Questions (FAQs)
1. What data do I need for a Poultry Farming Dashboard in Power BI?
You need data related to revenue, costs, profit margins, farm types, bird types, feed types, medicine costs, mortality reasons, regions, and monthly periods.
2. Can small poultry farms use a Power BI dashboard?
Yes. Small farms can also benefit because Power BI scales easily and improves visibility even with limited data.
3. Can I customize the Poultry Farming Dashboard in Power BI?
Yes. You can customize KPIs, visuals, slicers, and layouts based on your farm requirements.
4. How often should I update the dashboard data?
You should update the data daily or weekly for accurate monitoring and analysis.
5. Does this dashboard help reduce poultry farming costs?
Yes. By identifying high-cost areas like feed and medicine, the dashboard helps improve cost control significantly.
Visit our YouTube channel to learn step-by-step video tutorials