Modern poultry farming demands speed, accuracy, and strong monitoring. Every small change in feed cost, mortality rate, egg production, or flock performance affects the profit of the farm. Because of this, poultry farmers now need a simple and reliable way to measure their daily performance. As a result, the Poultry Farming KPI Dashboard in Power BI has become the perfect tool for farm managers, poultry business owners, and data analysts.
This dashboard brings all important poultry KPIs into one place. It also shows clear charts, trends, and comparisons that help users make fast and correct decisions. In this article, we will explore this dashboard in detail so you can understand how it works and how it adds value to your farm operations.
Let’s move ahead and explore everything step by step.
Click to Purchases Poultry Farming KPI Dashboard in Power BI
What Is a Poultry Farming KPI Dashboard in Power BI?
A Poultry Farming KPI Dashboard in Power BI is a visual analytics tool that collects data from Excel and displays it in an easy-to-read layout. It shows real-time and historical poultry farm KPIs such as:
-
Flock performance
-
Mortality rate
-
Feed conversion ratio
-
Egg production rate
-
Health indicators
-
Cost and revenue
-
MTD vs YTD performance
Because the dashboard is interactive, users switch between months, KPI groups, or KPI names with a single click. This makes it easy for poultry farms to spot trends, fix bottlenecks, and improve profitability.
Why Poultry Farms Need a KPI Dashboard
Today, poultry farms handle thousands of birds, multiple farms, different batches, various feed types, and many production cycles. Managing all this data manually becomes slow and confusing. However, when farms use a KPI dashboard, they gain clarity.
You need this dashboard because:
-
It shows all poultry KPIs on one clean screen.
-
It helps you monitor flock performance daily.
-
It highlights issues before they become major.
-
It compares current results with previous results.
-
It supports better decision-making for feed, cost, and production.
Because the dashboard updates with every new data entry, you always stay informed.
Click to Purchases Poultry Farming KPI Dashboard in Power BI
Key Features of the Poultry Farming KPI Dashboard in Power BI
This dashboard includes three primary pages:
✔ Summary Page
✔ KPI Trend Page
✔ KPI Definition Page
Let’s explore each page in detail.
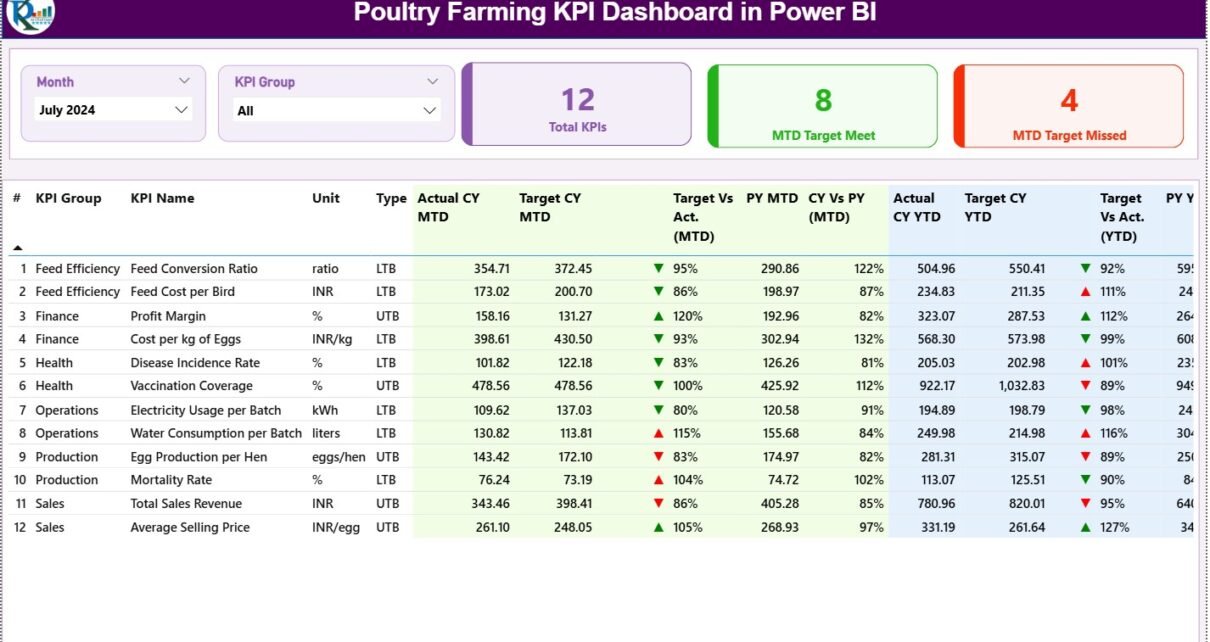
1. Summary Page – The Main Performance Overview

The Summary Page works as the starting point for all analysis. Here, farmers can quickly see the complete KPI performance for the selected month.
Main Elements of the Summary Page
✔ Month Slicer
Users select the month they want to review. The dashboard updates instantly.
✔ KPI Group Slicer
Users filter KPIs by category such as production, health, hatchery, feed, or operations.
✔ Key KPI Cards
These three cards appear at the top:
-
Total KPIs Count
-
MTD Target Met Count
-
MTD Target Missed Count
Farmers immediately know whether the farm performed well or if improvement is needed.
✔ Detailed KPI Table – Complete KPI Visibility
Below the cards, a detailed KPI table displays every KPI with real-time metrics. It includes:
-
KPI Number
-
KPI Group
-
KPI Name
-
Unit
-
Type (LTB or UTB)
-
Actual CY MTD
-
Target CY MTD
-
MTD Icon (▲ or ▼, green/red)
-
Target vs Actual % (MTD)
-
PY MTD
-
CY vs PY % (MTD)
-
Actual CY YTD
-
Target CY YTD
-
YTD Icon
-
Target vs Actual % (YTD)
-
PY YTD
-
CY vs PY % (YTD)
Understanding the LTB and UTB KPI Types
-
LTB – Lower the Better
Example: Mortality rate -
UTB – Upper the Better
Example: Egg production rate
The icons clearly show whether KPIs are on track or need attention.
The Summary Page alone gives full clarity of poultry operations.
Click to Purchases Poultry Farming KPI Dashboard in Power BI
2. KPI Trend Page – Clear Month-Wise Performance Trends

The KPI Trend page shows how each KPI performs over time. Users select the KPI name from the slicer, and the page updates.
This page shows two combo charts:
✔ MTD Combo Chart
Shows Current Year Actual vs Target vs Previous Year Actual.
✔ YTD Combo Chart
Shows cumulative YTD trends for the same KPI.
Because these charts combine line and column visuals, users easily spot changes, growth, or drops in performance. For example:
-
If feed conversion ratio increases, farmers take action fast.
-
If egg production falls, managers detect the reason early.
-
If mortality rate improves, the farm team sees progress.
Trend charts are essential for poultry management because production cycles change often.
3. KPI Definition Page – Understand Every KPI Clearly

This is a drill-through page and stays hidden. You can access it from the Summary Page. When you click on any KPI row, it opens the definition page.
Here, you see:
-
KPI Name
-
KPI Group
-
KPI Number
-
Unit
-
Formula
-
Definition
-
Type (LTB or UTB)
This section helps new team members or managers understand how each KPI works. It avoids confusion and maintains standard reporting.
A back button takes you back to the main page.
Click to Purchases Poultry Farming KPI Dashboard in Power BI
Excel Data Structure for This Dashboard
The dashboard sources data from an Excel file that contains three sheets:
1. Input_Actual Sheet
Enter:
-
KPI Name
-
Month (first date of the month)
-
Actual MTD
-
Actual YTD
This sheet stores real performance data.
2. Input_Target Sheet
Enter:
-
KPI Name
-
Month
-
Target MTD
-
Target YTD
Targets help users compare performance with goals.
3. KPI Definition Sheet
Enter:
-
KPI Number
-
KPI Group
-
KPI Name
-
Unit
-
Formula
-
Definition
-
Type
This sheet acts as the base for the drill-through definition page.
All three sheets work together to power the dashboard visuals accurately.
Click to Purchases Poultry Farming KPI Dashboard in Power BI
Advantages of the Poultry Farming KPI Dashboard in Power BI
This dashboard offers many benefits that make poultry management easier.
1. Instant Overview of Poultry Farm Health
The dashboard shows performance in one place. Users understand flock health, egg production, feed usage, and operations in seconds.
2. Quick Decision-Making
Because visuals are simple and clean, managers act fast. They do not waste time searching through spreadsheets.
3. Strong MTD and YTD Comparison
It compares:
- Current Month (CY MTD)
- Previous Year (PY MTD)
- Current Year (CY YTD)
- Previous Year (PY YTD)
This helps farms detect improvement or decline instantly.
4. Accurate Trend Tracking
Users track feed conversion ratio, egg production, mortality rate, and performance trends easily.
5. Better Cost and Resource Control
The dashboard helps detect:
- High feed usage
- Increased mortality
- Drop in production
- Rising operational cost
Because of this, managers reduce waste and improve efficiency.
6. Simple Navigation for All Users
The dashboard layout stays clean. Both beginners and experts use it without confusion.
Click to Purchases Poultry Farming KPI Dashboard in Power BI
How to Build a Poultry Farming KPI Dashboard in Power BI
Let’s break down the steps.
Step 1: Collect All KPI Definitions
Prepare a clear KPI list with formulas and descriptions.
Step 2: Fill Actual Data
Update Actual MTD and YTD values for all KPIs.
Step 3: Add Target Data
Enter Target MTD and Target YTD values.
Step 4: Load Excel Data Into Power BI
Import all three sheets.
Step 5: Create Data Model
Relate the sheets using KPI Name.
Step 6: Create DAX Measures
Prepare measures for:
-
Actual MTD
-
Target MTD
-
Actual YTD
-
Target YTD
-
Previous Year
-
CY vs PY comparison
Step 7: Add Summary Visuals
Add:
-
KPI cards
-
Table
-
Icons
-
Conditional formatting
Step 8: Add Trend Visuals
Create combo charts for MTD and YTD trends.
Step 9: Add KPI Drill-Through Page
Connect it with the “KPI Name” field.
Click to Purchases Poultry Farming KPI Dashboard in Power BI
Best Practices for the Poultry Farming KPI Dashboard in Power BI
Follow these best practices to get accurate and clear reports.
1. Maintain Clear KPI Definitions
Every KPI must have a simple formula and description.
2. Use Consistent Date Format
Use the first date of the month to avoid errors.
3. Refresh Data Regularly
Always update the Excel source before refreshing the dashboard.
4. Use Color Coding for Fast Understanding
-
Green ▲ = Good performance
-
Red ▼ = Needs improvement
5. Avoid Overcrowding the Pages
Keep only important visuals.
6. Track Monthly Changes
Monitor monthly numbers carefully to detect patterns.
Conclusion
The Poultry Farming KPI Dashboard in Power BI helps farm owners and managers track flock performance, production, cost, and health metrics with clarity. It also shows trends, targets, and year-to-year comparisons so users can make accurate decisions at the right time.
With its slicers, KPI cards, detailed tables, combo charts, and drill-through page, this dashboard becomes the perfect tool for poultry management. It offers full control and real-time visibility for all important KPIs.
If you want a smarter way to manage your poultry farm, this dashboard is the powerful solution you need.
Click to Purchases Poultry Farming KPI Dashboard in Power BI
Frequently Asked Questions (FAQs)
1. What is a Poultry Farming KPI Dashboard?
It is a Power BI dashboard that shows poultry farm performance KPIs like mortality rate, feed usage, egg production, and flock health.
2. How many pages does the dashboard include?
The dashboard includes a Summary Page, KPI Trend Page, and KPI Definition Page.
3. Can I track both MTD and YTD values?
Yes, the dashboard tracks both MTD and YTD performance.
4. Does the dashboard compare performance with last year?
Yes, it shows CY and PY comparisons for MTD and YTD.
5. Can I add more KPIs?
Yes, you simply update the Excel sheets.
6. Is this dashboard beginner-friendly?
Yes, the navigation is simple, and icons help users understand the status quickly.
Click to Purchases Poultry Farming KPI Dashboard in Power BI
Visit our YouTube channel to learn step-by-step video tutorials