Precision agriculture continues to transform modern farming. Farmers, agribusiness managers, and agri-consultants now rely on data instead of guesswork. However, raw data alone does not help. You need a clear system that converts numbers into insights. That is exactly where a Precision Agriculture KPI Dashboard in Excel becomes essential.
In this detailed article, you will learn what a Precision Agriculture KPI Dashboard in Excel is, why it matters, how it works, its sheet-wise structure, advantages, best practices, and frequently asked questions. By the end, you will clearly understand how this ready-to-use Excel dashboard supports smarter, faster, and more profitable farming decisions.
Click to buy Precision Agriculture KPI Dashboard in Excel
What Is a Precision Agriculture KPI Dashboard in Excel?
A Precision Agriculture KPI Dashboard in Excel is a centralized performance-tracking tool designed to monitor key farming metrics in one interactive Excel file. Instead of managing scattered spreadsheets, you track all agriculture KPIs through a structured dashboard.
Moreover, this dashboard helps you:
- Measure farm productivity accurately
- Compare actual results with targets
- Analyze monthly and yearly performance
- Identify gaps and improvement areas early
Because Excel remains widely used, this dashboard works without complex software or expensive subscriptions.
Why Is Precision Agriculture KPI Tracking Important?
Modern agriculture depends on efficiency. Therefore, tracking KPIs helps farmers and agribusinesses stay competitive.
Here is why KPI tracking matters:
- You understand crop performance trends
- You control input costs effectively
- You optimize resource usage
- You improve yield predictability
- You support data-driven decisions
As a result, a structured KPI dashboard becomes a decision-making backbone for precision farming.
Who Can Use a Precision Agriculture KPI Dashboard in Excel?
This dashboard suits a wide range of users, including:
- Commercial farmers
- Farm managers
- Agribusiness companies
- Agriculture consultants
- Precision farming startups
- Research institutions
- Government agriculture departments
Because the dashboard stays flexible, you can customize KPIs based on crop type, region, or farm size.
What Are KPIs in Precision Agriculture?
Key Performance Indicators (KPIs) measure farming success. However, choosing the right KPIs makes all the difference.
Common precision agriculture KPIs include:
- Crop yield per hectare
- Input cost per acre
- Water usage efficiency
- Fertilizer efficiency ratio
- Equipment utilization rate
- Pest and disease incidence rate
- Revenue per crop
- Profit margin
With a KPI dashboard, you track all these indicators in one place.
How Does a Precision Agriculture KPI Dashboard in Excel Work?
This dashboard uses structured Excel worksheets, formulas, drop-down filters, and charts. Therefore, users can analyze data without manual calculations.
Here is how the workflow looks:
- Enter actual data monthly
- Define target values for KPIs
- Add previous year performance
- Select month or KPI from drop-downs
- View instant performance comparisons
- Analyze trends using charts
As a result, Excel updates the entire dashboard automatically.
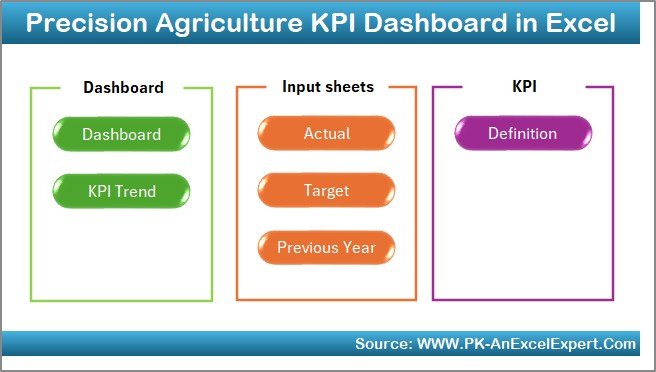
What Is the Sheet-Wise Structure of the Precision Agriculture KPI Dashboard in Excel?
This ready-to-use dashboard includes 7 well-structured worksheets. Each sheet plays a specific role.
Summary Page: How Does the Index Sheet Help Navigation?
The Summary Page works as an index sheet. It improves usability and navigation.
Key Highlights of the Summary Page:
- Acts as the landing page
- Contains 6 navigation buttons
- Allows quick jump to any worksheet
- Improves user experience
Because of this design, users avoid scrolling through multiple sheets manually.
Click to buy Precision Agriculture KPI Dashboard in Excel
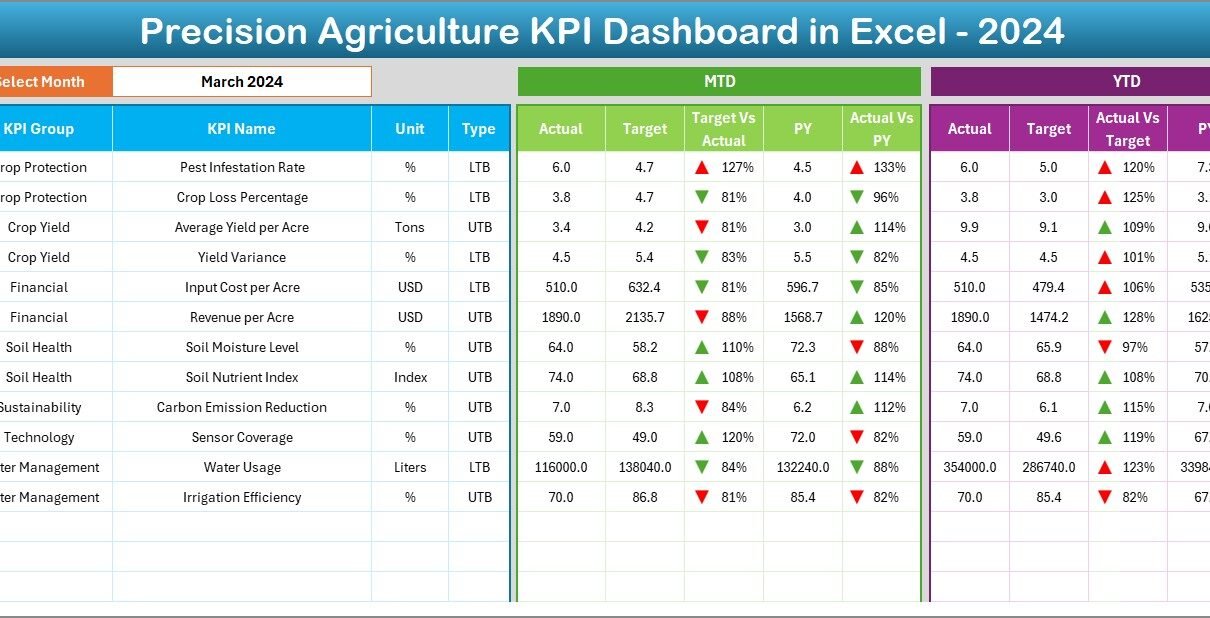
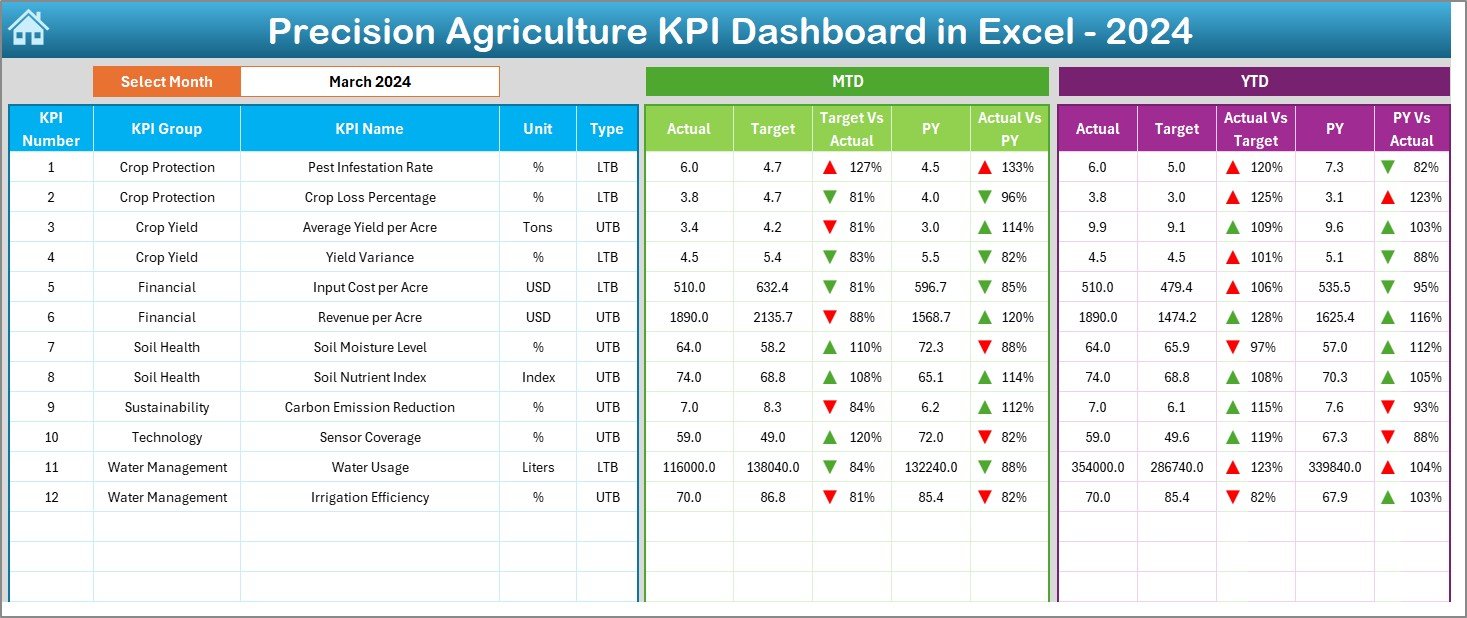
Dashboard Sheet Tab: How Do You Analyze KPI Performance?
The Dashboard Sheet is the core of this Excel file. It shows all KPI performance metrics visually.
Key Features of the Dashboard Sheet:
- Month selection drop-down at cell D3
- Dynamic update of all KPIs based on selected month
- Displays MTD (Month-to-Date) metrics
- Displays YTD (Year-to-Date) metrics
KPI Metrics Shown:
- Actual values
- Target values
- Previous Year (PY) values
- Target vs Actual comparison
- PY vs Actual comparison
Visual Enhancements:
- Conditional formatting
- Up and down arrows
- Clear variance indicators
As a result, decision-makers instantly see where performance improves or declines.
Click to buy Precision Agriculture KPI Dashboard in Excel
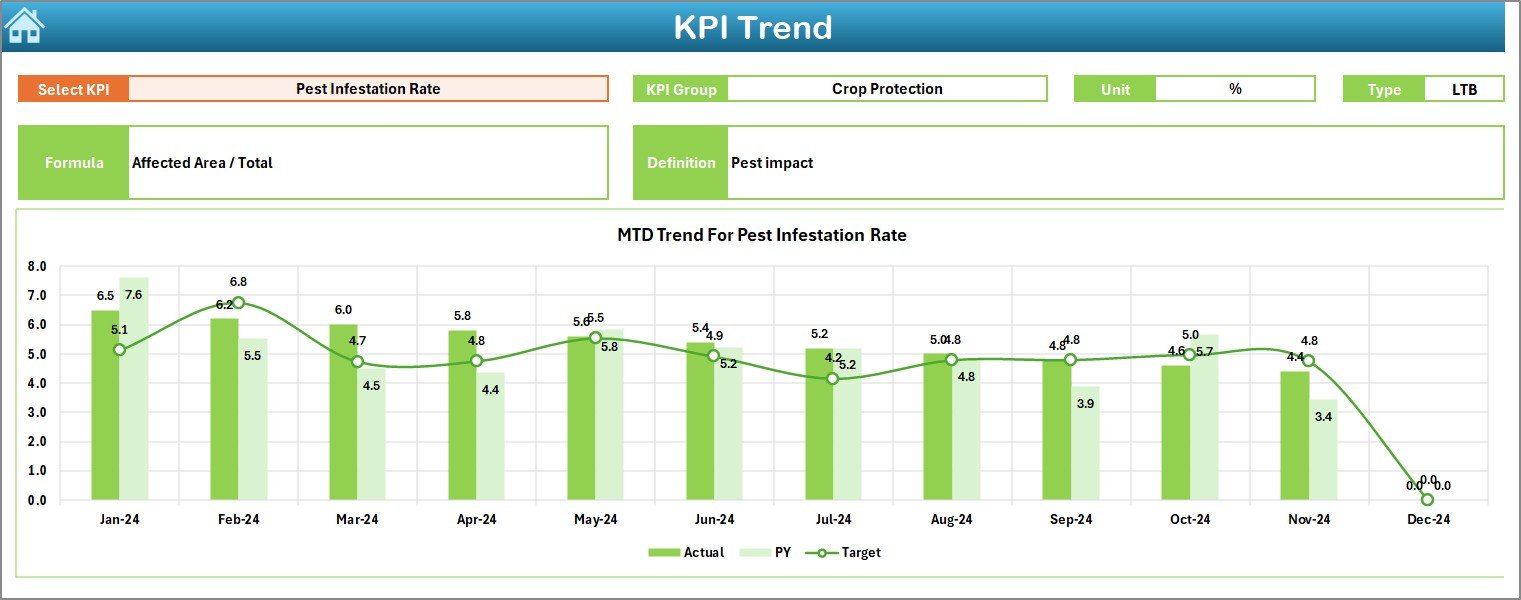
Trend Sheet Tab: How Can You Analyze KPI Trends?
The Trend Sheet focuses on deep KPI analysis over time.
How It Works:
- Select KPI Name from drop-down at cell C3
- Automatically displays:
KPI Group
Unit of Measurement
KPI Type (Lower the Better / Upper the Better)
KPI Formula
KPI Definition
Charts Available:
- MTD trend chart
- YTD trend chart
- Actual vs Target vs PY comparison
Because trends matter more than single values, this sheet helps identify long-term patterns.
Click to buy Precision Agriculture KPI Dashboard in Excel
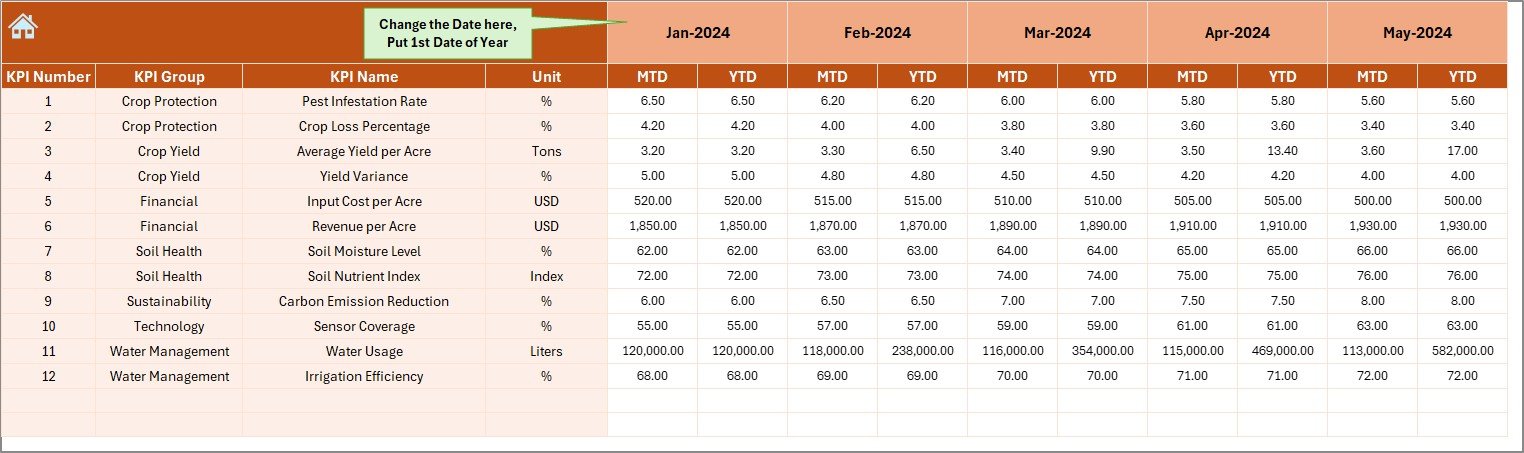
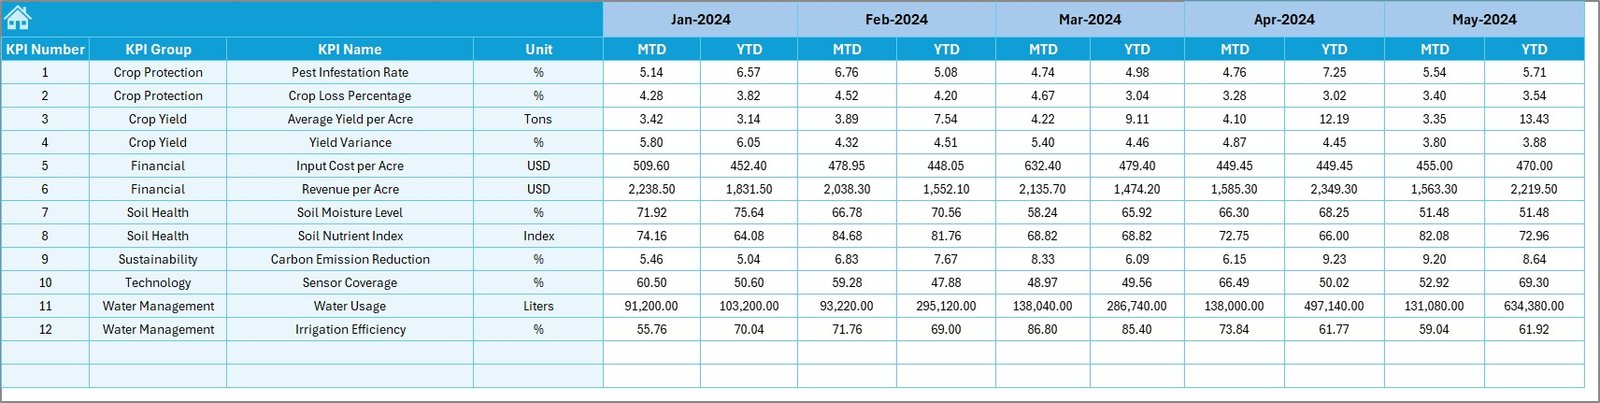
Actual Numbers Input Sheet: Where Do You Enter Data?
The Actual Numbers Input Sheet stores real performance data.
Key Functions:
- Enter MTD and YTD actual values
- Change the month from cell E1
- Input first month of the year in E1
- Automatically aligns data across months
Because data entry stays structured, errors reduce significantly.
Click to buy Precision Agriculture KPI Dashboard in Excel
Target Sheet Tab: How Do You Set Performance Goals?
The Target Sheet defines expected performance levels.
What You Enter:
- Monthly target values
- YTD target values
- KPI-wise goals
As a result, Excel calculates variance and performance gaps automatically.
Click to buy Precision Agriculture KPI Dashboard in Excel
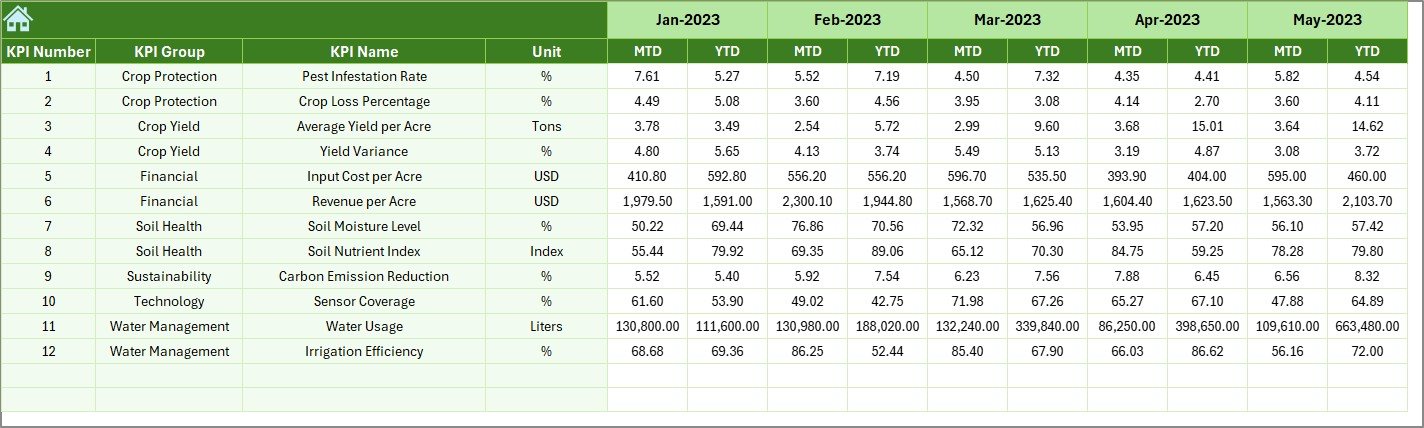
Previous Year Number Sheet Tab: Why Is Historical Comparison Important?
The Previous Year Number Sheet stores last year’s data.
Why This Sheet Matters:
- Enables year-over-year analysis
- Highlights growth or decline
- Supports seasonal comparison
Because agriculture depends on seasonality, PY comparisons become extremely valuable.
Click to buy Precision Agriculture KPI Dashboard in Excel
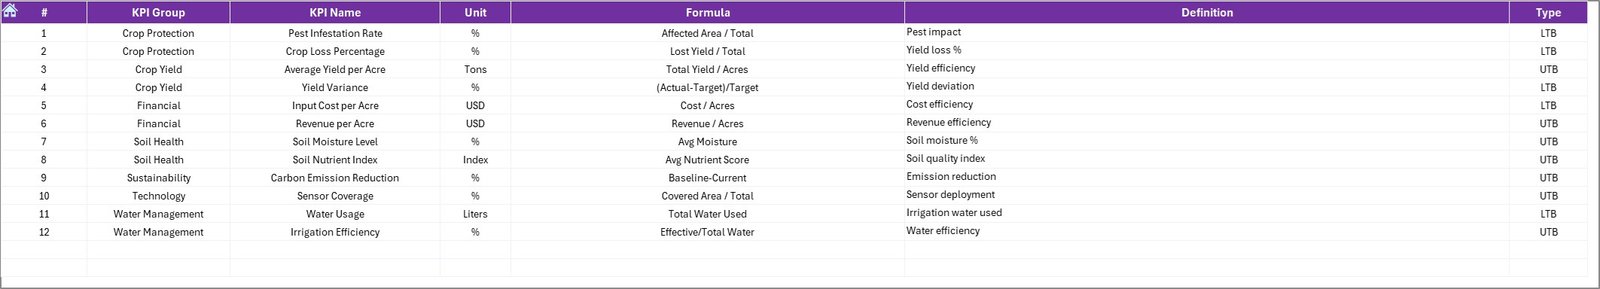
KPI Definition Sheet Tab: How Do You Maintain KPI Clarity?
The KPI Definition Sheet acts as a reference table.
Fields Included:
- KPI Name
- KPI Group
- Unit of Measurement
- KPI Formula
- KPI Definition
Because everyone uses the same definitions, confusion disappears across teams.
Click to buy Precision Agriculture KPI Dashboard in Excel
What Are the Advantages of a Precision Agriculture KPI Dashboard in Excel?
Using this dashboard offers multiple benefits.
Key Advantages:
- Centralized KPI tracking
- Easy-to-use Excel interface
- No advanced technical skills required
- Clear performance visibility
- Faster decision-making
- Reduced manual calculations
- Better farm planning
- Improved yield management
As a result, farms operate more efficiently and profitably.
How Does This Dashboard Improve Farm Decision-Making?
This dashboard supports smarter decisions by:
- Showing real-time KPI comparisons
- Highlighting performance gaps visually
- Supporting data-driven strategies
- Improving forecasting accuracy
Therefore, managers respond faster to issues like low yield or high input cost.
Why Choose Excel for Precision Agriculture KPI Tracking?
Excel remains a preferred tool because:
- It is widely available
- It works offline
- It supports formulas and charts
- It allows customization
- It integrates easily with other systems
Moreover, Excel dashboards remain cost-effective for farms of all sizes.
What Are the Best Practices for the Precision Agriculture KPI Dashboard in Excel?
Following best practices ensures long-term success.
Best Practices:
- Define KPIs clearly before data entry
- Update actual numbers regularly
- Validate data monthly
- Use consistent units of measurement
- Review trends instead of single months
- Compare actuals with targets frequently
- Keep KPI definitions updated
- Protect sheets to avoid accidental changes
When you follow these practices, dashboard accuracy improves significantly.
How Can You Customize This Dashboard for Your Farm?
Customization stays simple.
You can:
- Add crop-specific KPIs
- Modify KPI groups
- Adjust target values
- Add more months
- Extend charts for additional years
Because Excel stays flexible, customization does not require coding.
What Challenges Does This Dashboard Help Solve?
This dashboard solves many common agriculture challenges:
- Scattered data across files
- Manual KPI calculations
- Lack of performance visibility
- Delayed decision-making
- Inconsistent reporting
As a result, farms operate with better control and transparency.
How Does This Dashboard Support Sustainable Farming?
Precision agriculture focuses on sustainability. This dashboard supports it by:
- Tracking water usage efficiency
- Monitoring fertilizer optimization
- Reducing waste
- Improving yield per resource
Therefore, sustainability goals align with profitability.
Conclusion: Why Should You Use a Precision Agriculture KPI Dashboard in Excel?
A Precision Agriculture KPI Dashboard in Excel transforms farming data into actionable insights. It simplifies KPI tracking, improves visibility, and supports data-driven decisions. Because it works inside Excel, it remains accessible, affordable, and powerful.
Whether you manage a small farm or a large agribusiness, this dashboard helps you monitor performance, improve productivity, and maximize profitability.
Frequently Asked Questions (FAQs)
What is a Precision Agriculture KPI Dashboard in Excel used for?
It tracks, analyzes, and visualizes agriculture KPIs such as yield, cost, efficiency, and performance trends.
Can beginners use this dashboard easily?
Yes. The dashboard uses simple Excel features like drop-downs, charts, and tables.
Does this dashboard support monthly and yearly analysis?
Yes. It supports both MTD and YTD performance analysis.
Can I customize KPIs for different crops?
Absolutely. You can modify KPI names, groups, and formulas easily.
Do I need internet access to use this dashboard?
No. The dashboard works completely offline.
Can this dashboard replace farm management software?
It does not replace full software, but it provides strong KPI tracking and reporting support.
Is Excel suitable for precision agriculture analytics?
Yes. Excel works well for KPI analysis, visualization, and decision support.
Click to buy Precision Agriculture KPI Dashboard in Excel
Visit our YouTube channel to learn step-by-step video tutorials
Watch the step-by-step video tutorial: